Superimposed Boundary Sheets PowerPoint Charts - Instant Download | ImagineLayout


Files and Formats Included
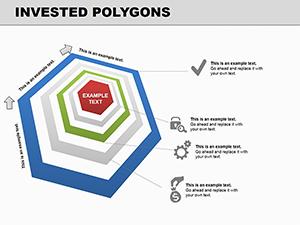
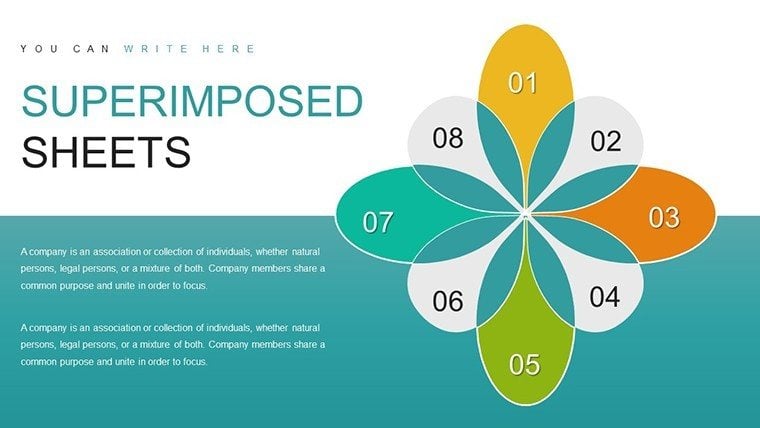
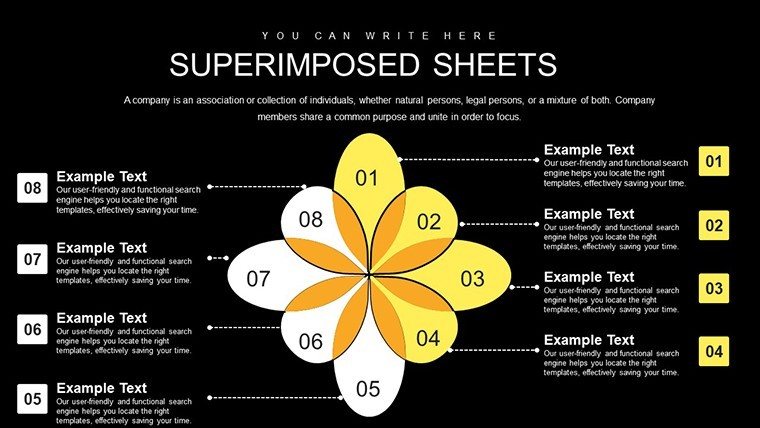
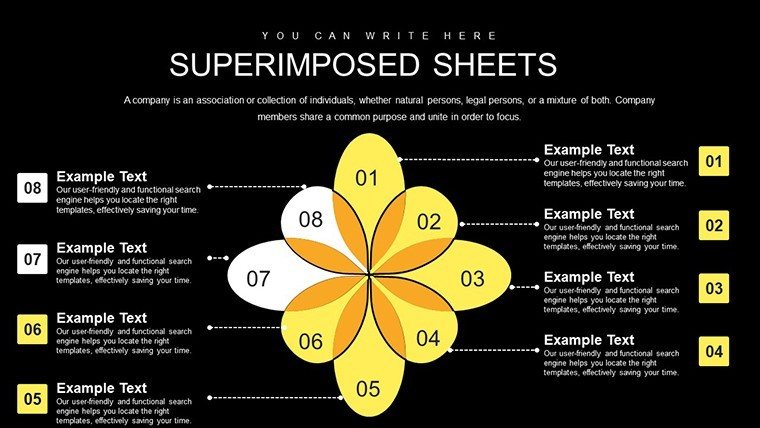
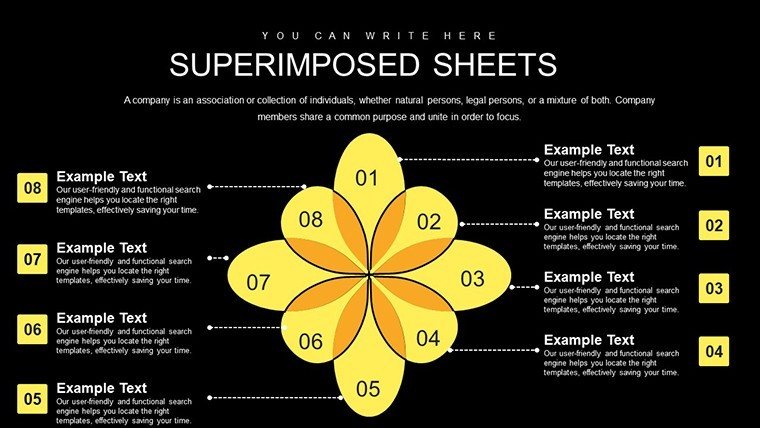
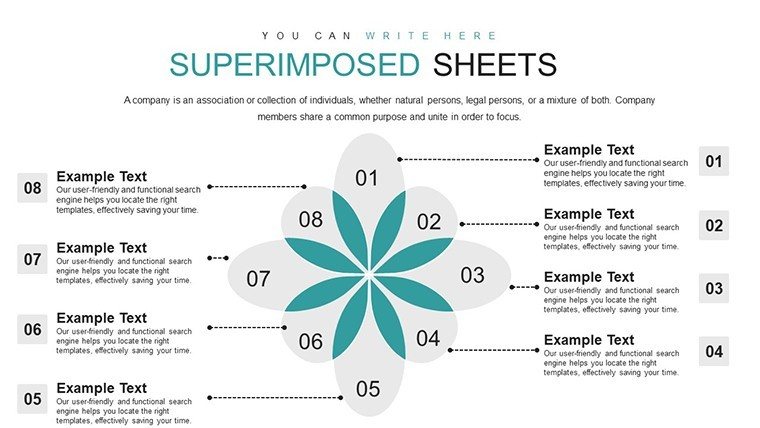
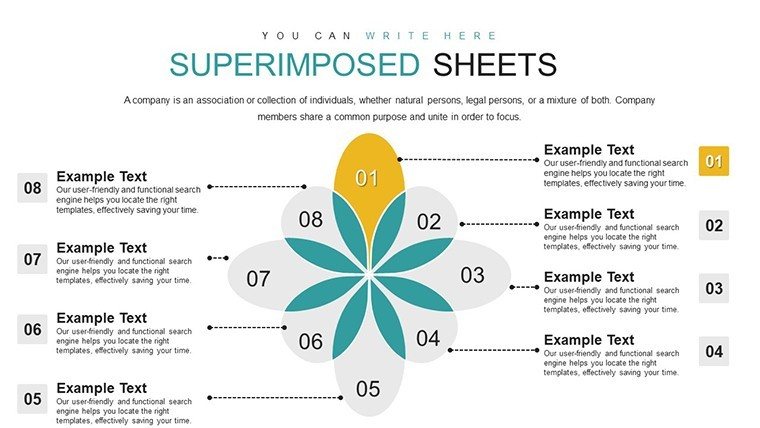
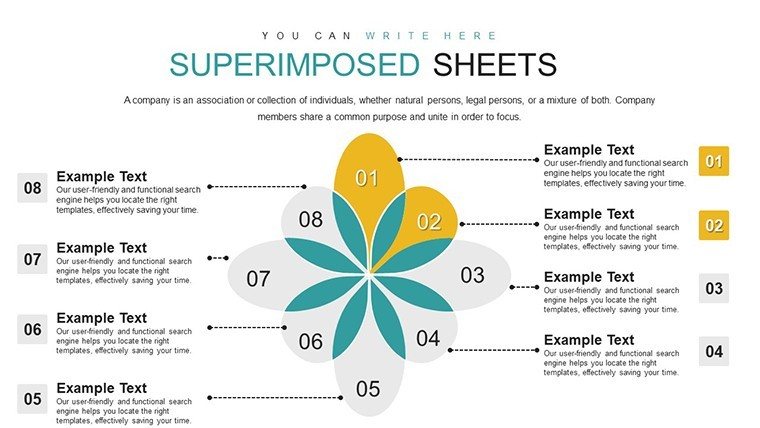
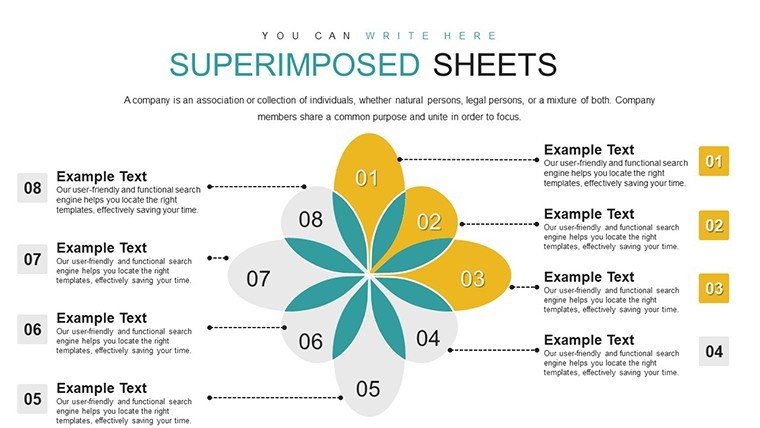
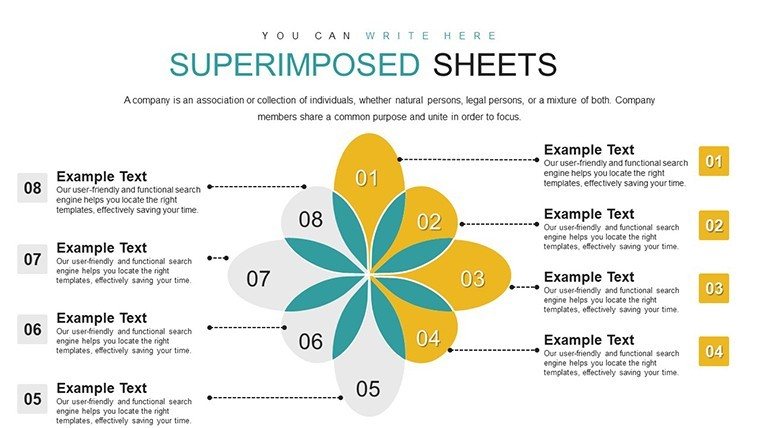
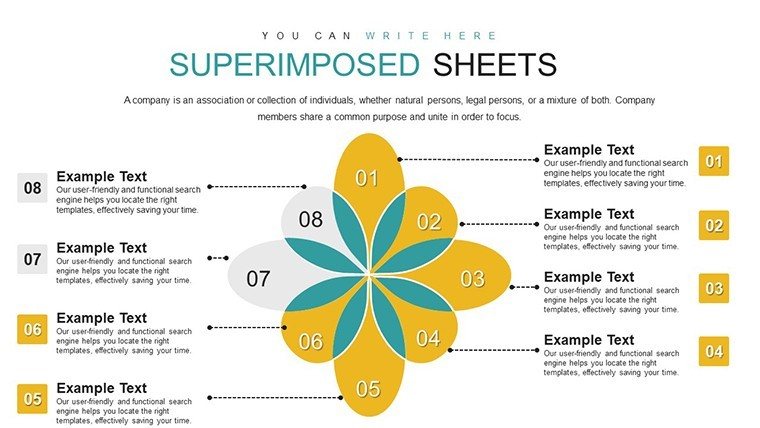
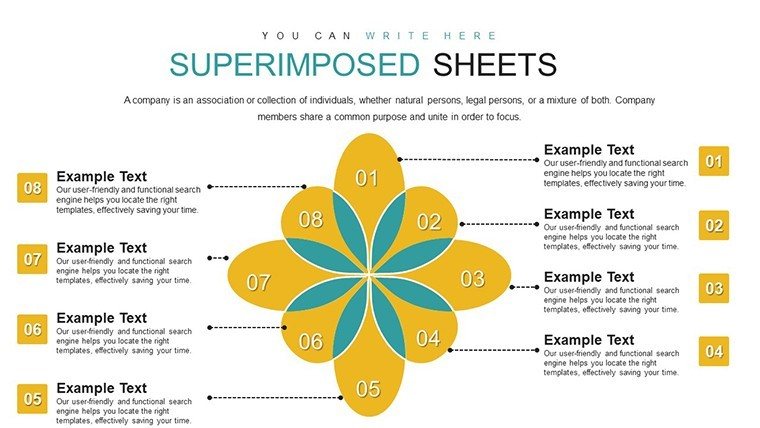
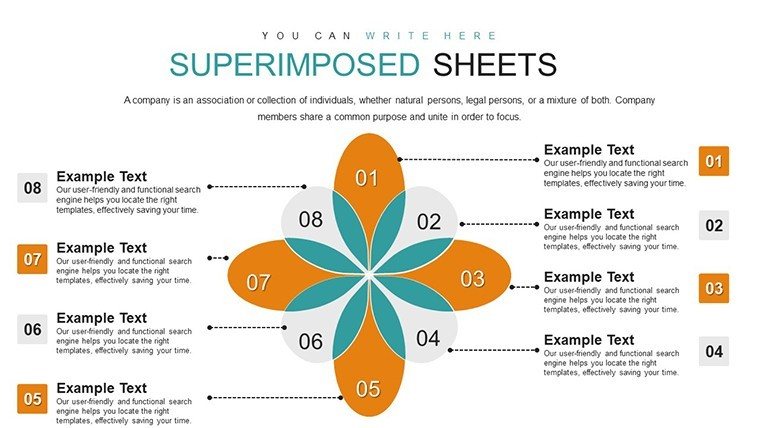
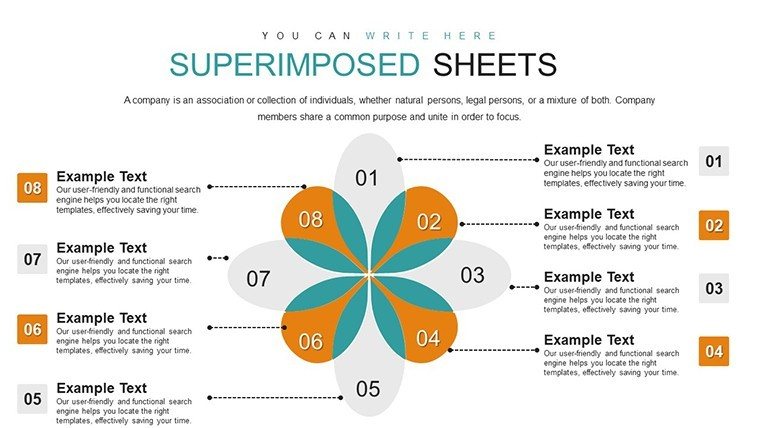
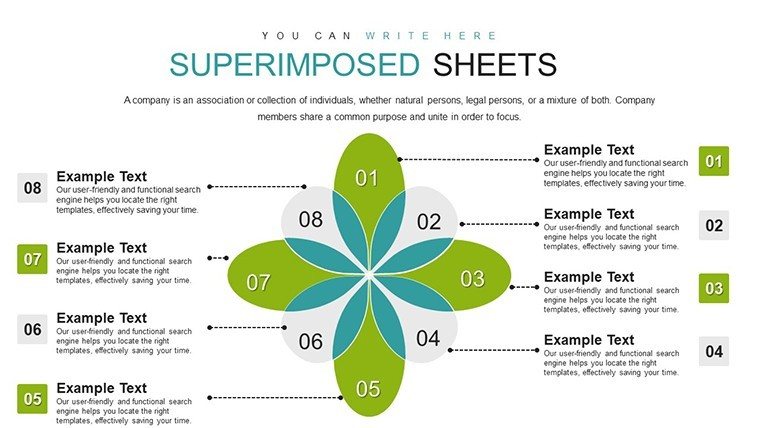
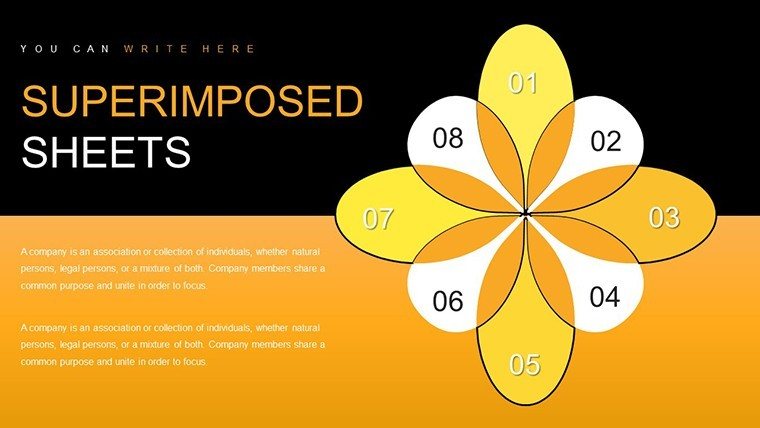
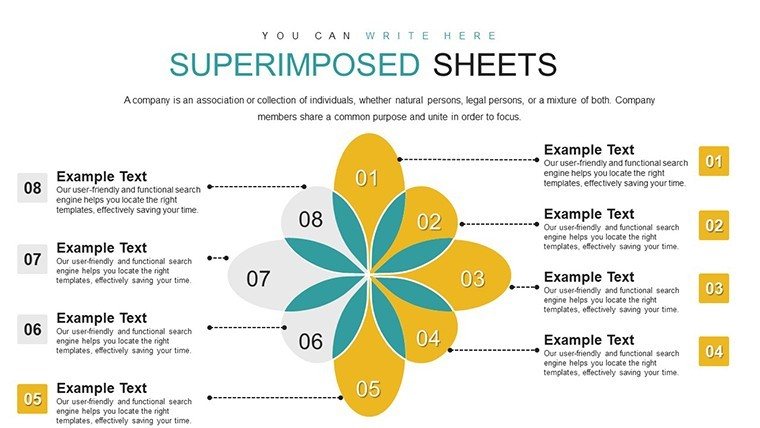
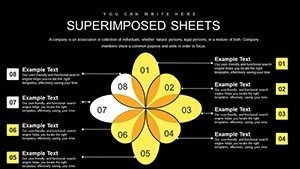
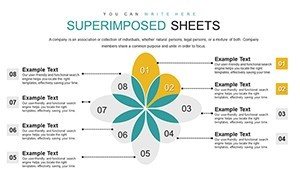
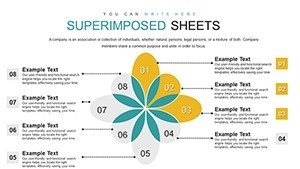
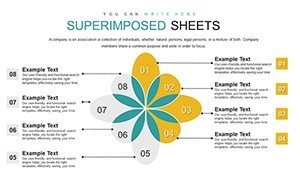
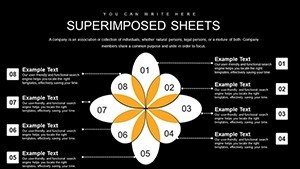
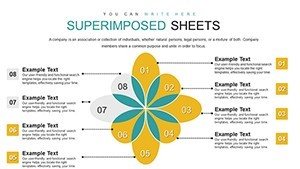
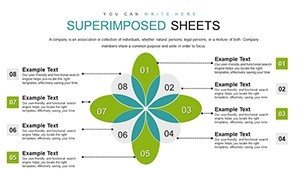
30 diagrams provide superimposed boundary configurations with variants for zoning overlays.
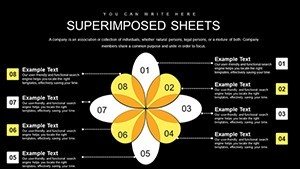
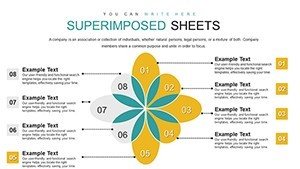
Layers combine to show property constraints while zone segmentation highlights shared areas.
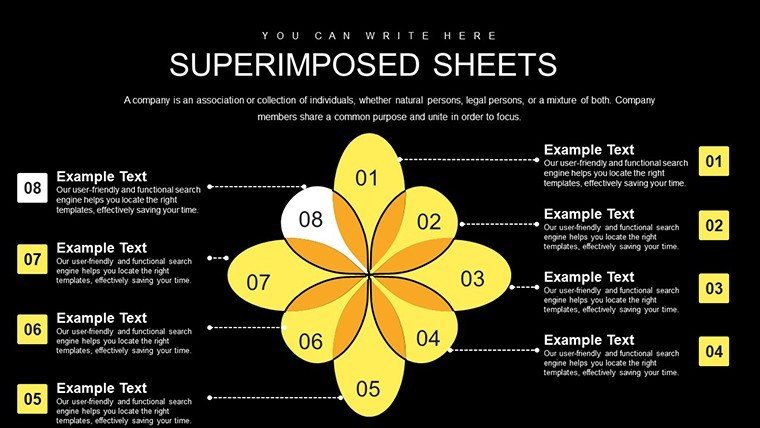
This superimposed version differs from standard matrix charts by supporting layered site data. The specific visual characteristic uses multiple overlapping sheets with color contrast. It works best for architects in development pitches because multi-layer boundaries fit without clutter compared to single-sheet neighbors. The paid version covers all 30 editable slides.
Format and Compatibility Details
| Feature | Details |
|---|---|
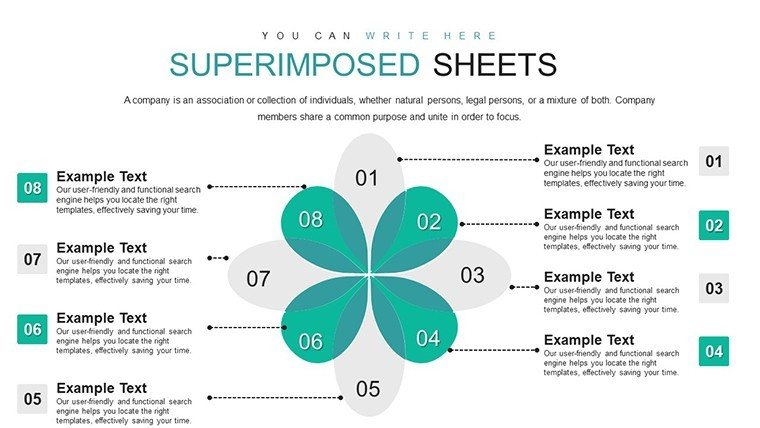
| Editable shapes | boundary layers resize and recolor independently |
| Text placeholders | labels update without unlocking grouped elements |
| Color theme adjustments | compatible with PowerPoint slide master palette |
| Diagram connectors | lines adjustable in direction and weight |
| Icon layers | icons replaceable without affecting layout |
| Export options | PPTX for editing and PDF for distribution |
| Aspect ratio | 16:9 standard |
| PowerPoint compatibility | 2016 and later on Windows or Mac |
Typical Use Cases by Role
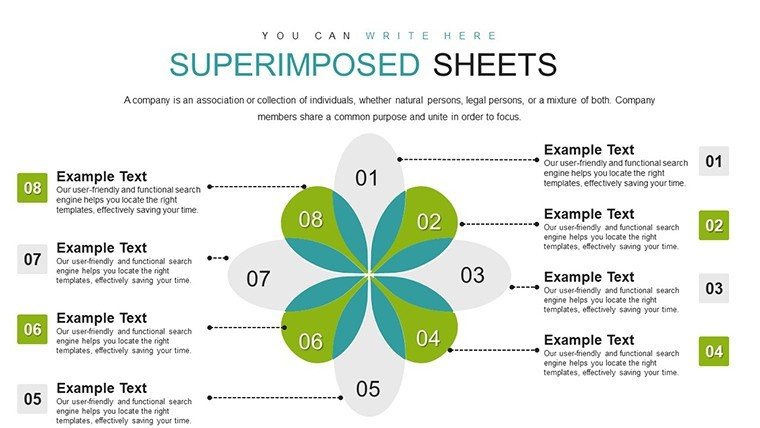
Architects in urban planning firms present zoning overlays during city council pitches.
They reused the same file across three multidisciplinary reports by swapping color schemes.
Project managers in real estate apply the boundary layers in client proposals.
The layered segmentation enabled instant grasp of site constraints.
Download the boundary sheets now for your next project.
Customization in 5 Steps
Editing difficulty is moderate.
- Open the .pptx file in PowerPoint 2016 or later (1 minute).
- Replace placeholder text with your content (3 minutes).
- Adjust brand colors via the slide master (2 minutes).
- Edit diagram labels and connectors (4 minutes).
- Export as PPTX or PDF (1 minute).
The Cost of Not Using a Template
Creating equivalent boundary layers manually requires four hours and advanced design skill.
Here you start with ready structures and finish in 15 minutes.
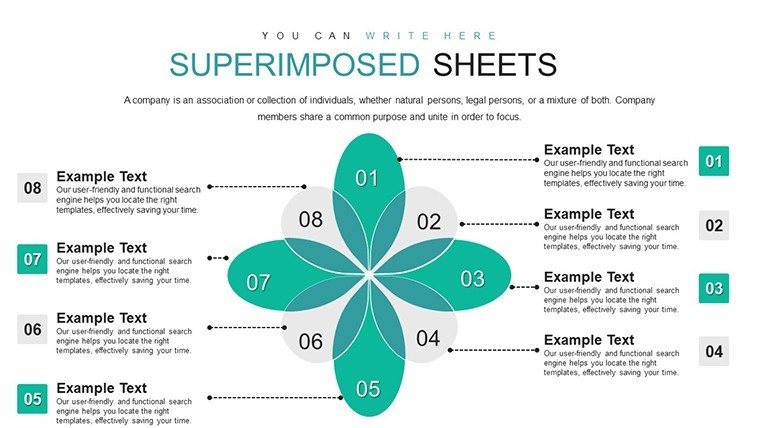
Manual overlays often misalign zones on projection screens.
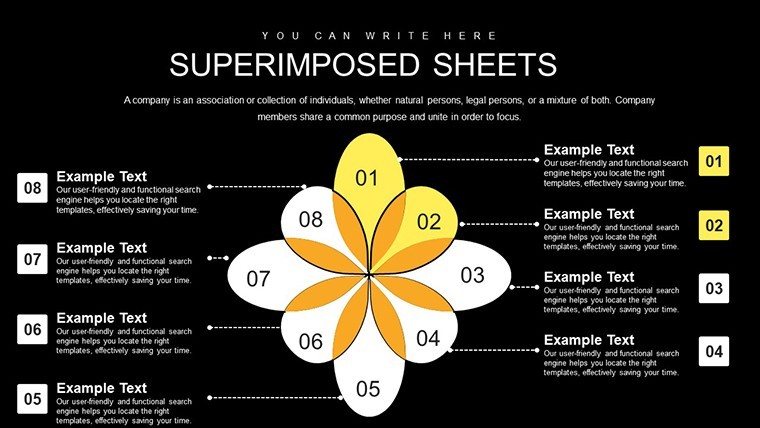
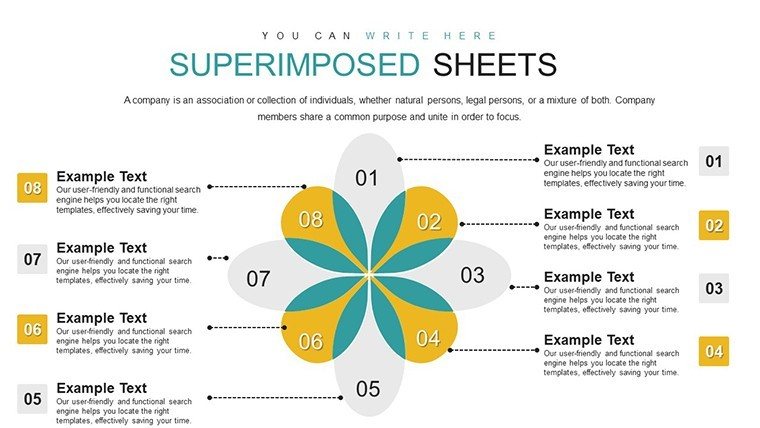
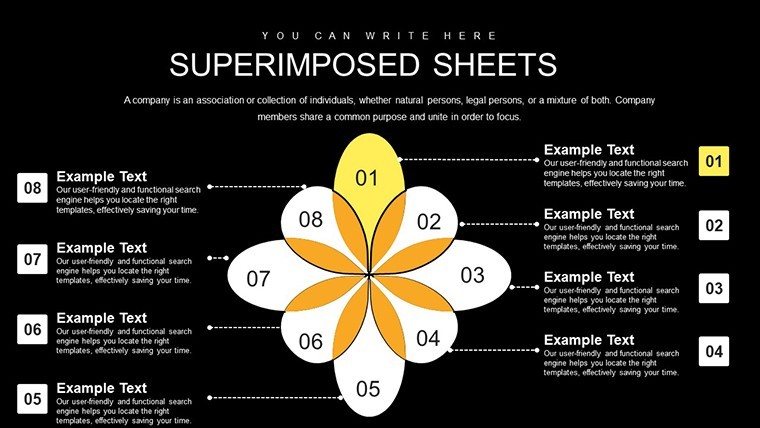
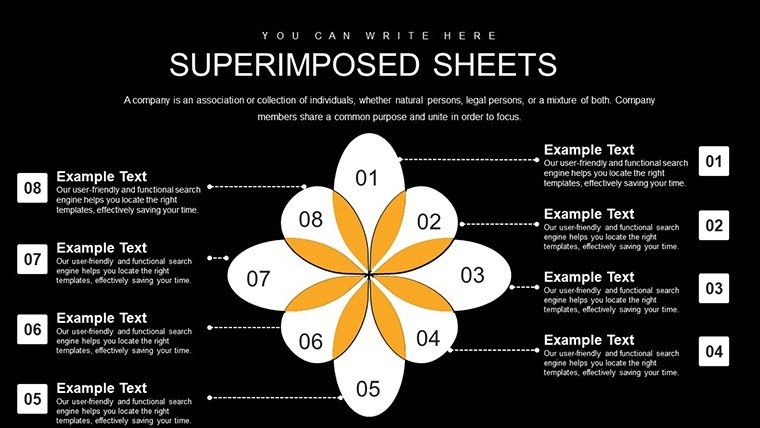
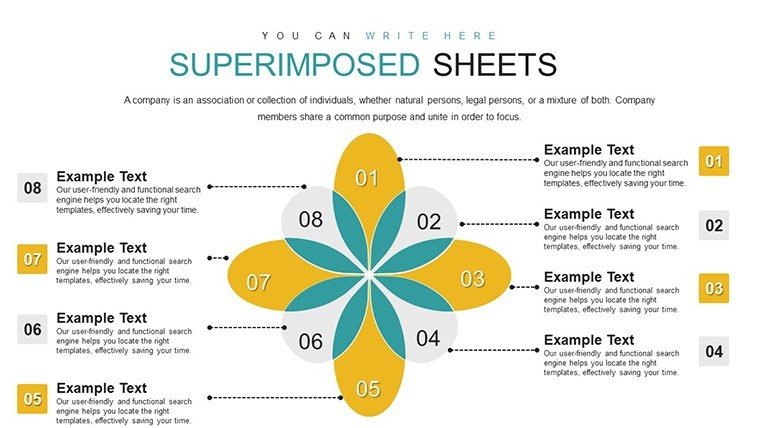
This layout places labels outside layers connected by thin lines maintaining readability during live meetings without adding editing complexity.
Get the template and save time on your next presentation.
Which PowerPoint versions support this file?
The PPTX format opens in PowerPoint 2016, 2019 and Microsoft 365 on both Windows and Mac systems. You simply double click the file after download. Compatibility extends to recent versions without additional plugins. Older versions prior to 2016 may require conversion but the layout remains intact.
How do you change the color scheme?
Open the slide master view in PowerPoint. Select the theme colors palette and update the main accent colors. All diagrams update automatically across the 30 slides. Save the master once and the entire file reflects your brand. This takes two minutes total.
What does the license permit?
The purchase grants rights for internal company use and client work presentations. You may not resell the file or sublicense the diagrams as standalone products. Commercial use in paid projects is allowed as long as the template forms part of a larger deck. Personal projects and academic lectures are fully permitted.
What file formats are included?
Only the PPTX format is provided which opens exclusively in PowerPoint software. No Keynote or other formats are available. Export options include PDF for distribution after editing. The single file contains all 30 diagrams ready for immediate use.
Is there a free version and what does the paid version add?
No free version exists. The paid purchase includes the complete set of 30 editable slides with full boundary layers. All editing features and export options are unlocked immediately upon download. The single tier covers every diagram variant shown on the page.
What is the refund policy?
Refunds are available if the file does not open in your version of PowerPoint within 30 days of purchase. Contact support with the issue description for processing. Provide proof of compatibility attempt and the team reviews each case individually. Approved refunds process within five business days.