Invested Polygons PowerPoint Charts Template


Type: PowerPoint Charts template
Category: Matrix
Sources Available: .pptx
Product ID: PC00189
Template incl.: 19 editable slides
Elevate your presentations with our Invested Polygons PowerPoint Charts Template. Download now for dynamic visuals and seamless customization. Perfect for professionals, educators, and businesses.
Invested Polygons PowerPoint Charts Template: Engage Your Audience
In the world of impactful presentations, the right visuals can make all the difference. Introducing our Invested Polygons PowerPoint Charts Template, a powerful tool designed to transform your presentations into captivating narratives. With a seamless blend of aesthetics and functionality, this template empowers professionals, educators, and businesses to deliver compelling messages with precision.
Why Choose Invested Polygons PowerPoint Charts?
Unparalleled Visual Appeal
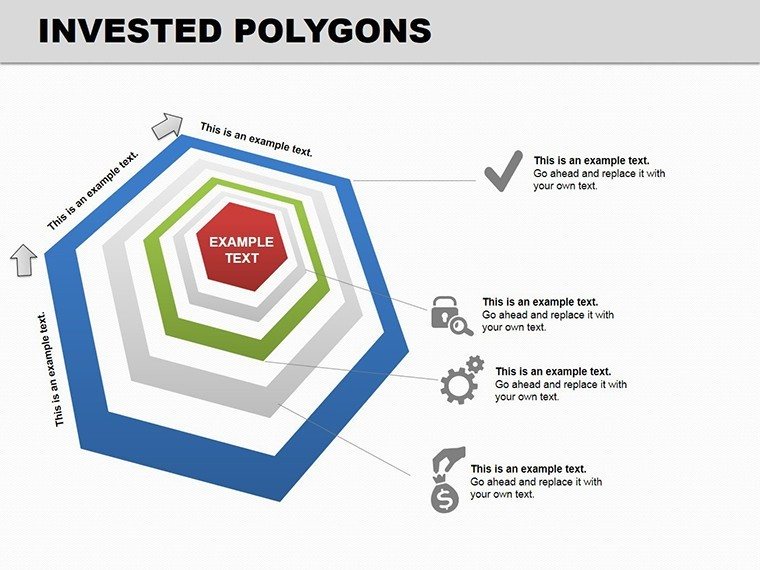
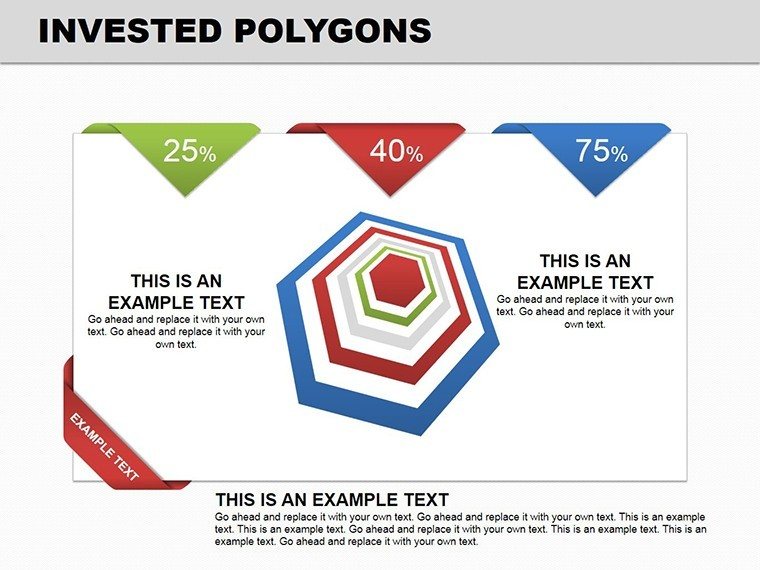
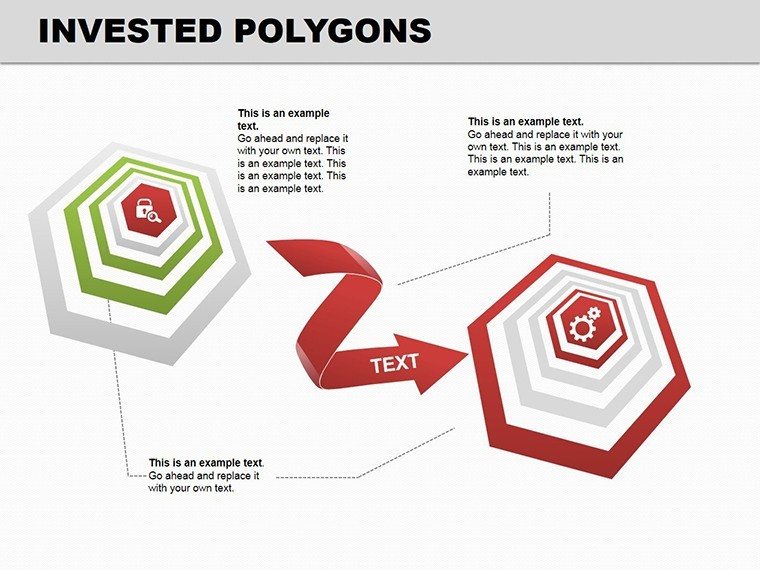
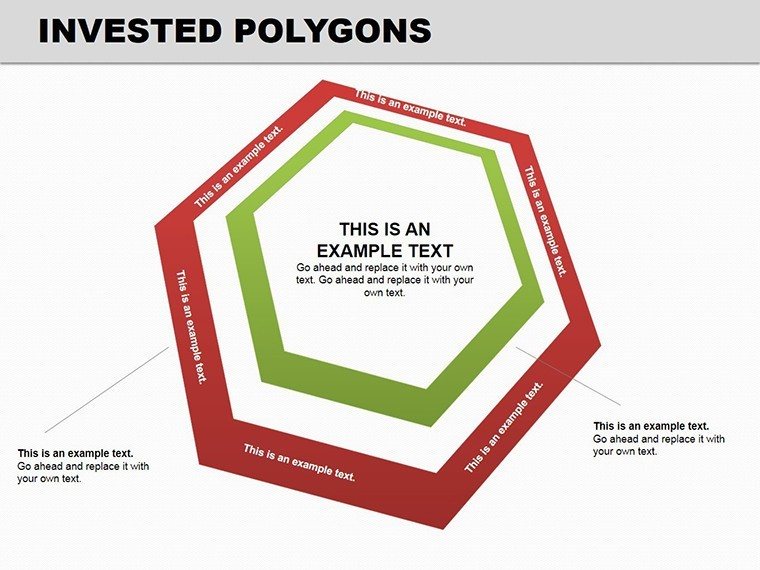
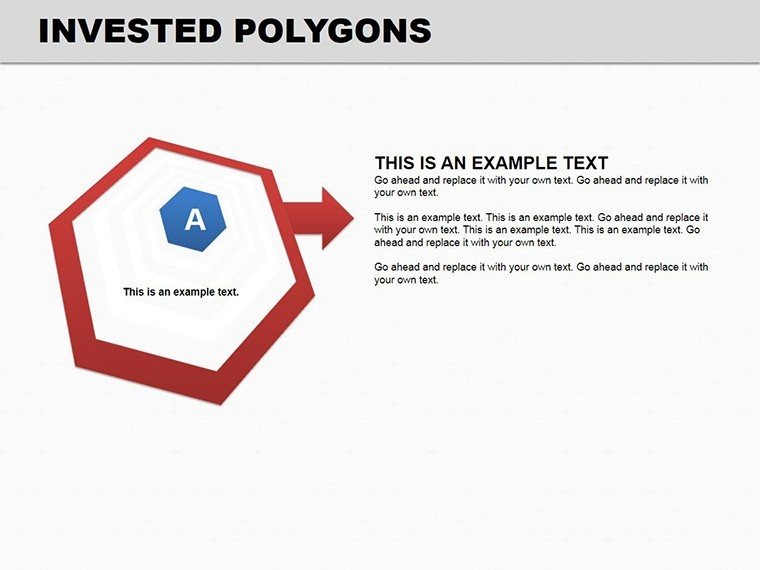
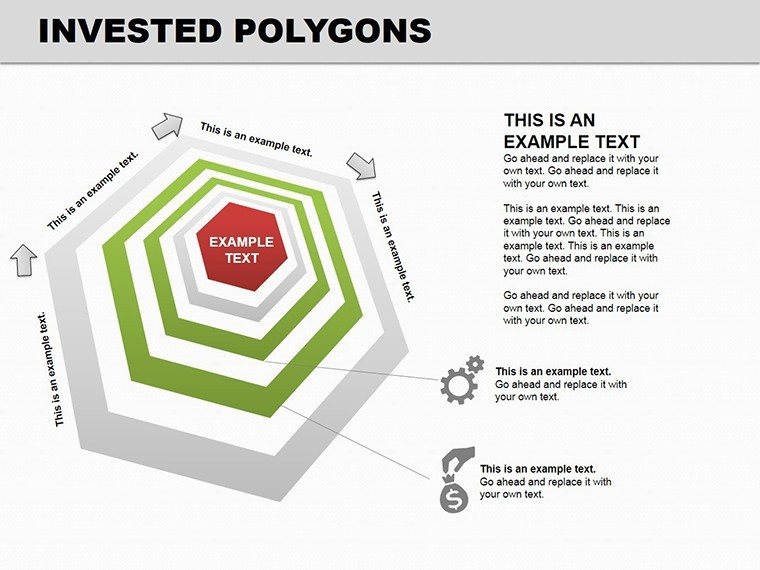
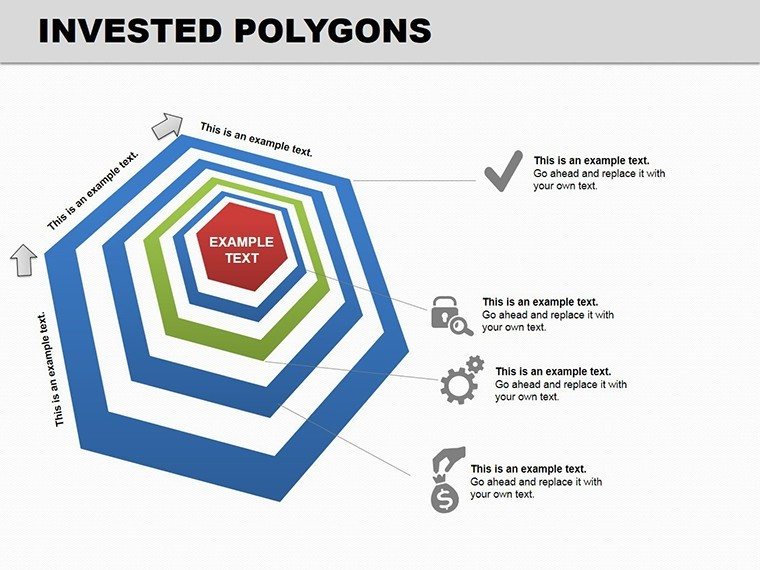
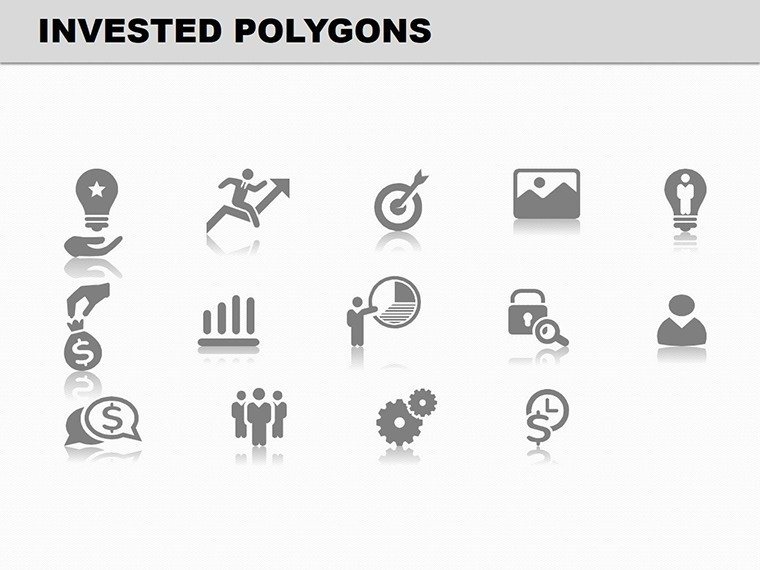
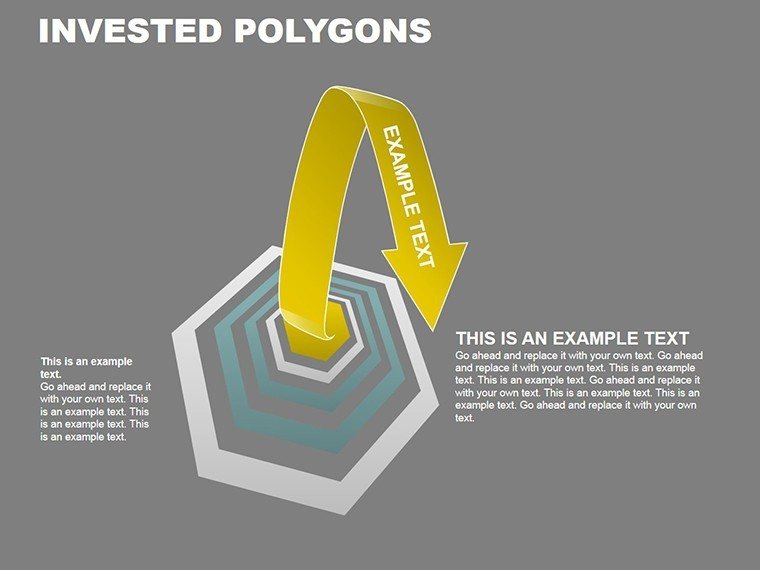
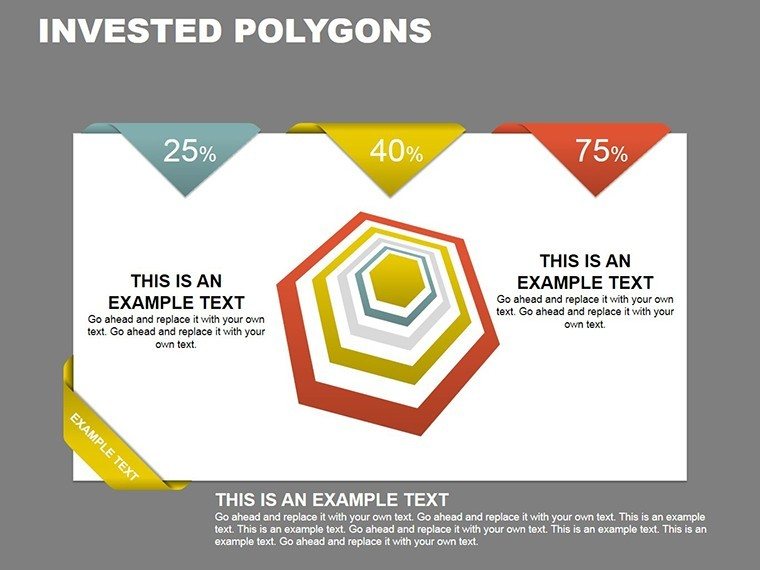
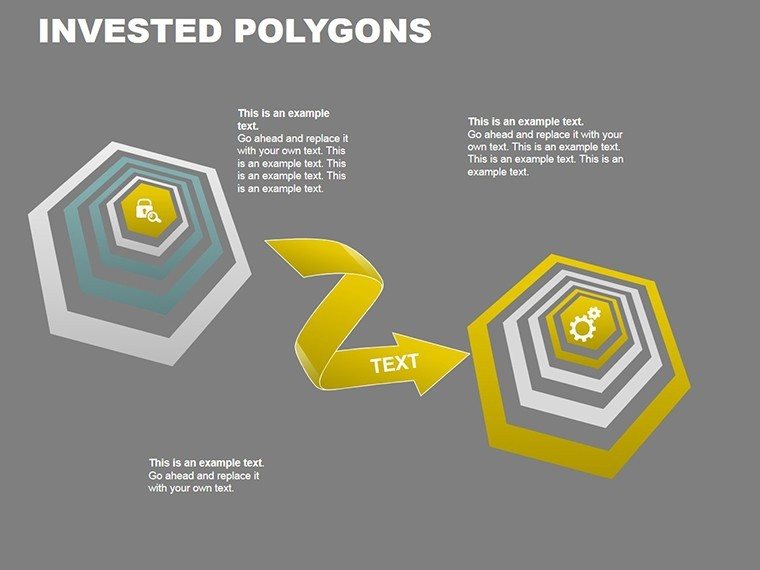
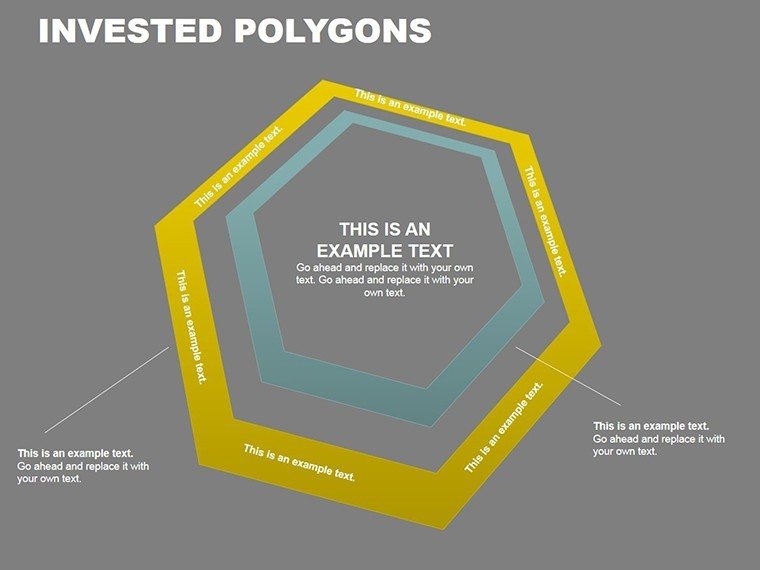
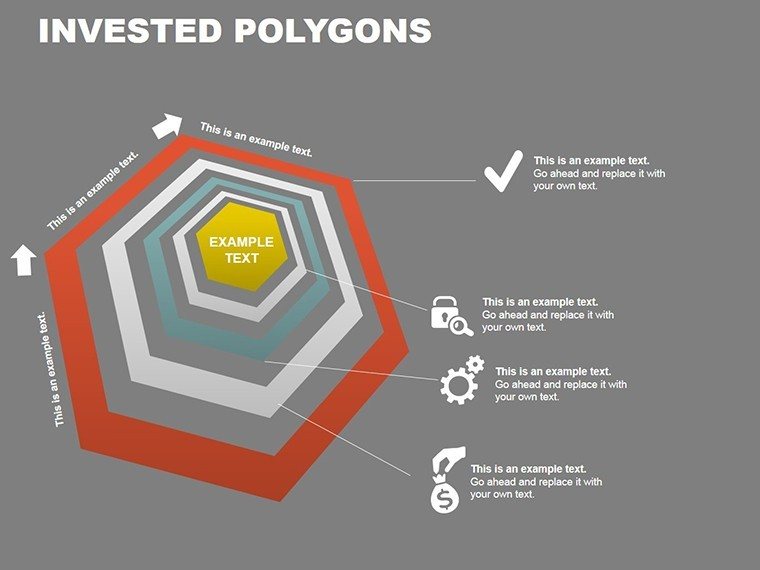
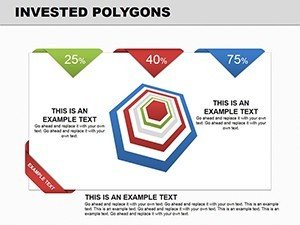
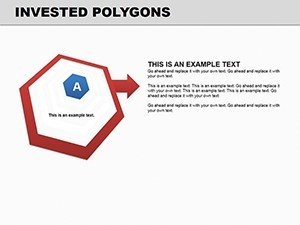
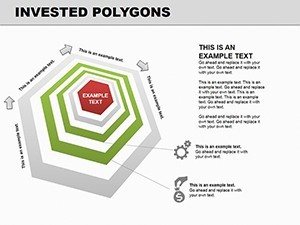
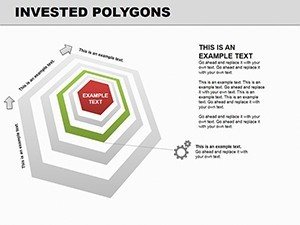
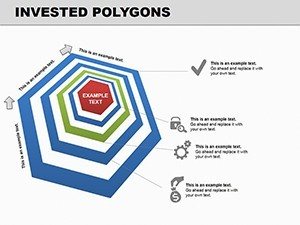
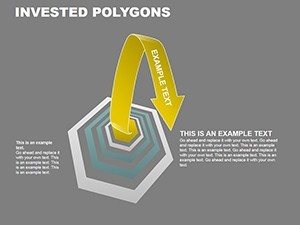
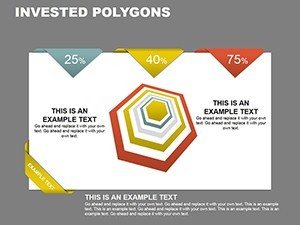
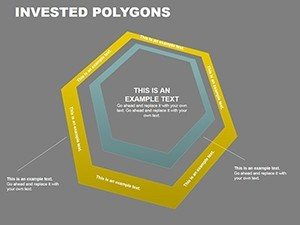
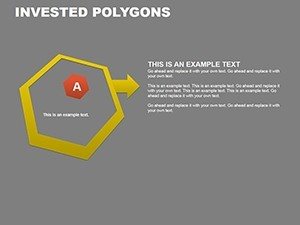
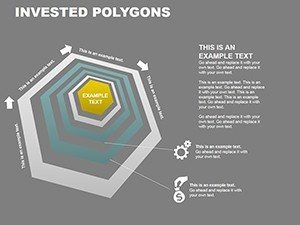
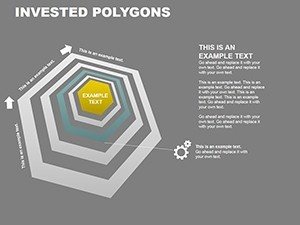
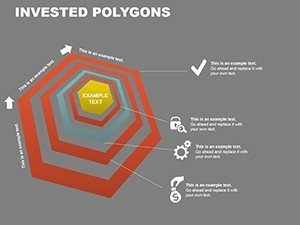
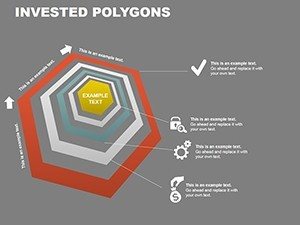
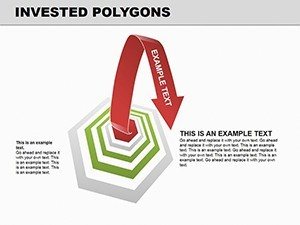
Capture your audience's attention from the first slide. Our Invested Polygons PowerPoint Charts Template boasts a stunning collection of meticulously crafted polygonal charts that breathe life into your data. The dynamic interplay of shapes and colors ensures that complex information is presented with clarity and elegance.
Versatile Customization Options
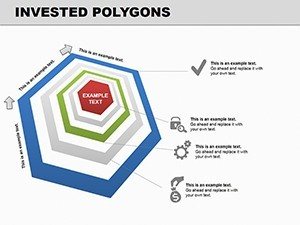
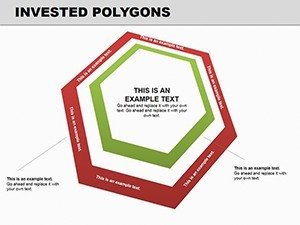
Tailor your presentations to perfection. Our template offers a wealth of customization options, allowing you to effortlessly align the visual elements with your brand's identity. Adjust colors, sizes, and layouts to create a consistent and professional look that resonates with your audience.
Seamless Integration
Integrating our Invested Polygons PowerPoint Charts Template into your workflow is a breeze. Whether you're a seasoned presenter or a novice, our user-friendly interface ensures a seamless experience. Elevate your presentations without the hassle, and leave a lasting impression on your viewers.
Who Benefits from Invested Polygons PowerPoint Charts?
Professionals: Elevate your pitches, reports, and analyses with engaging visuals that underscore your expertise.
Educators: Transform learning experiences with visually compelling lessons that resonate with students of all ages.
Businesses: Convey your company's story, data insights, and future strategies in a visually impactful manner to stakeholders and clients.
Invest in Impactful Presentations
Invested Polygons PowerPoint Charts Template is more than just a collection of visuals – it's your gateway to creating presentations that leave a lasting impact. Engage your audience, showcase your insights, and convey your message with the power of polygons. Download now and unlock the potential of dynamic storytelling.
Elevate your presentations today with Invested Polygons PowerPoint Charts Template. Download now for a seamless blend of aesthetics and functionality that captivates your audience. Perfect for professionals, educators, and businesses seeking to make their mark in the world of presentations. Transform data into narratives and ideas into action. Get started now!