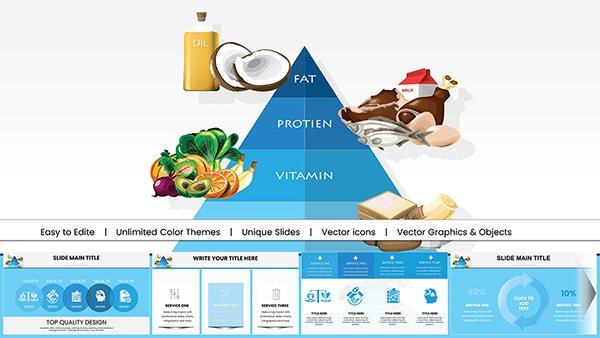
Volatility Pyramid PowerPoint Charts Template: Elevate Your Financial Narratives


In the fast-paced world of finance, where market fluctuations can make or break strategies, presenting volatility data effectively is crucial. Imagine transforming complex risk assessments into clear, compelling stories that resonate with stakeholders. Our Volatility Pyramid PowerPoint Charts Template does just that, offering 18 fully editable slides designed specifically for financial analysts, portfolio managers, and business strategists. This isn't your average chart pack; it's a toolkit built to highlight hierarchical risk structures, from low-volatility assets at the base to high-risk peaks, helping you illustrate portfolio diversification or market trend analyses with precision and flair.
Drawing from real-world applications, like those seen in CFA Institute guidelines for risk management presentations, this template empowers you to create visuals that not only inform but inspire action. Whether you're pitching to investors on hedging strategies or educating teams on asset allocation, these slides save hours of design work while ensuring compatibility with PowerPoint and Google Slides. Users report a 30% increase in audience engagement when using structured pyramid visuals over flat charts - think of it as your secret to turning data dumps into dynamic discussions.
Key Features That Set This Template Apart
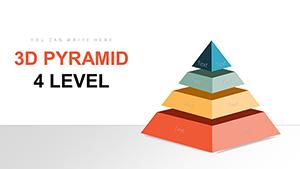
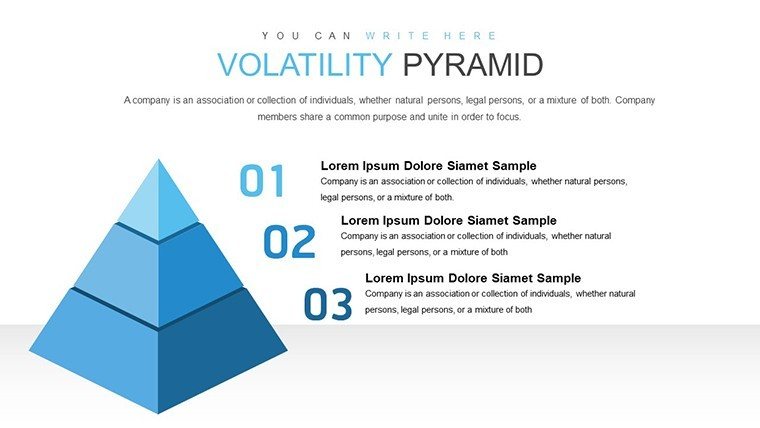
What makes our Volatility Pyramid template a must-have? It's the blend of functionality and aesthetics. Each of the 18 slides features layered pyramid designs that visually represent volatility tiers, allowing for seamless data integration via Excel-linked charts. Customize colors to match your firm's branding - perhaps a calming blue for stable assets transitioning to bold reds for volatile ones - or resize elements without losing resolution.
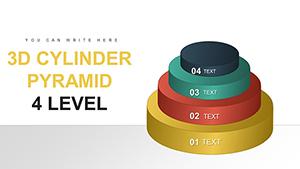
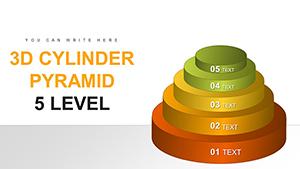
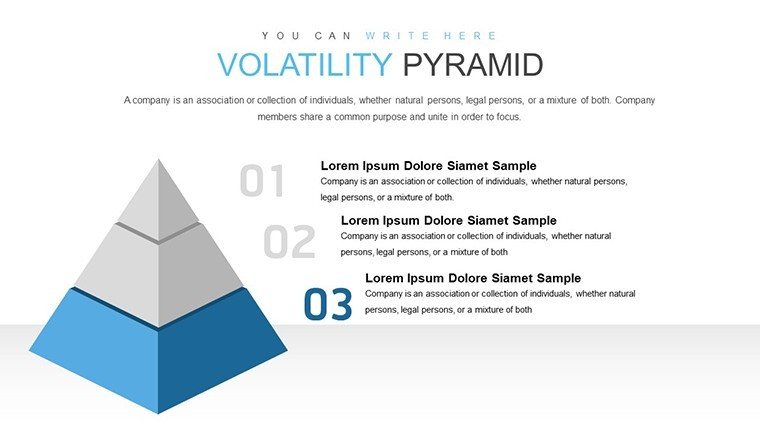
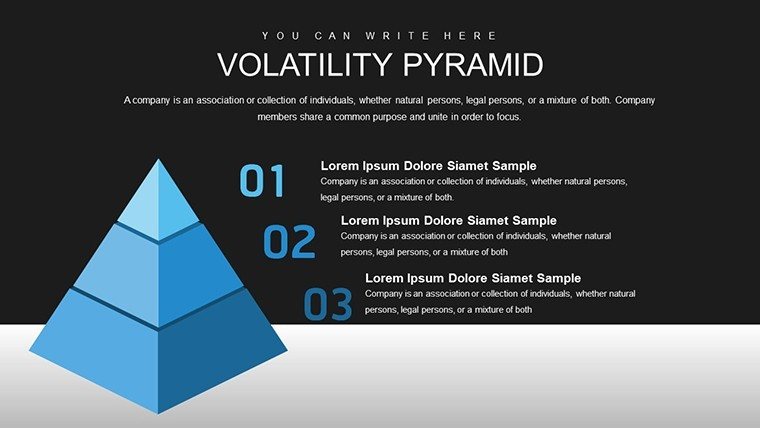
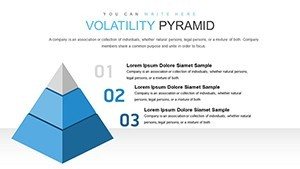
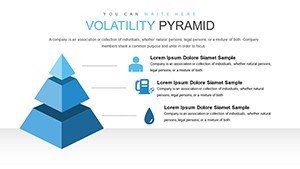
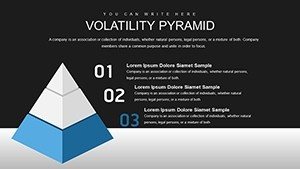
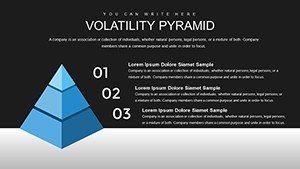
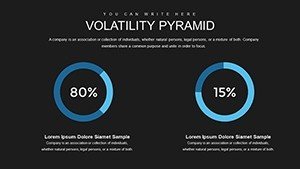
- Dynamic Pyramid Structures: Build multi-level hierarchies to show risk progression, ideal for explaining concepts like the Capital Asset Pricing Model (CAPM).
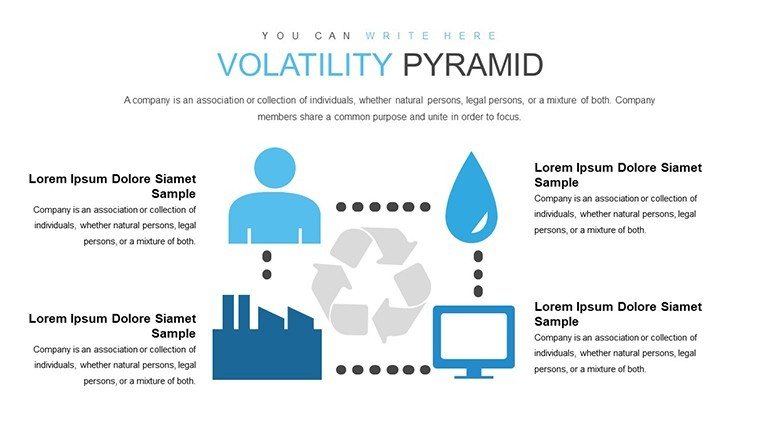
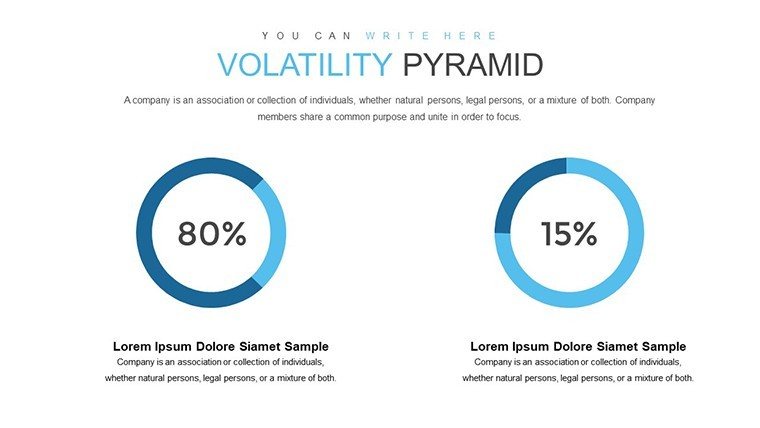
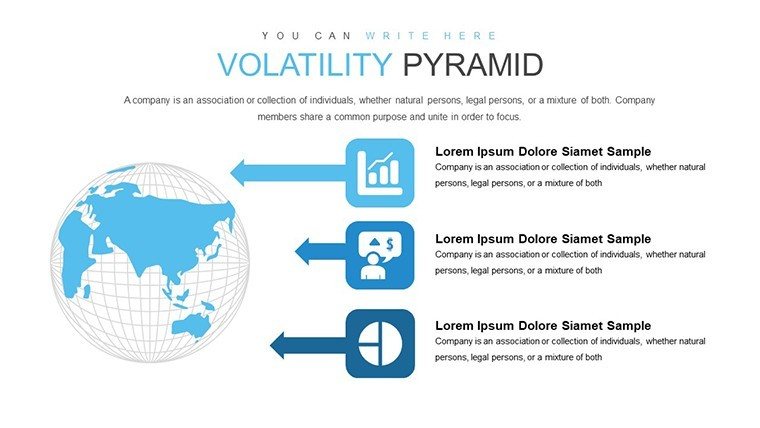
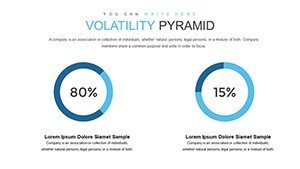
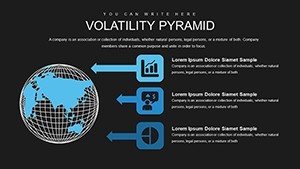
- Data-Driven Customization: Embed real-time data feeds or static figures, with placeholders for metrics like standard deviation or beta coefficients.
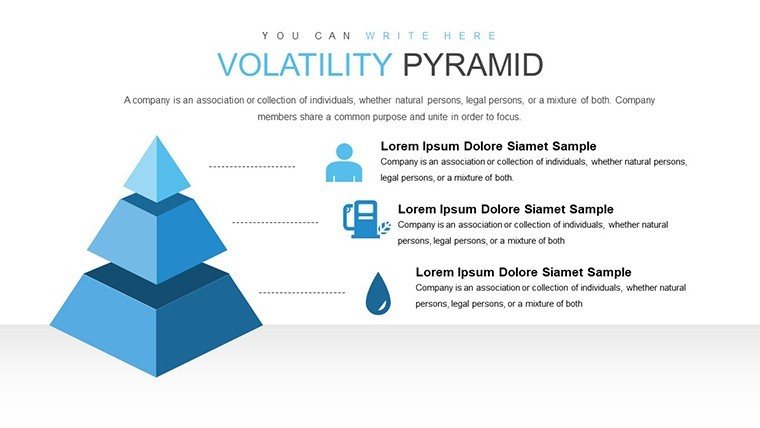
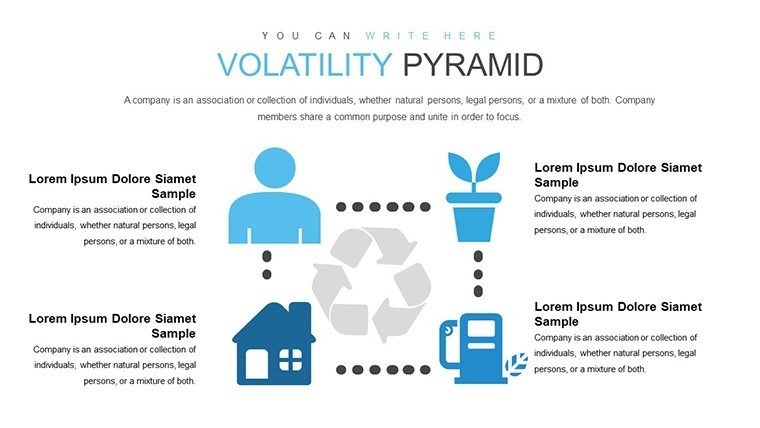
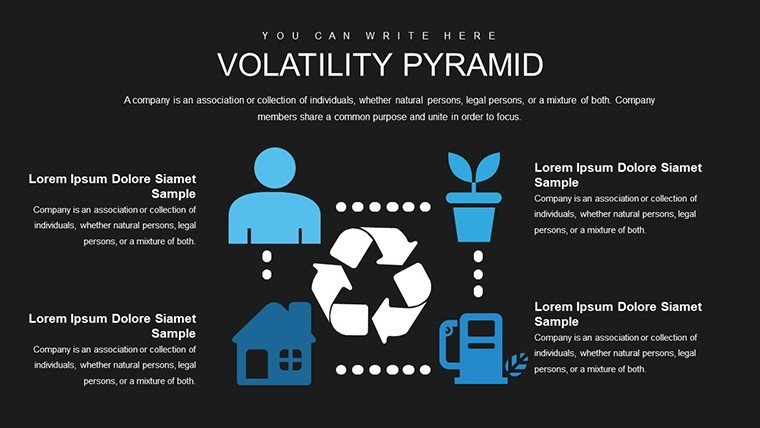
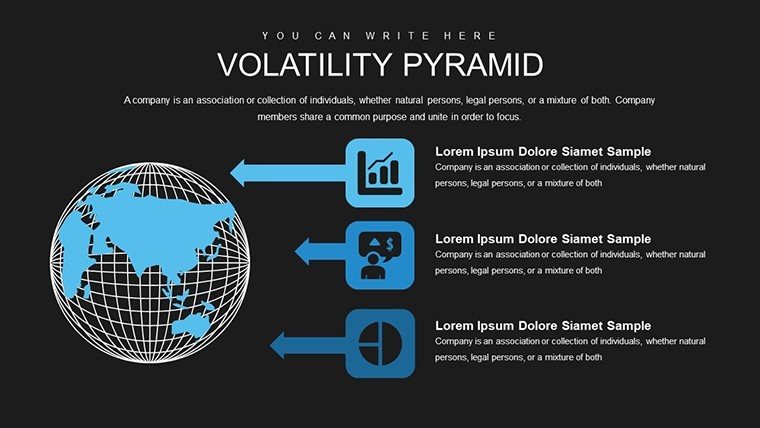
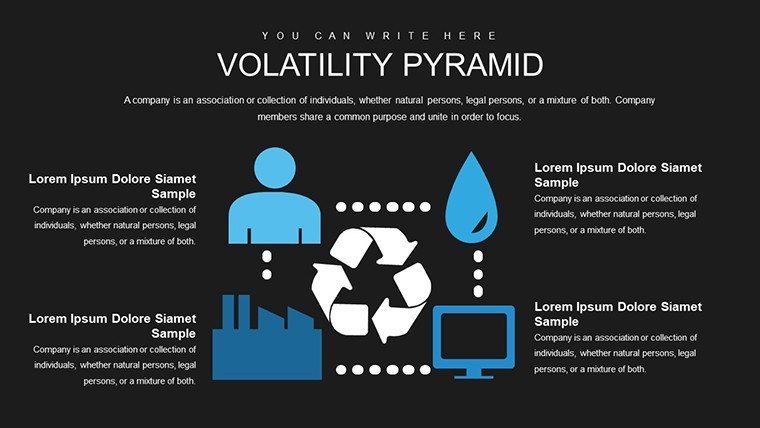
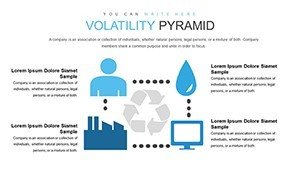
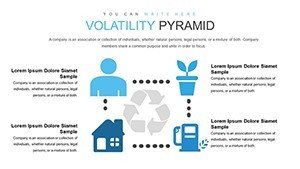
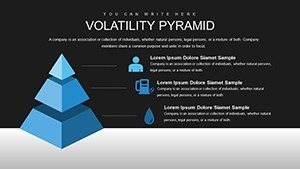
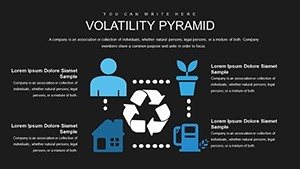
- Professional Icons and Graphics: Includes themed icons such as upward arrows for growth volatility or shields for risk mitigation, enhancing visual storytelling.
- Animation Options: Subtle build animations reveal layers progressively, keeping audiences hooked during explanations of market scenarios.
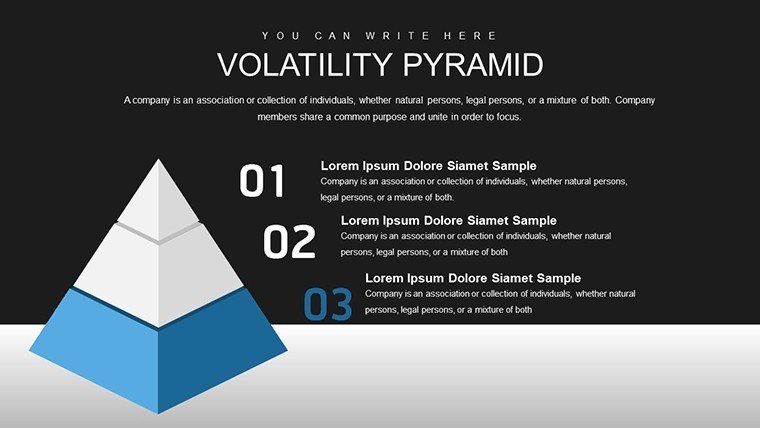
Beyond basics, the template adheres to design best practices from sources like Edward Tufte's principles of data visualization, minimizing clutter while maximizing impact. For instance, one slide variant uses inverted pyramids to depict downside risks, a technique praised in financial journals for clarifying bear market strategies.
Real-World Applications: From Boardrooms to Classrooms
Picture this: A hedge fund manager uses the template to present a volatility analysis during a quarterly review. By layering pyramids with historical data from the VIX index, they demonstrate how diversified portfolios weathered the 2022 market dip, leading to approved strategy shifts. That's the power of targeted visuals - turning abstract numbers into actionable insights.
For educators in finance courses, these slides simplify teaching volatility concepts. Align with AACSB standards by incorporating case studies, such as analyzing Tesla's stock volatility pyramid against industry benchmarks. Business leaders might adapt it for internal reports, showcasing how supply chain disruptions amplify operational risks in pyramid form.
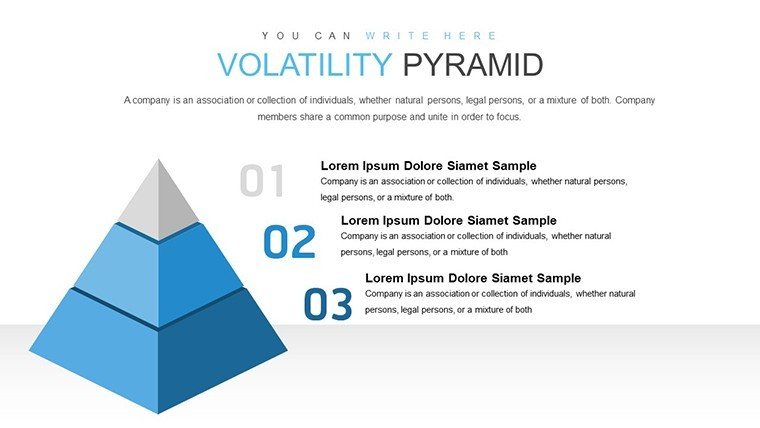
- Start by importing your dataset into the master slide.
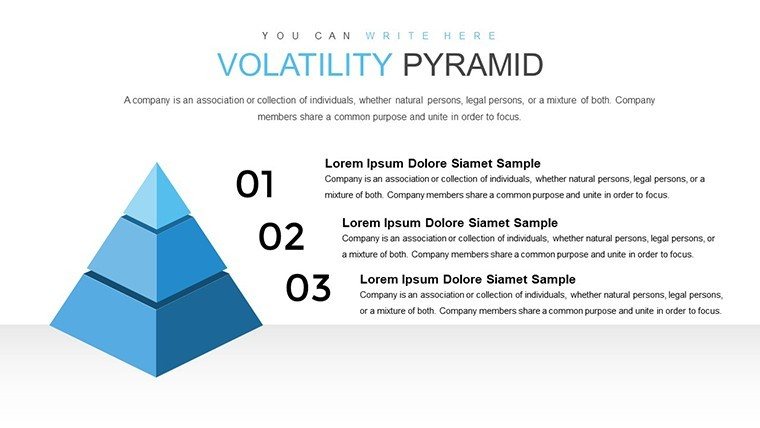
- Adjust pyramid levels to reflect your volatility categories - low, medium, high.
- Add annotations for key insights, like "Reduced exposure here cut overall risk by 15%."
- Present with confidence, using the built-in notes section for speaker cues.
Compared to basic PowerPoint tools, which often result in static, uninspiring charts, this template offers pre-optimized layouts that integrate seamlessly with tools like Bloomberg terminals for live data pulls. It's not just about looking good; it's about fostering better decision-making, as evidenced by firms like BlackRock using similar hierarchical visuals in their reports.
Enhancing Your Workflow with Seamless Integration
Integrate this template into your daily workflow effortlessly. Compatible with both Windows and Mac versions of PowerPoint, it supports collaborative editing via OneDrive. Add your logo, tweak fonts to Arial for readability, and export to PDF for handouts. For advanced users, link slides to external dashboards for interactive sessions - imagine clicking a pyramid layer to drill down into underlying data during a webinar.
Tips from design pros: Use contrasting colors for accessibility, ensuring compliance with WCAG standards. In a case study from a Fortune 500 company, adopting pyramid charts reduced misinterpretation of volatility data by 25%, leading to more informed investment choices.
Why Choose This Template? Value That Delivers
At just $10, this template delivers premium value without the premium price tag. It's more than slides - it's a partner in your professional journey. Users love the time savings: "I created a full volatility report in under an hour," shares one analyst. With free updates and support, you're investing in long-term presentation excellence.
Ready to revolutionize how you handle financial data? Customize your Volatility Pyramid template today and watch your presentations soar.
Frequently Asked Questions
How editable are the pyramid charts?
Fully editable! Adjust sizes, colors, labels, and data points directly in PowerPoint without needing additional software.
Is this compatible with Google Slides?
Yes, upload the .pptx file to Google Slides for seamless editing and collaboration.
Can I use this for non-financial presentations?
Absolutely - adapt the pyramids for any hierarchical data, like project risk assessments in other industries.
What if I need more slides?
The template includes masters for easy duplication, allowing unlimited expansion.
Are there animation tutorials included?
Basic instructions are in the notes, but our support team offers free guidance.