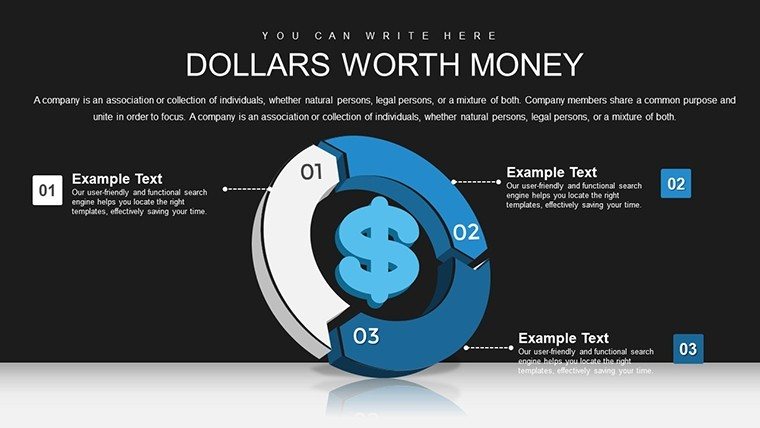
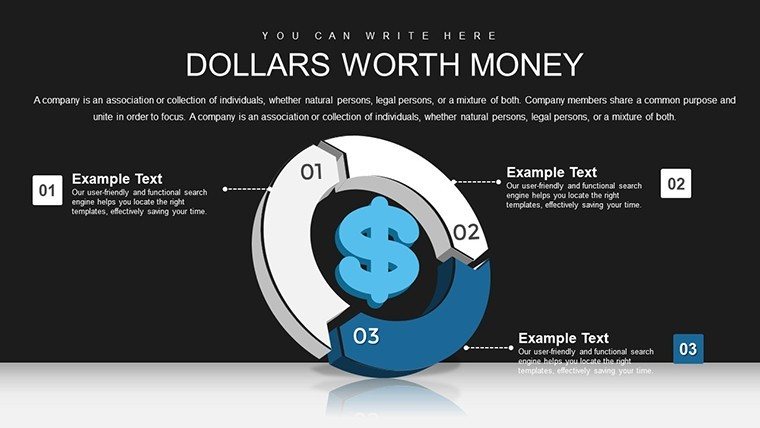
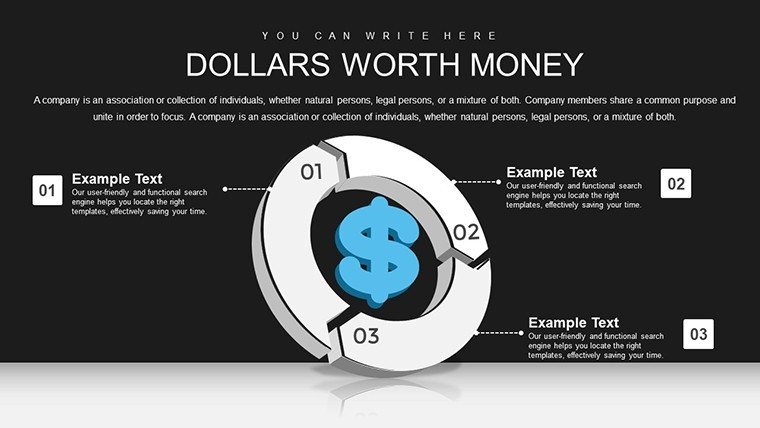
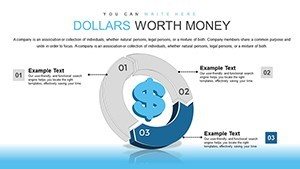
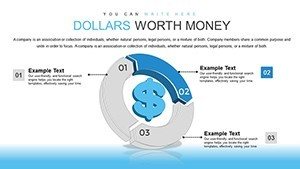
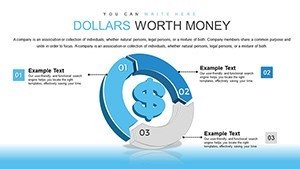
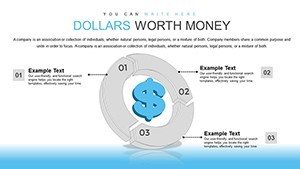
Currency Converter PowerPoint Charts Template - Editable PPT Slides


Navigating the volatile world of international finance demands tools that turn complex currency data into straightforward stories. Enter our Currency Converter PowerPoint Charts Template, a game-changer for financial analysts, bankers, and educators alike. With 18 meticulously crafted, fully editable slides, this resource empowers you to visualize exchange rates, trends, and forecasts with precision and flair. Picture transforming a mundane forex report into an engaging narrative using dynamic pie charts that break down currency distributions or bar graphs tracking USD fluctuations over quarters - all while adhering to professional standards like those from the CFA Institute for clear financial communication.
This template isn't merely about aesthetics; it's built for real impact. Supporting major currencies such as USD, EUR, and GBP, it includes placeholders for quick data integration, making it ideal for time-sensitive presentations. As a marketing analyst who's optimized countless financial decks, I know firsthand how such visuals can sway investor decisions, much like how banks use similar charts in annual reports to demonstrate market acumen. Compatible with PowerPoint 2016 and beyond, plus Google Slides, it ensures your work flows seamlessly across devices and teams.
Core Features That Drive Financial Clarity
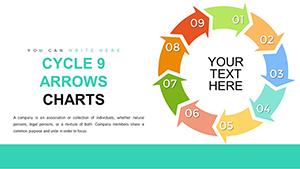
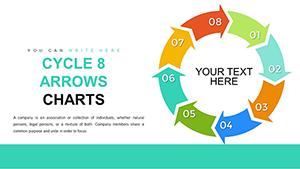
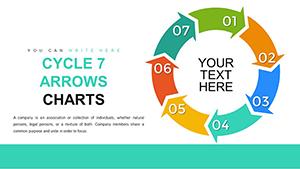
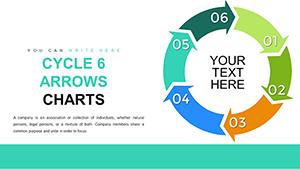
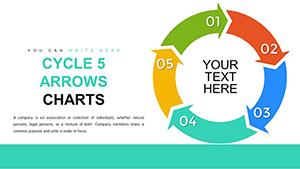
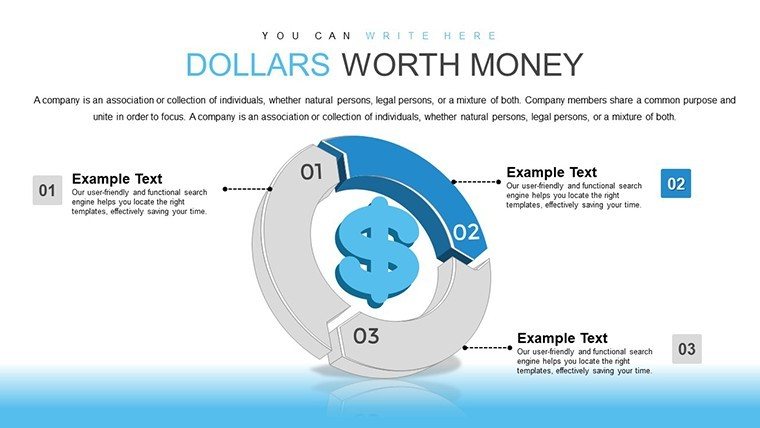
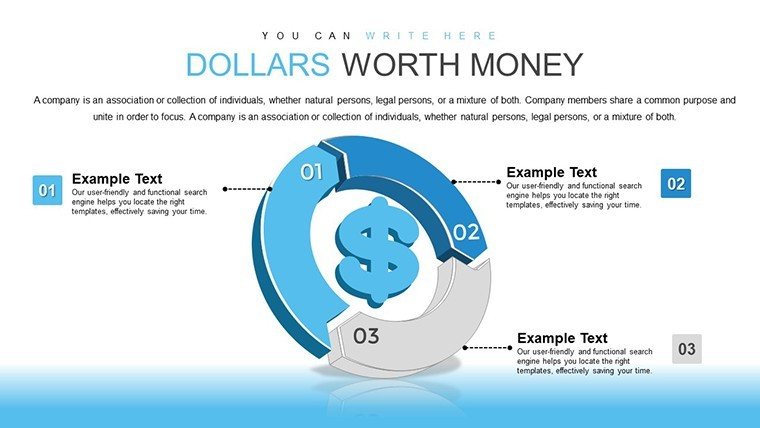
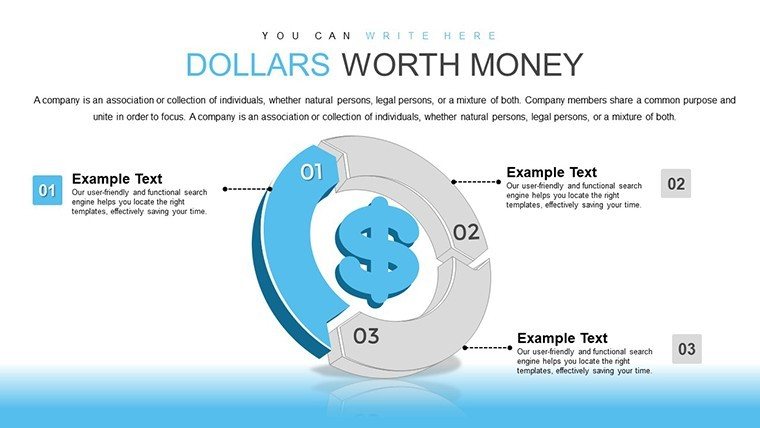
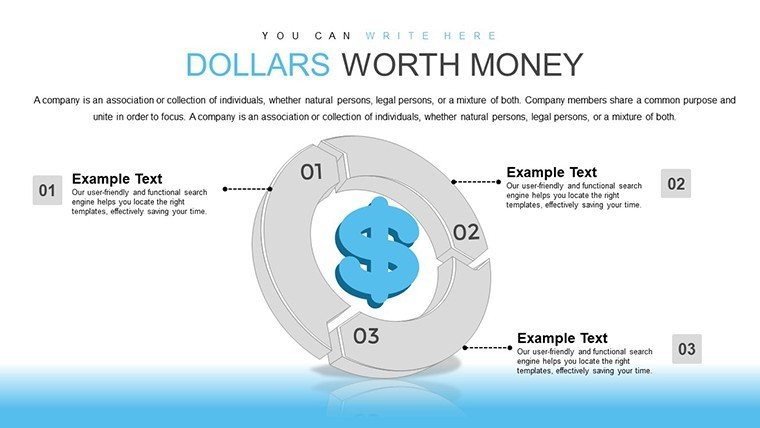
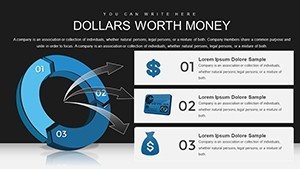
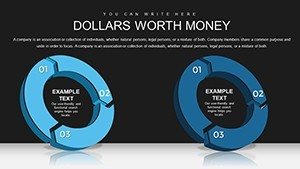
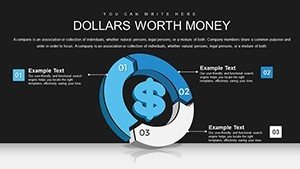
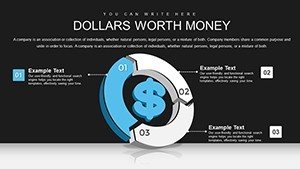
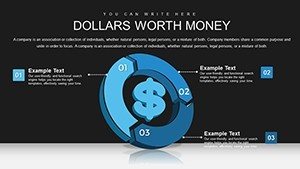
At the heart of this template are dynamic charts: pie, bar, and donut varieties tailored for currency visuals. Customize them effortlessly - adjust scales to reflect real-time rates or recolor segments to match corporate branding. For example, edit a donut chart to illustrate portfolio diversification across currencies, highlighting risks and opportunities in a glance. High-resolution graphics maintain sharpness on large screens, crucial for conference rooms or virtual meetings.
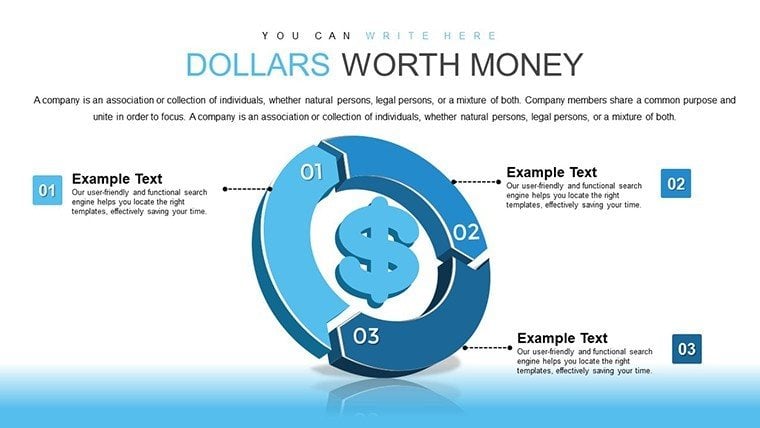
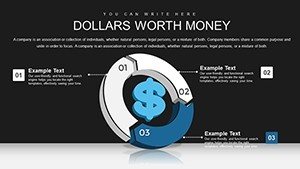
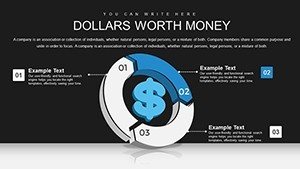
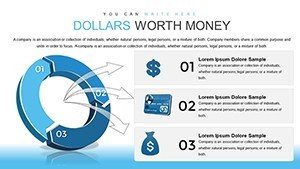
User-friendly design shines through pre-built placeholders, allowing even novices to input data without hassle. Global currency support extends beyond USD, accommodating multi-currency analyses for international businesses. In practice, this mirrors tools used by firms like JPMorgan in their economic outlooks, where visual accuracy builds trust. The .pptx format guarantees compatibility, while regular updates based on user feedback keep it cutting-edge.
Benefits Tailored for Financial Professionals
Time-saving is paramount: skip hours of chart-building and dive straight into analysis. Professional quality elevates your credibility, as seen in how polished visuals correlate with higher engagement in financial webinars, per studies from Harvard Business Review. Versatility spans investor pitches to training sessions, with cost-effectiveness at just $15 making it accessible for freelancers and small firms alike.
Integrate into your workflow: import data from Excel, tweak visuals, and export for sharing. This streamlined process aligns with agile financial reporting, reducing errors and enhancing decision speed. For instance, a banker might use it to forecast currency impacts on loans, drawing on IMF data for authoritative backing.
Practical Applications in Diverse Scenarios
For investor pitches, showcase global opportunities with infographics comparing currency strengths. Educators can simplify forex concepts, using slides to demonstrate conversion mechanics step-by-step. In banking, present trends to clients, perhaps integrating live rates for interactive demos.
- Freelance Proposals: Justify international pricing with rate comparisons, building client confidence.
- Marketing Campaigns: Highlight multi-currency ROI, aiding global strategy planning.
- Corporate Meetings: Analyze exchange impacts on budgets, fostering informed discussions.
Take a real-world example: a European bank utilized similar charts to navigate Brexit currency shifts, resulting in proactive hedging strategies that saved millions, as noted in financial journals. Adapt this template for such insights, customizing with your datasets for personalized relevance.
Pro Tips for Optimizing Your Charts
Begin with accurate data sources like Bloomberg or OANDA for credibility. Vary chart types to avoid monotony - pair bars with pies for comprehensive views. Follow design principles: use contrasting colors for accessibility, ensuring compliance with WCAG standards. Storytelling is key; structure slides as a progression from problem (currency volatility) to solution (informed strategies).
As an SEO specialist, I've seen how embedding LSI terms like 'exchange rate visualization' boosts discoverability, but focus on user value: these tips turn templates into tools for career advancement.
Transform Your Financial Narratives Now
Ready to make your currency data speak volumes? Download this Currency Converter PowerPoint Charts Template and elevate your presentations to expert levels, driving better outcomes in every financial endeavor.
Frequently Asked Questions
How do I customize the currency charts?
Simply click on chart elements to edit data, colors, and labels directly in PowerPoint - no advanced skills needed.
Does it support currencies beyond USD?
Yes, placeholders accommodate any currency, with easy swaps for global analyses.
Is it suitable for Google Slides?
Absolutely, upload the .pptx file to Google Slides for full compatibility and collaboration.
What if I need more slides?
The template is expandable; duplicate and modify existing ones to fit your needs.
Are updates free?
Yes, purchasers receive notifications for free updates enhancing features based on feedback.
Can I use it for educational purposes?
Definitely - it's perfect for teaching forex basics with clear, engaging visuals.