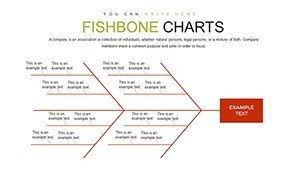
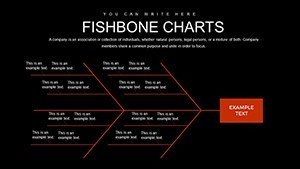
Fishbone Diagram PowerPoint Template: Unlock Solutions Effortlessly


Type: PowerPoint Charts template
Category: Relationship, Business Models
Sources Available: .pptx
Product ID: PC00799
Template incl.: 22 editable slides
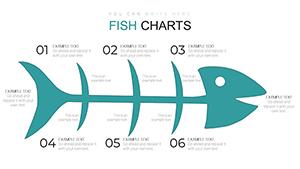
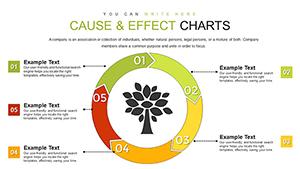
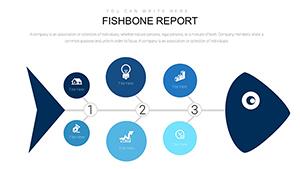
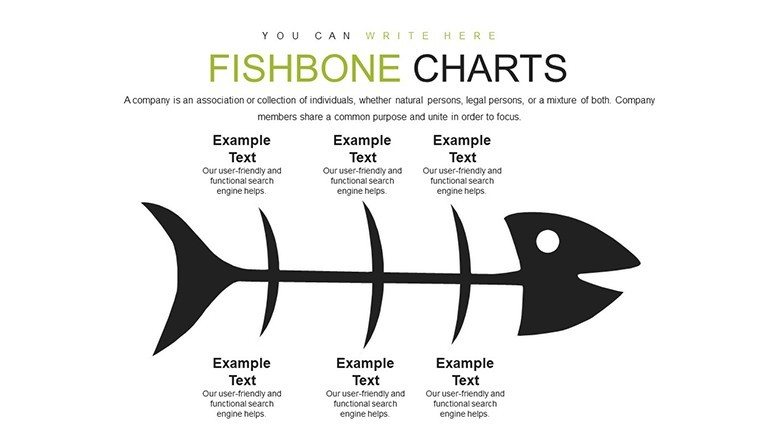
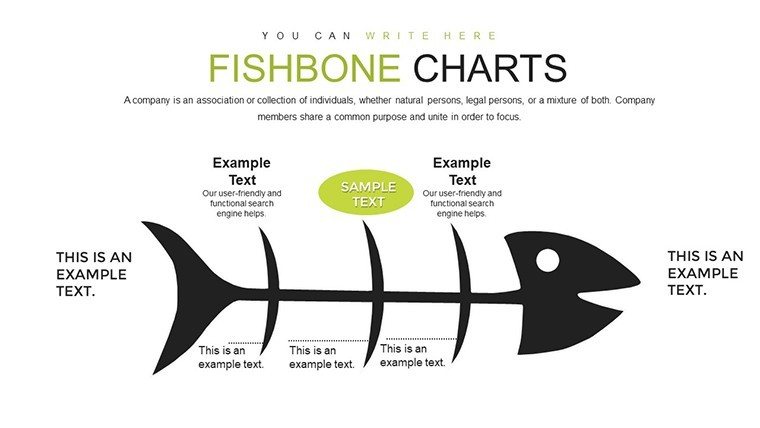
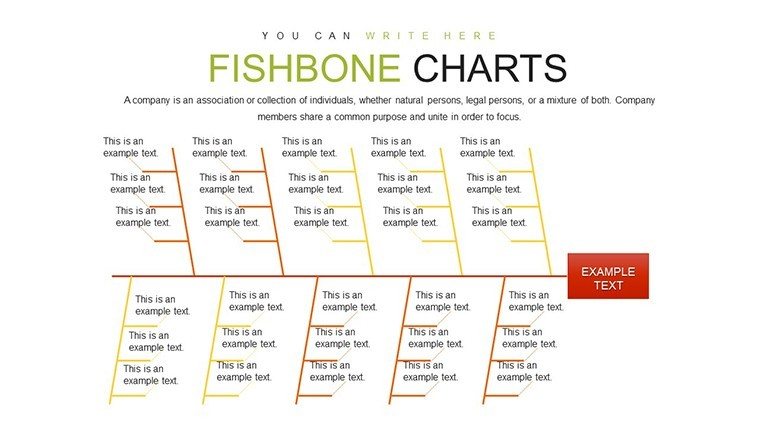
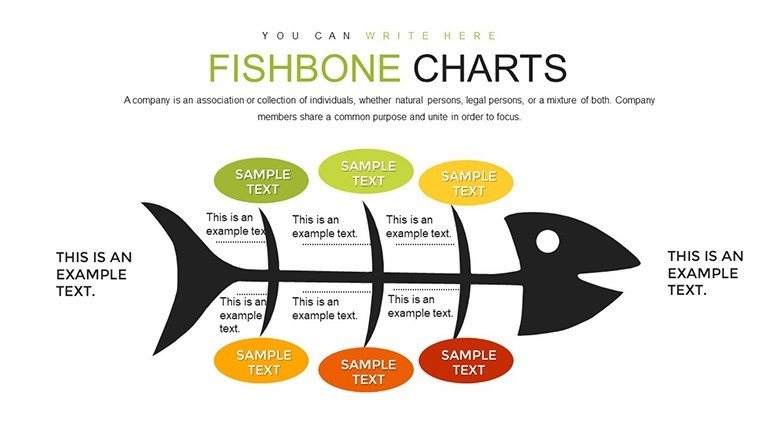
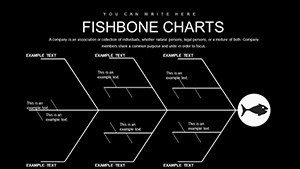
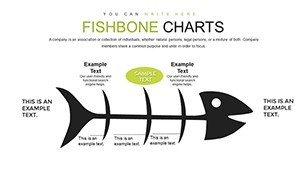
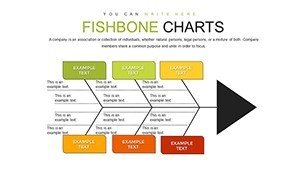
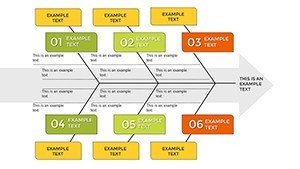
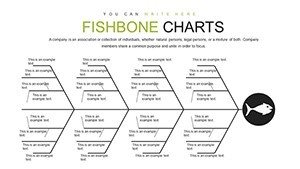
In the world of problem-solving, clarity is king. Imagine turning a tangled web of issues into a clear, structured path toward resolution. That's exactly what our Fishbone Diagram PowerPoint Template offers - a professional toolkit designed for those who need to dissect challenges and pinpoint root causes with precision. Tailored for business analysts, quality managers, educators, and consultants, this template features 22 fully editable slides that bring the classic Ishikawa diagram to life. Whether you're analyzing manufacturing delays or healthcare inefficiencies, these charts help you visualize cause-and-effect relationships in a way that's both intuitive and impactful. With built-in animations, you can guide your audience through each branch of the fishbone, revealing insights step by step. No more bland bullet points; instead, engage stakeholders with dynamic visuals that foster collaborative discussions and drive actionable outcomes.
Core Features That Set This Template Apart
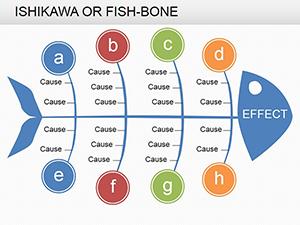
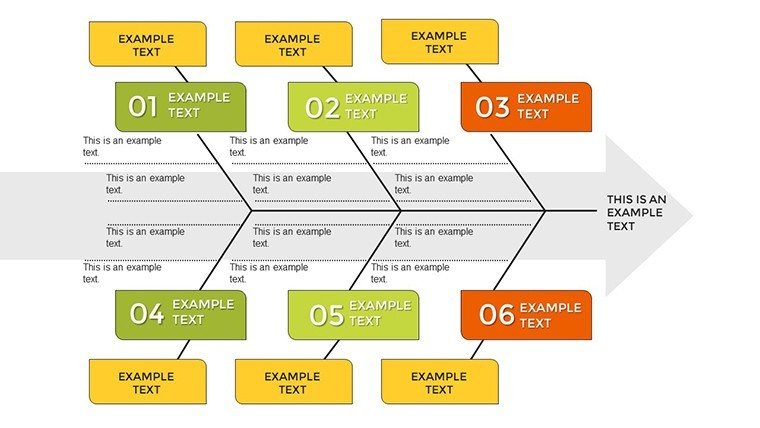
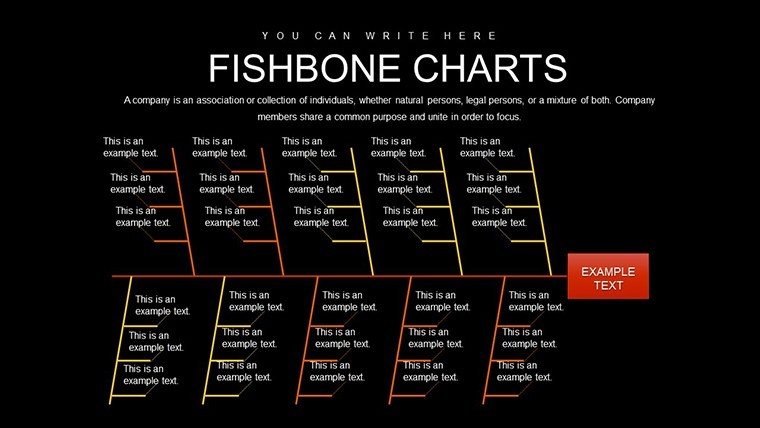
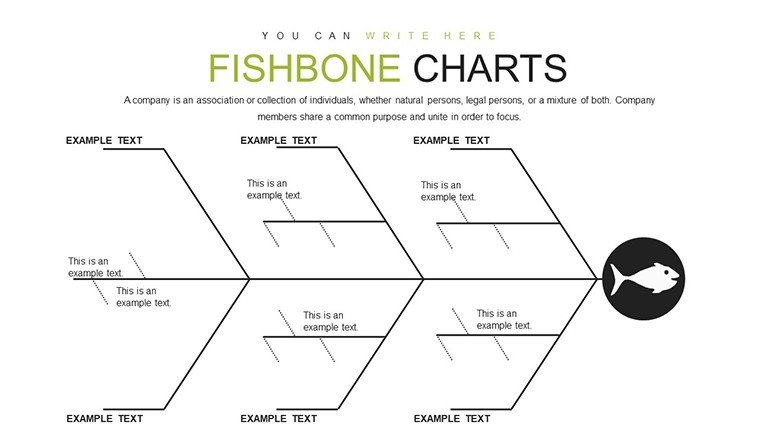
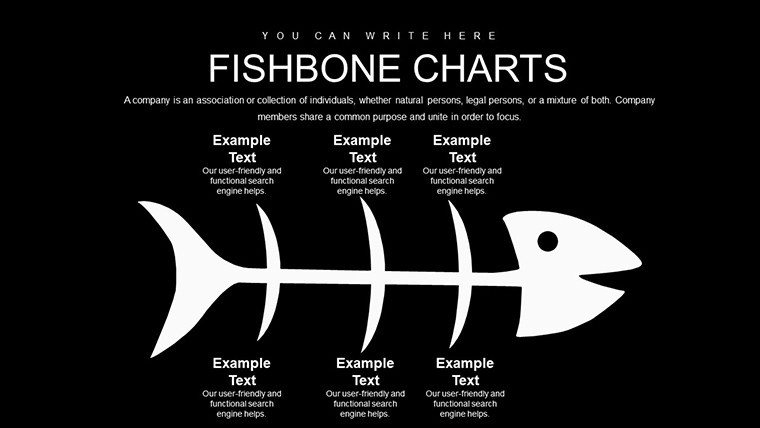
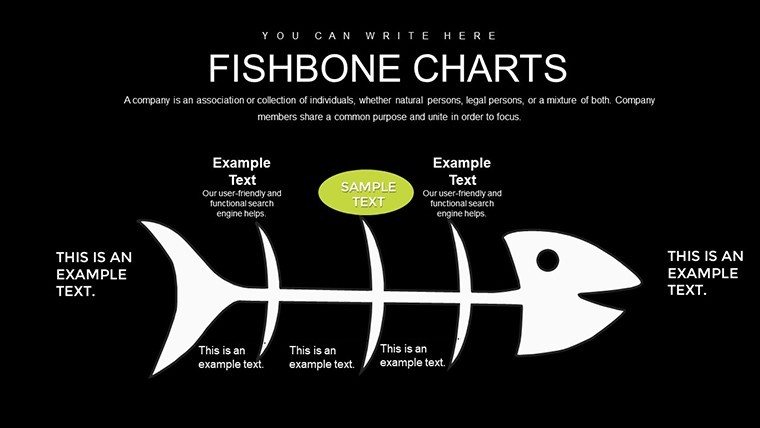
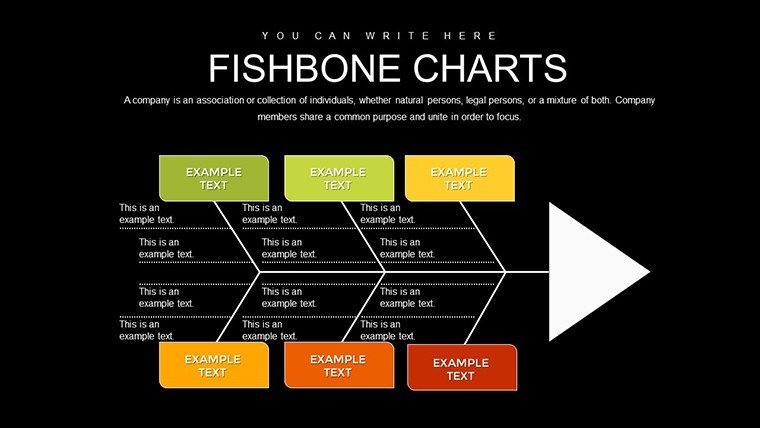
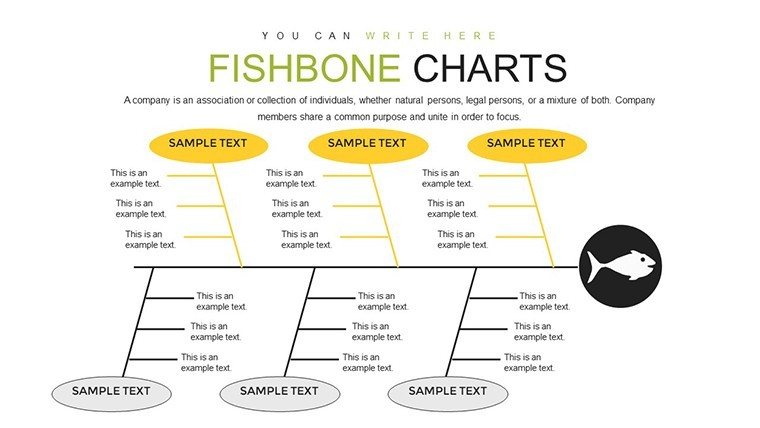
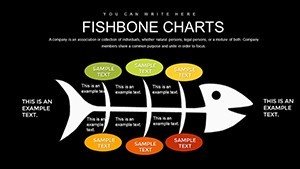
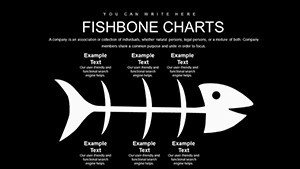
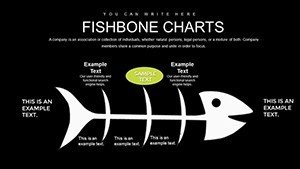
At the heart of this template lies its versatility. Each slide is crafted with professional design principles in mind, ensuring compatibility with PowerPoint and Google Slides for seamless integration into your workflow. Customize colors to match your brand palette, adjust fonts for readability, and resize elements without losing quality - these are just the basics. Dive deeper, and you'll find pre-built categories like Man, Machine, Method, Material, Measurement, and Environment, ready for your specific data. Animations aren't gimmicks here; they're tools to emphasize key causes, making your presentation flow like a story. Compared to basic PowerPoint shapes, this template saves hours by providing polished, themed icons and layouts that elevate your content from ordinary to outstanding.
Detailed Slide Breakdown for Maximum Utility
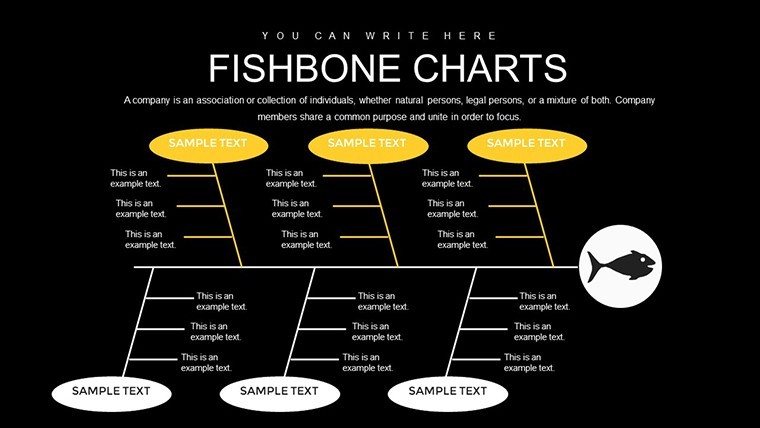
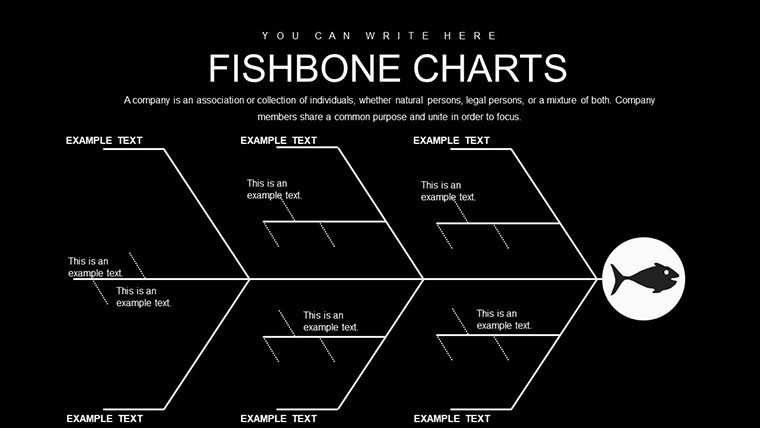
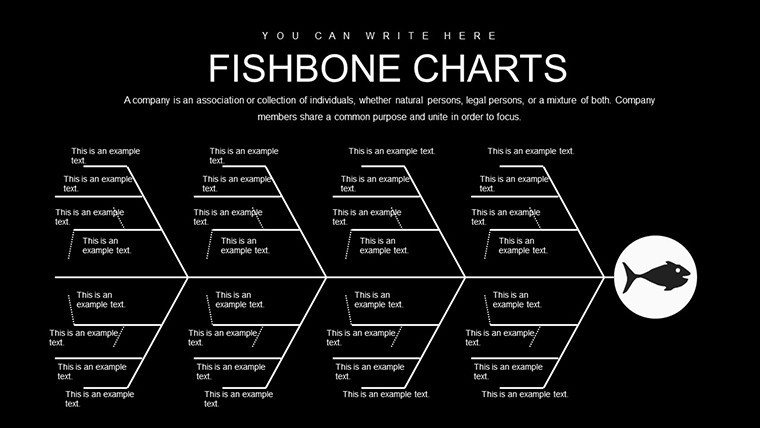
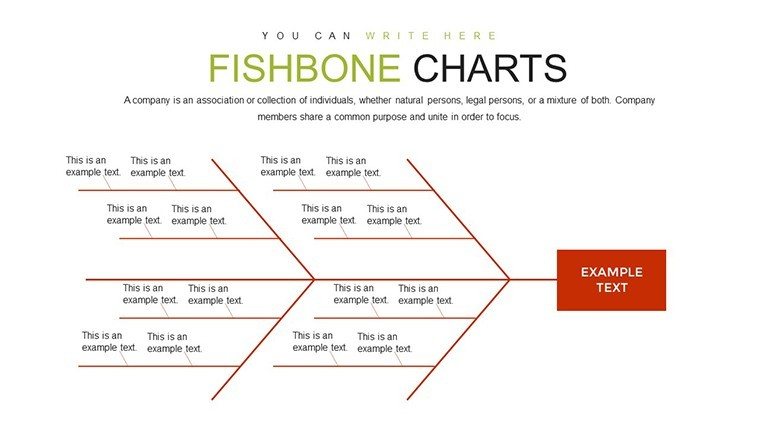
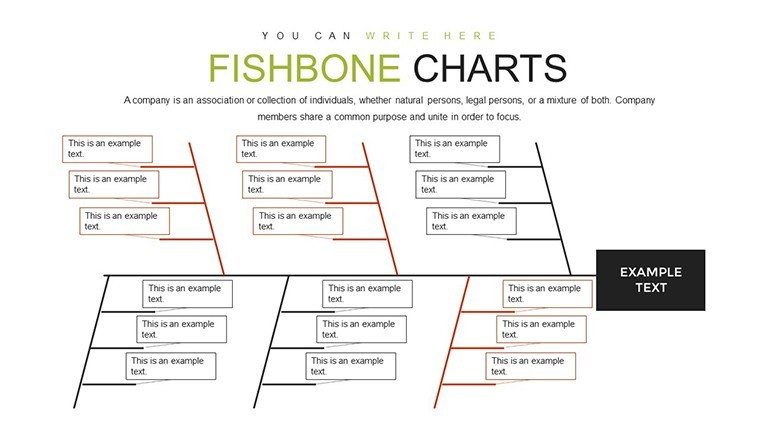
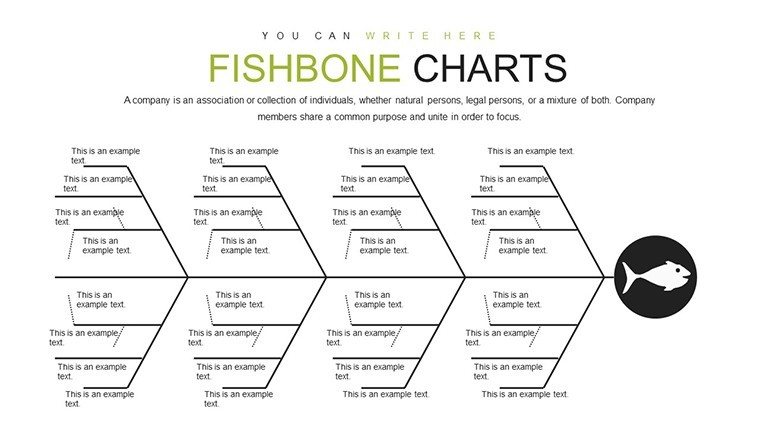
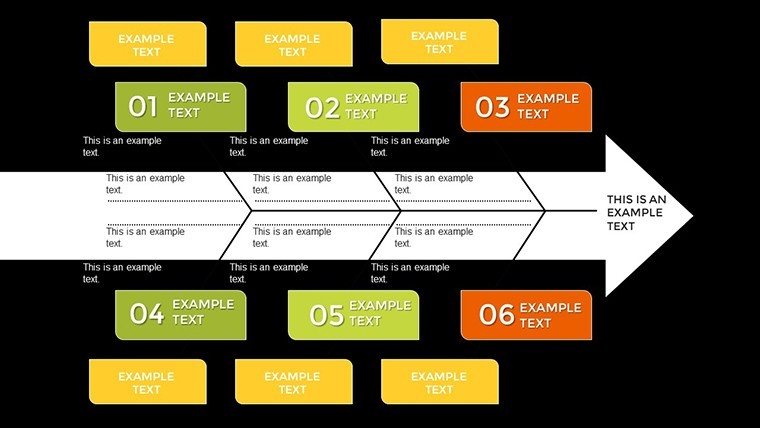
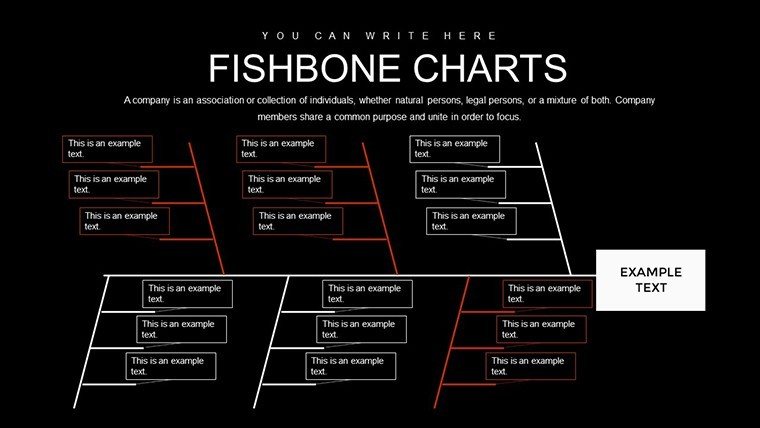
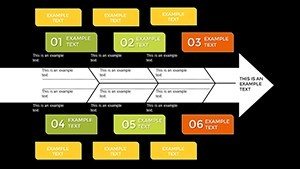
Let's explore what you'll get. The first few slides introduce the fishbone structure with blank templates for quick starts. Slide #3, for instance, offers a multi-layered diagram ideal for complex scenarios, where you can add sub-causes under main branches. Midway through, slides like #10 incorporate data charts alongside the fishbone, allowing you to quantify impacts - think bar graphs showing defect rates tied to material flaws. Toward the end, resolution-focused slides (#18-22) include action plan matrices, where you can map solutions to identified causes. Every element is vector-based, ensuring crisp prints or projections. This isn't just a template; it's a comprehensive system that adapts to your needs, whether you're presenting in a boardroom or a virtual meeting.
Real-World Applications: From Theory to Practice
Picture this: A manufacturing plant faces recurrent machine breakdowns, costing thousands in downtime. Using our fishbone template, a quality team maps out causes - under 'Machine,' they note outdated parts; under 'Method,' inefficient maintenance schedules emerge. This mirrors a real case from EasyRCA, where a similar analysis reduced breakdowns by 40% in an automotive factory. In healthcare, consider patient care delays: A hospital uses the diagram to identify staffing shortages ('Man') and procedural bottlenecks ('Method'), leading to streamlined processes as seen in ASQ's examples. For architects and urban planners, apply it to project delays - 'Material' might highlight supply chain issues, while 'Environment' covers regulatory hurdles. A case study from a construction firm, inspired by Srushti Systems' FMECA integration, showed how fishbone analysis prevented overruns on a high-rise build, saving 15% on costs. Educators can use it to teach critical thinking, breaking down historical events or scientific problems for students. Consultants thrive here too, customizing diagrams for client pitches to demonstrate expertise in root cause analysis, aligning with AIA standards for project management in design firms.
Integrating this template into your workflow is straightforward. Start by importing your data - perhaps from Excel spreadsheets detailing incident reports. Populate the branches with brainstorming results from team sessions. Then, animate the reveal: Have causes fade in sequentially to build suspense and focus discussion. Post-presentation, export slides as PDFs for reports or share via cloud links for collaboration. This approach not only solves immediate problems but builds a culture of continuous improvement, as evidenced by AssignmentHelper's statistics assignment where fishbone led to data-driven decisions in retail inventory issues.
Pro Tips for Mastering Fishbone Presentations
- Brainstorm Effectively: Gather diverse team inputs to fill branches comprehensively, avoiding bias as per Venngage's brainstorming examples.
- Quantify Causes: Attach metrics to each sub-cause for credibility - use embedded charts to show correlations.
- Iterate and Refine: After initial analysis, revisit the diagram with new data to evolve solutions.
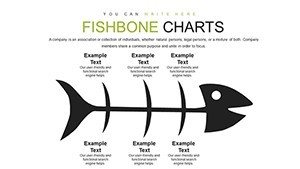
- Engage Visually: Leverage the template's icons, like gear symbols for 'Machine,' to make abstract concepts tangible.
- Adapt for Industries: In tech, map software bugs; in marketing, dissect campaign failures - versatility is key.
Beyond these, consider hybrid uses: Combine with SWOT analysis for strategic planning or integrate into Lean Six Sigma reports. A real-world twist comes from a tech startup that used fishbone to troubleshoot app crashes, identifying user interface flaws and boosting retention by 25%, akin to cases in quality resources.
Why This Template Outshines Standard Options
Basic PowerPoint tools force you to build from scratch, wasting time on alignments and designs. Our template bypasses that with pre-optimized layouts, ensuring professional polish without design expertise. It's not just about aesthetics; it's about efficiency - spend less time formatting and more on insights. For trustworthiness, we've drawn from established methodologies like those from ASQ, guaranteeing alignment with industry best practices. Subtle CTAs throughout your deck, like "Explore Causes Now," keep audiences engaged. Ultimately, this tool empowers you to turn data chaos into strategic clarity, fostering innovation and problem resolution in any field.
As you wrap up your next presentation, watch as nods turn to action items. This fishbone template isn't merely slides; it's a catalyst for change. Ready to dive in? Customize your way to solutions today and see the difference in your analytical prowess.
Frequently Asked Questions
- How editable are the fishbone charts?
- Fully editable - adjust every element, from branches to colors, to fit your data perfectly.
- Is this compatible with Google Slides?
- Yes, import seamlessly and edit online for collaborative work.
- Can I add animations to custom elements?
- Absolutely; the template supports PowerPoint's animation pane for personalized effects.
- What if I need more slides?
- Duplicate and modify existing ones easily to expand your deck.
- Are there examples included?
- Yes, sample data in early slides to guide your customization.