Innovation Process Steps PowerPoint Charts: From Idea to Implementation


Type: PowerPoint Charts template
Category: Relationship, Business Models
Sources Available: .pptx
Slide size: widescreen (16:9)
Product ID: PC00798
Template incl.: 24 editable slides
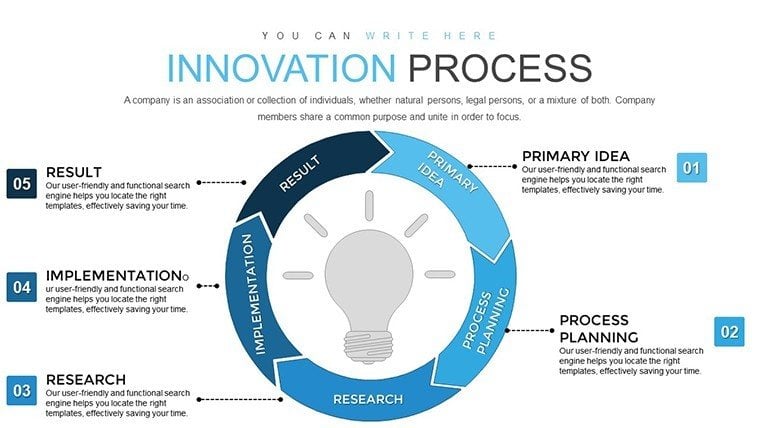
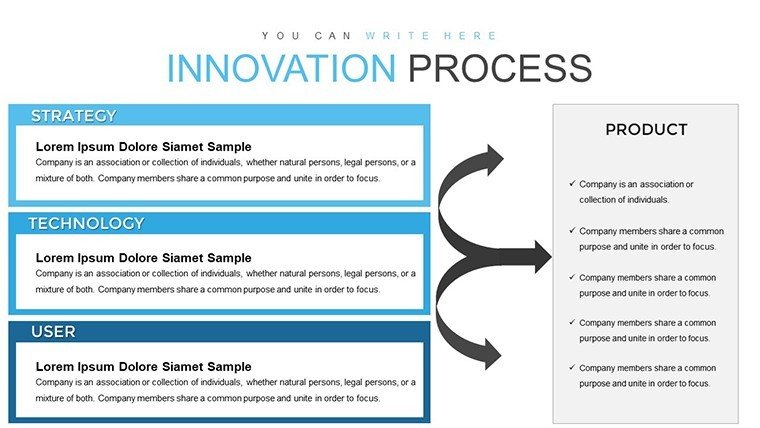
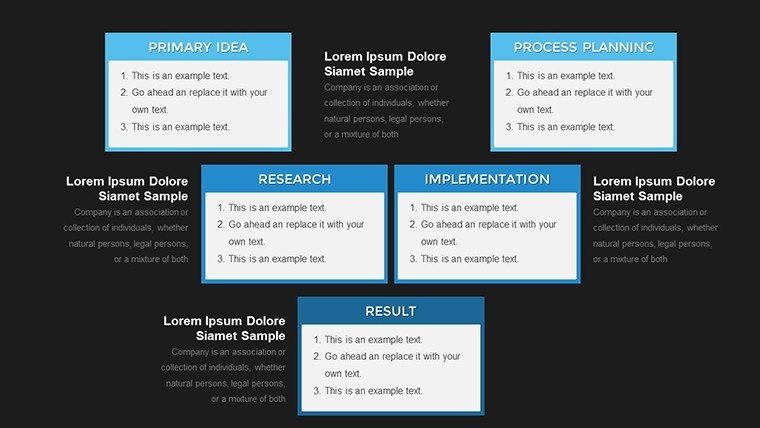
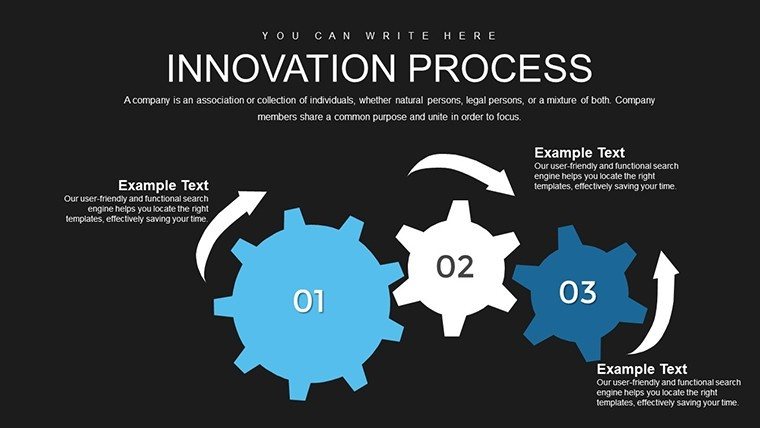
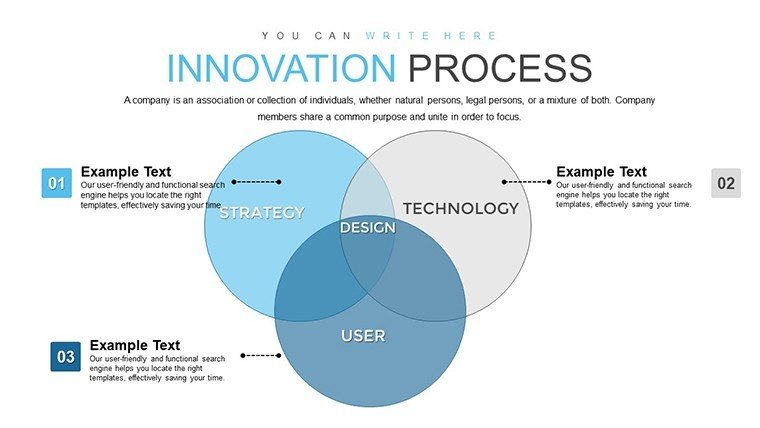
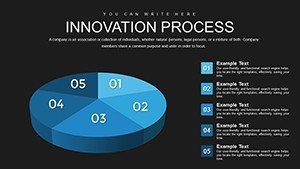
Embarking on innovation isn't just about sparks of creativity; it's a structured voyage that turns concepts into market realities. Our Innovation Process Steps PowerPoint Charts Template equips you with 24 widescreen editable slides to map this journey vividly. Perfect for product managers, entrepreneurs, and corporate strategists, this tool demystifies stages like research, development, and launch. Visualize how ideas evolve, incorporating feedback loops and continuous improvements that extend beyond initial sales. With customizable elements, you can highlight enterprise-wide enhancements in science, marketing, and production. Unlike generic timelines, these charts integrate flow diagrams and icons to make abstract processes tangible, helping teams align on goals and accelerate time-to-market.
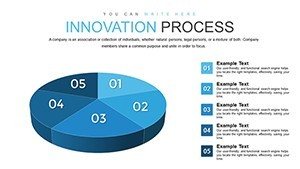
Essential Features for Dynamic Innovation Mapping
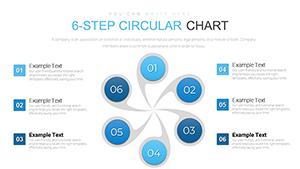
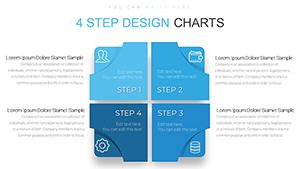
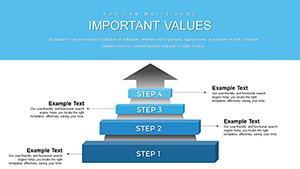
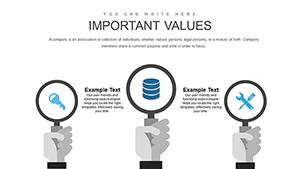
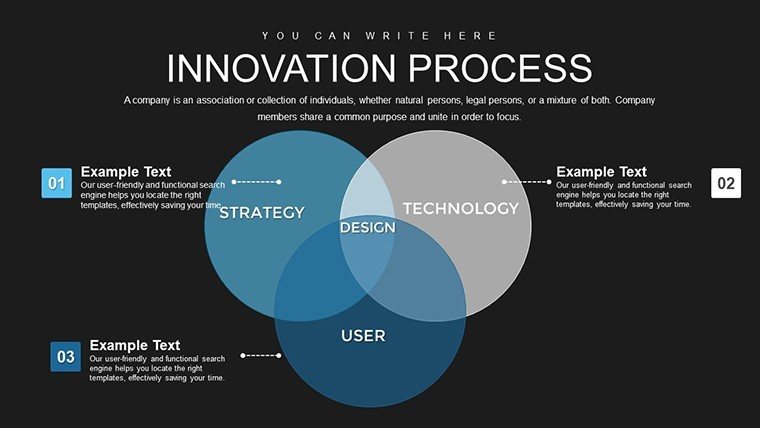
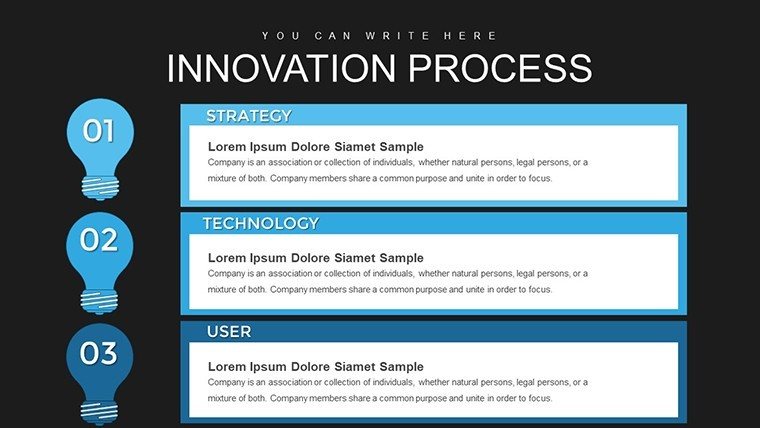
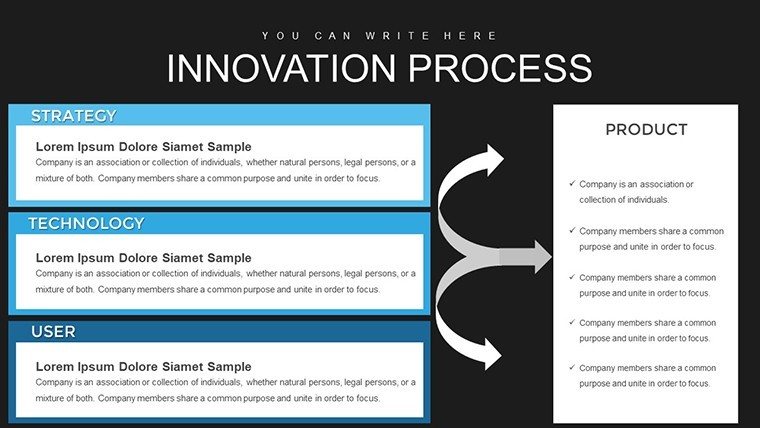
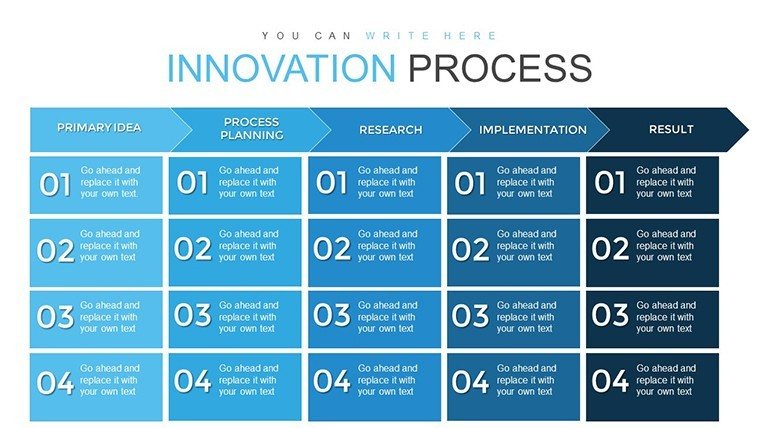
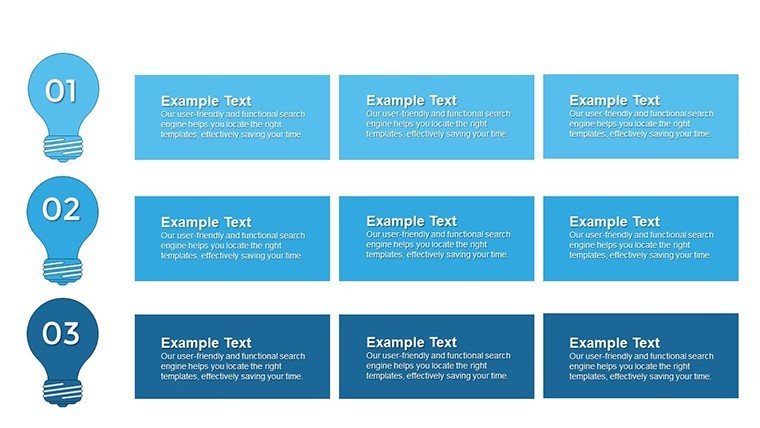
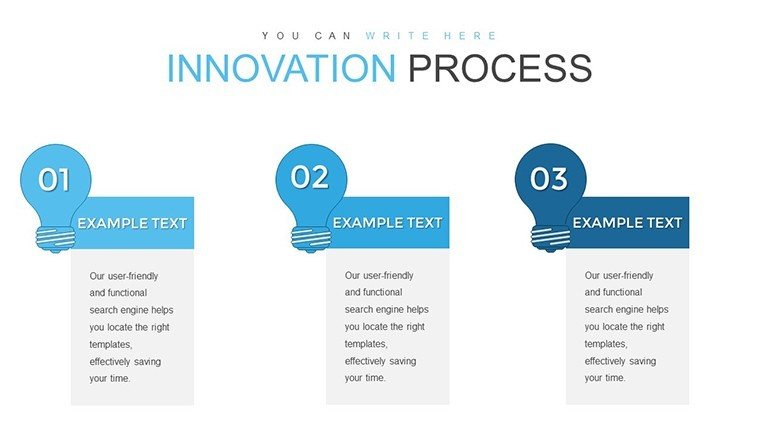
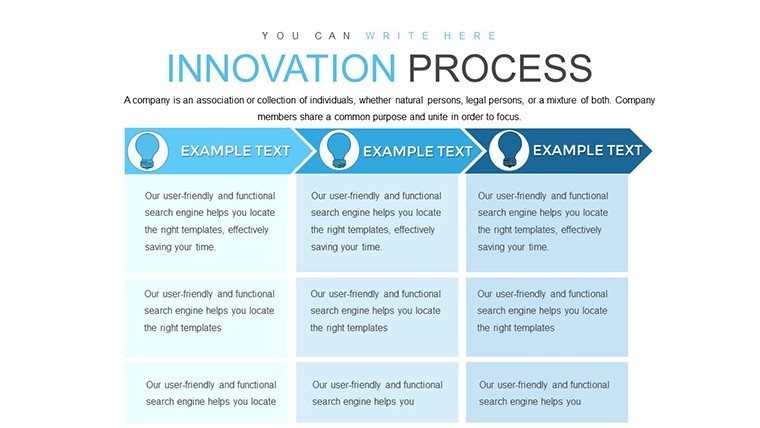
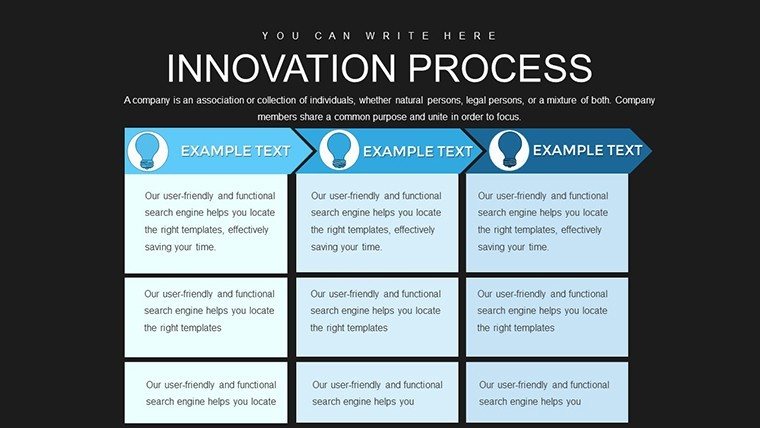
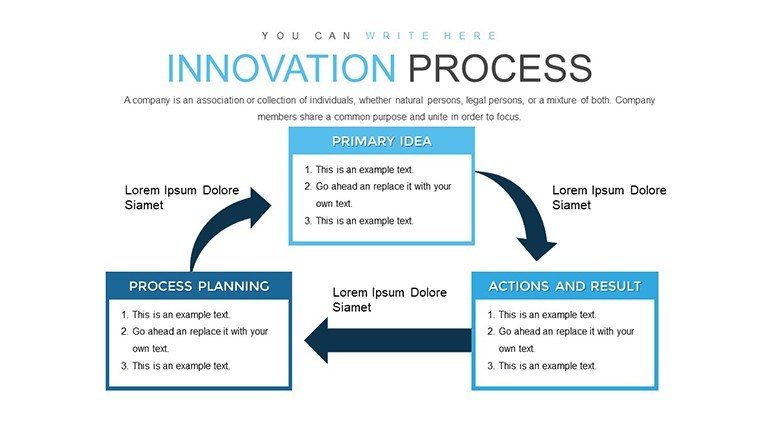
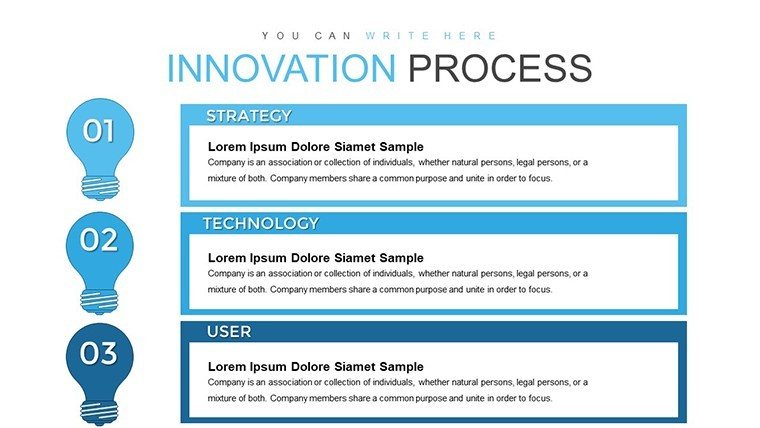
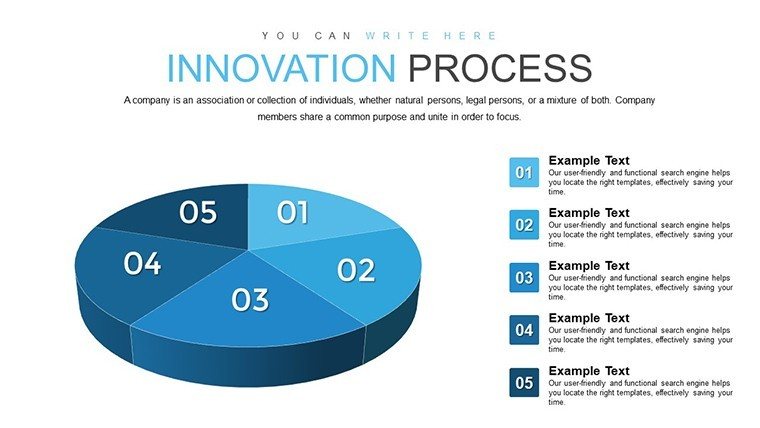
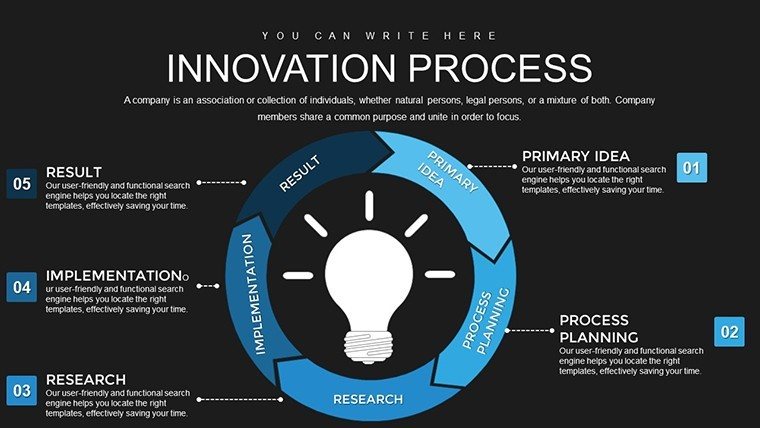
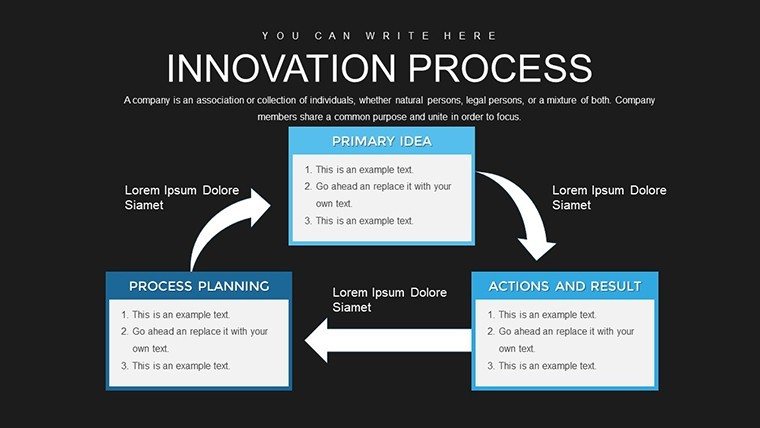
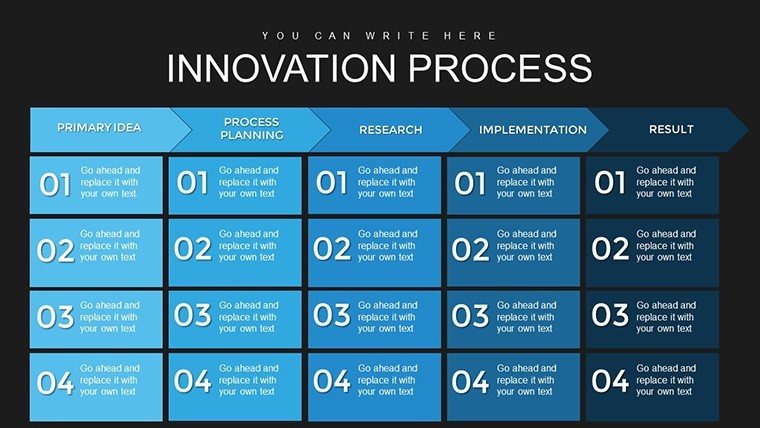
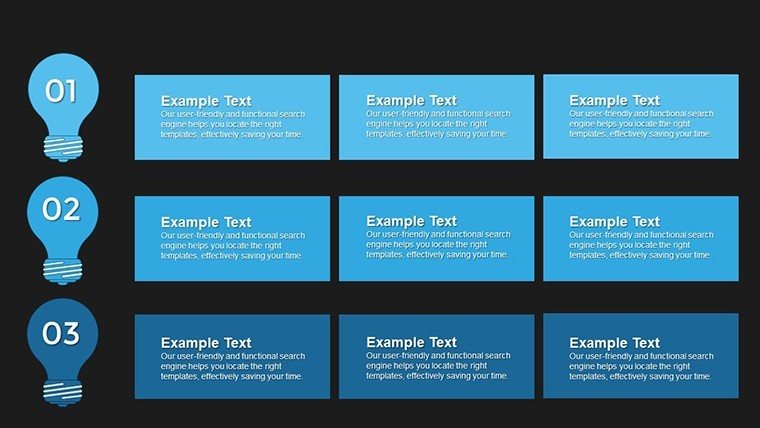
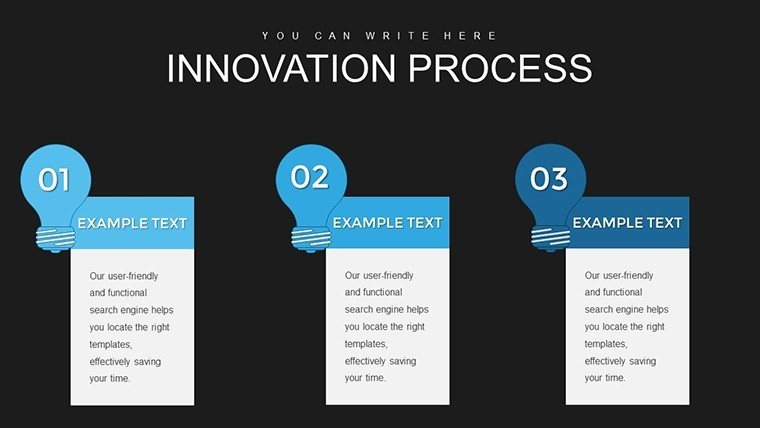
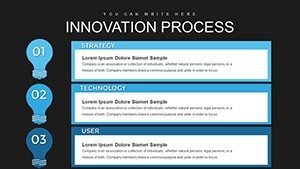
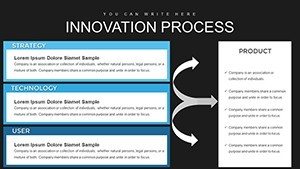
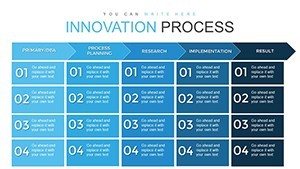
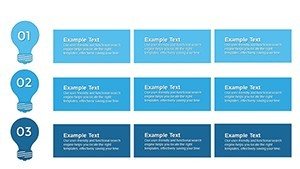
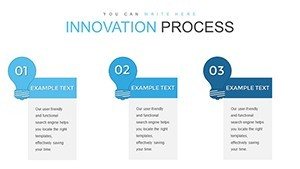
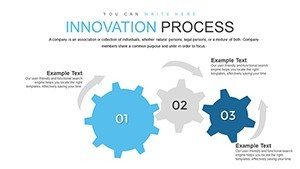
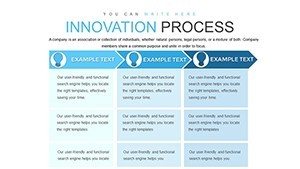
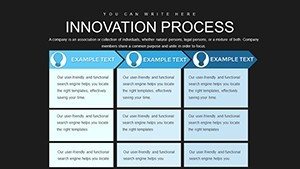
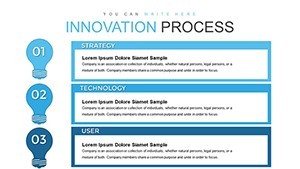
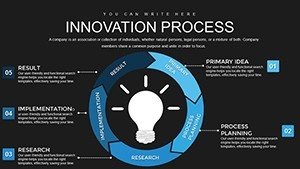
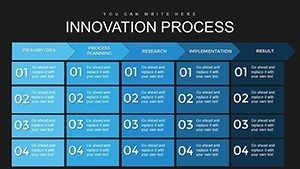
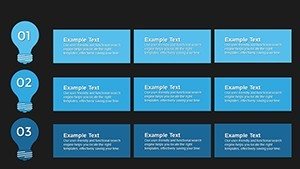
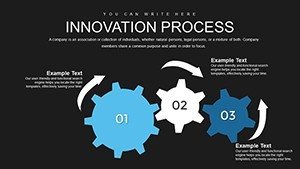
This template shines with its adaptability. Each slide supports full customization - alter layouts, colors, and texts to reflect your company's branding. Built for 16:9 widescreen, it's ideal for modern displays. Key slides include phased arrows showing progression from ideation to commercialization, with placeholders for metrics like ROI or adoption rates. Animations guide viewers through steps, emphasizing transitions like prototype testing. In contrast to basic PowerPoint flows, our designs incorporate themed graphics, such as lightbulbs for ideas and gears for implementation, ensuring visual coherence and professional appeal.
In-Depth Slide Overview and Customization
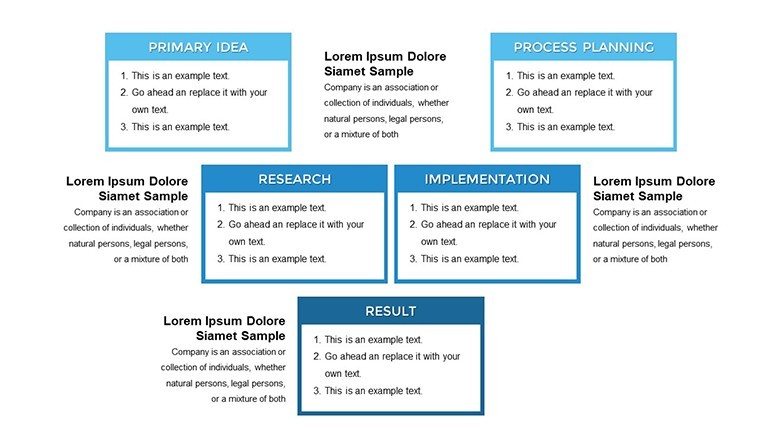
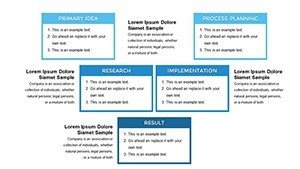
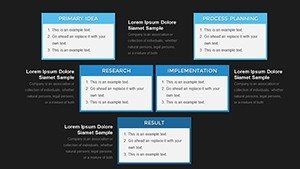
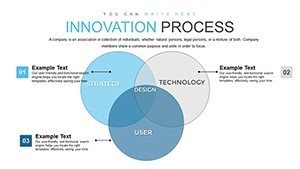
Begin with introductory slides (#1-4) outlining the innovation lifecycle, complete with definitions and overviews. Mid-section slides (#10-15) delve into core stages: research (data gathering), development (prototyping), and market entry (launch strategies). Later slides (#20-24) focus on post-launch iterations, including consumer feedback integration. Every chart is data-ready - link to Excel for live updates. For architects of business models, adapt these to urban planning innovations, like sustainable building processes per AIA guidelines.
Practical Use Cases: Bringing Innovation to Life
Consider Apple's iPhone evolution, as per Diginsights: Their process involved ideation, prototyping, and iterative launches, mirroring our template's steps to achieve market dominance. Starbucks, another example, revamped supply chains using process innovation, cutting costs as noted in Innosabi's cases - use our charts to diagram similar efficiencies in your coffee chain expansions. For CPG brands, The Design Gym's framework aligns with our phased approach, where mindsets like 'Where to Play' fit into early slides for strategic planning. In tech, Google's experimentation (InnovationCast) tests ideas rapidly; replicate this in your presentations to showcase agile adaptations. Open innovation, per L Marks, collaborates with externals - our template's feedback loops visualize partnerships, like British Airways' startup integrations. For design firms, apply to architectural innovations: Map eco-material research to building launches, reducing environmental impacts as in Ford's assembly line revolutions adapted to modern contexts.
Workflow integration is seamless: Start with brainstorming sessions to populate steps, then use animations to reveal phases in meetings. Export as images for reports or embed in tools like Slack for team reviews. This fosters a culture of innovation, as seen in Amazon's process tweaks that enhanced logistics efficiency.
Expert Tips for Leveraging the Template
- Define Stages Clearly: Use icons to differentiate research from launch, enhancing comprehension.
- Incorporate Metrics: Add KPIs to each step for measurable progress tracking.
- Facilitate Collaboration: Share editable versions for real-time inputs from cross-functional teams.
- Adapt for Scale: Scale down for startups or expand for enterprises with duplicated slides.
- Storytell Effectively: Narrate success stories within charts to inspire action.
Hybrid applications include merging with SWOT for risk assessment or aligning with Lean methodologies for waste reduction, drawing from real cases like Henry's CPG innovation process design.
Superiority Over Built-In PowerPoint Tools
Standard shapes lack the depth our template provides - pre-built interconnections save design time, focusing on content. Backed by authoritative sources like Innosabi, it ensures best-practice alignment. CTAs like "Launch Your Innovation" motivate viewers subtly. This tool transforms vague ideas into executable plans, boosting competitiveness.
Step into innovation mastery. Tailor this template to your vision and watch ideas flourish into successes.
Frequently Asked Questions
- What stages does the template cover?
- From ideation and research to launch and post-market improvements.
- Is it suitable for non-business uses?
- Yes, adaptable for education, non-profits, or personal projects.
- How do I customize the charts?
- Edit texts, colors, and add data directly in PowerPoint.
- Does it support animations?
- Yes, built-in for sequential step reveals.
- Can I use it in Google Slides?
- Absolutely, with full compatibility.
- Are there sample data included?
- Yes, placeholders with examples to get started.