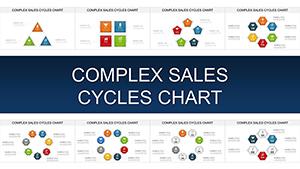
Corporate Environmental Responsibility PowerPoint Charts Template


Type: PowerPoint Charts template
Category: Business Models
Sources Available: .pptx
Product ID: PC00780
Template incl.: 30 editable slides
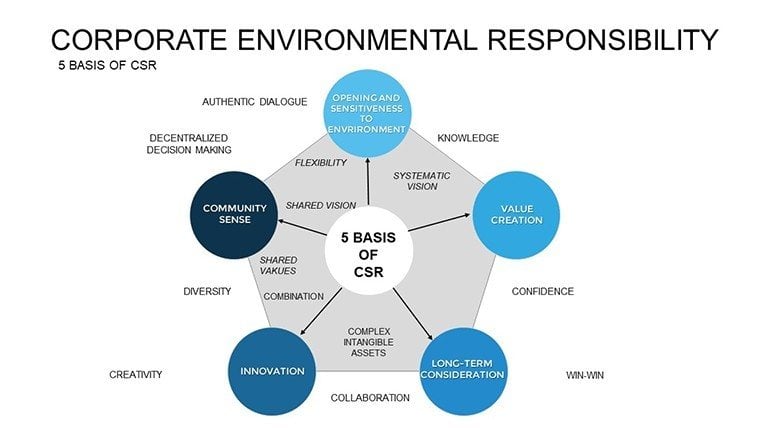
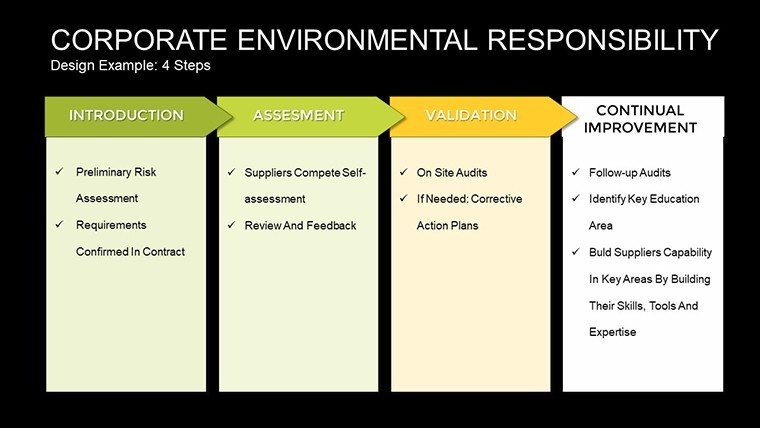
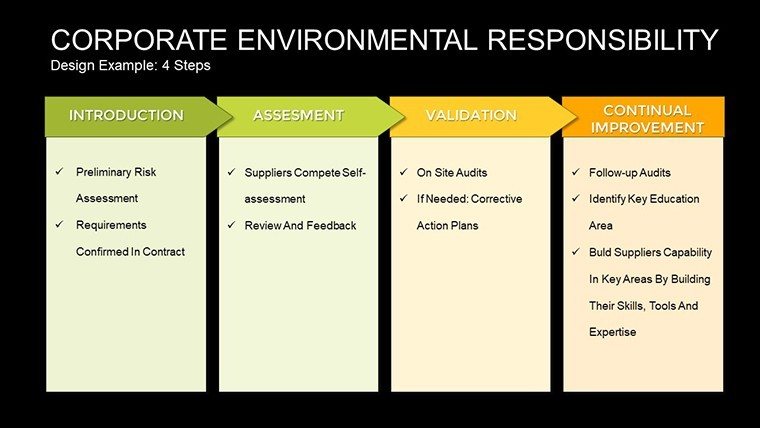
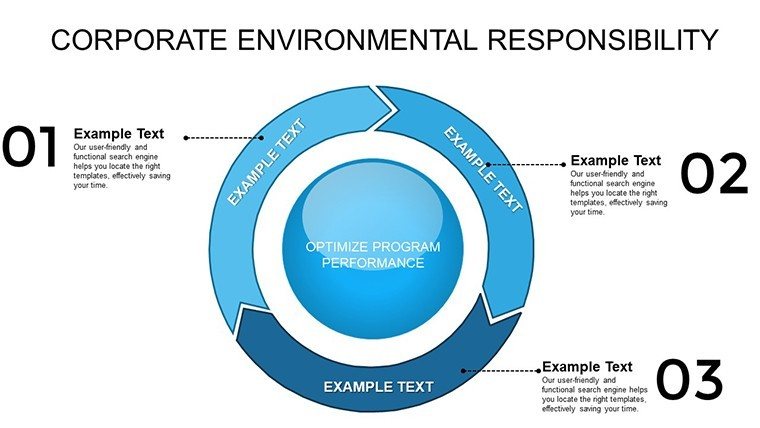
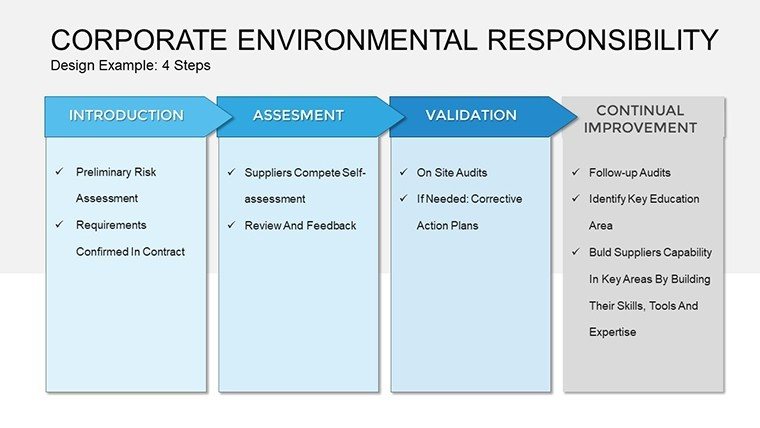
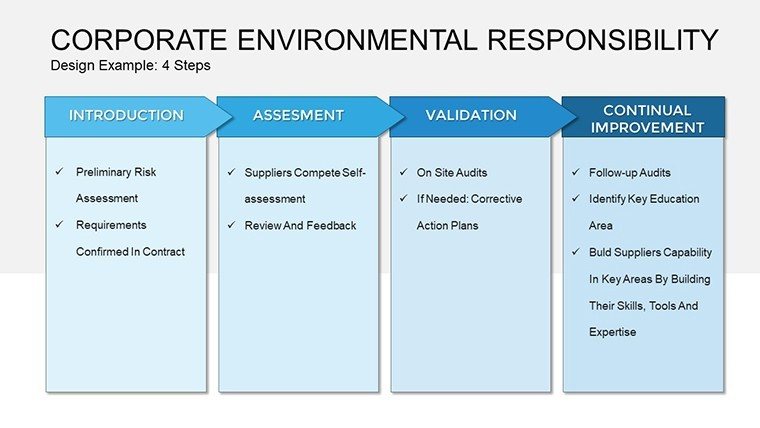
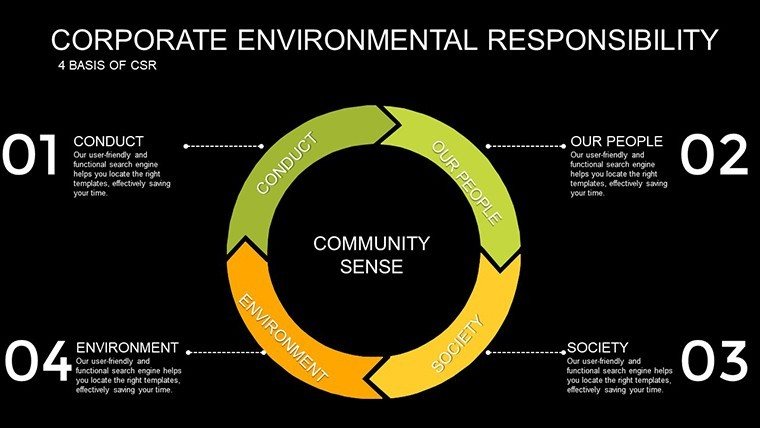
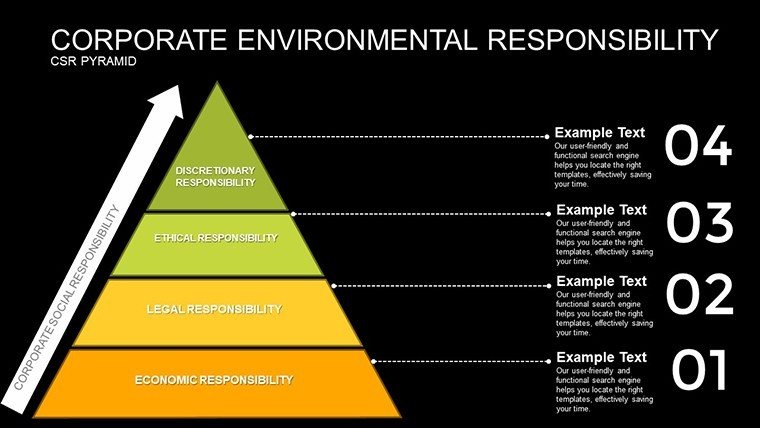
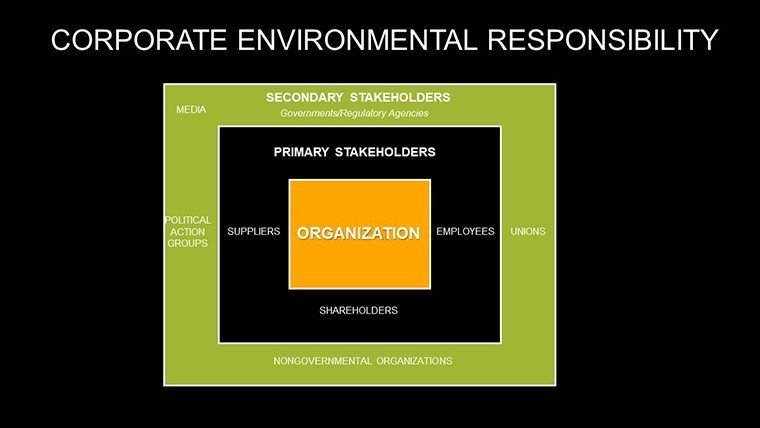
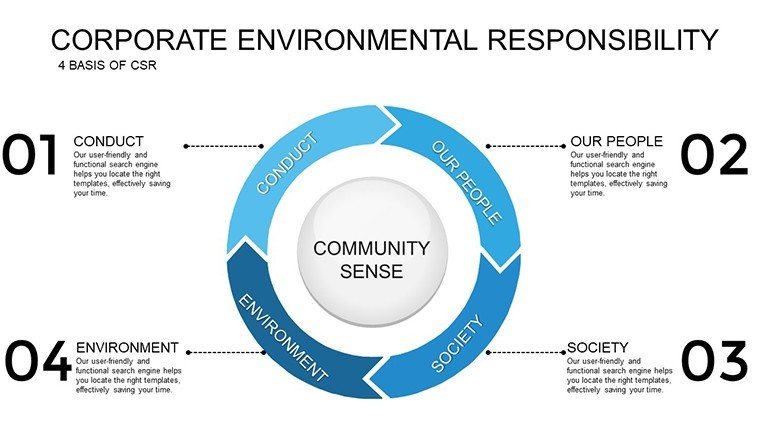
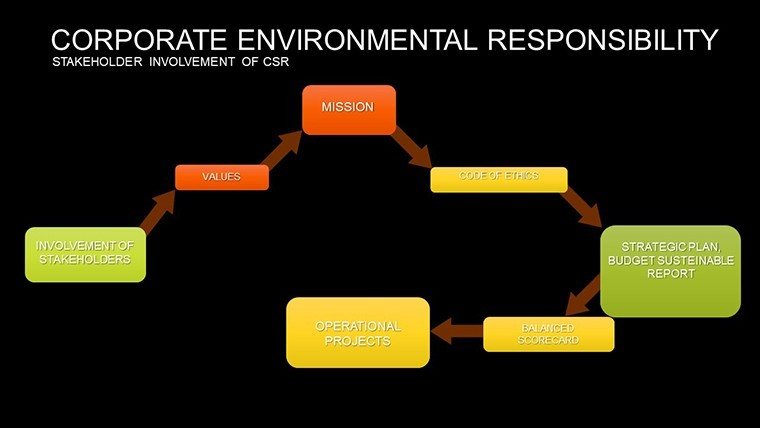
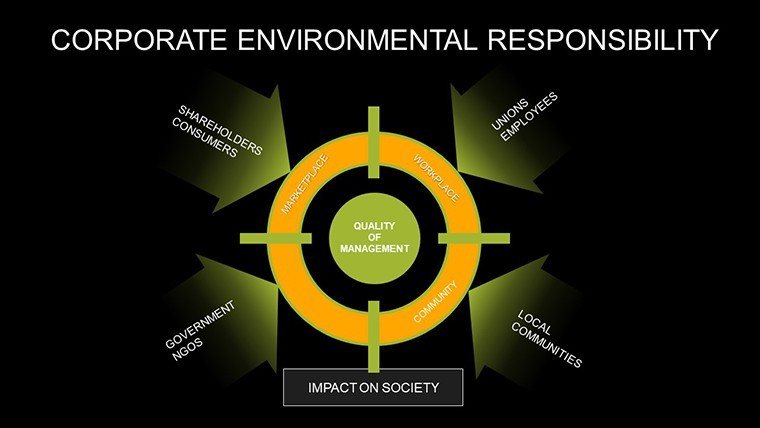
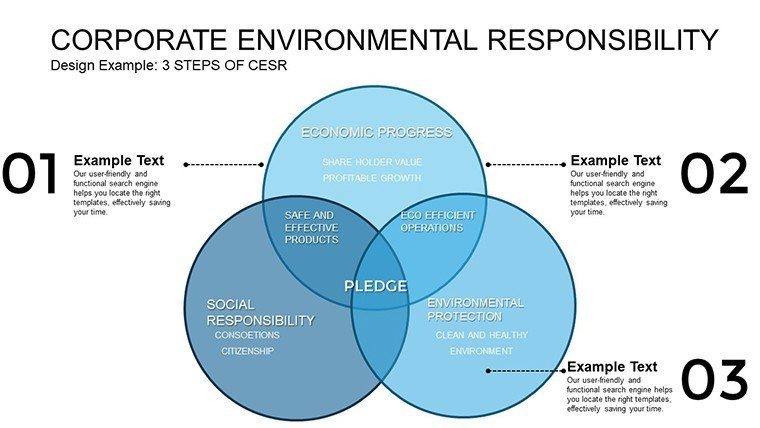
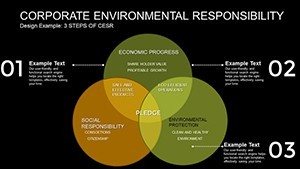
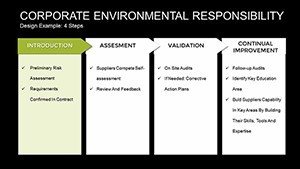
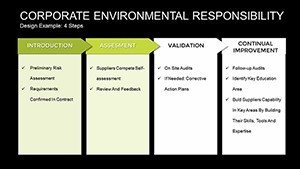
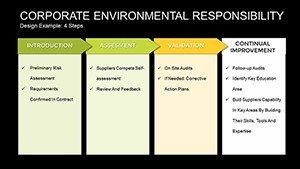
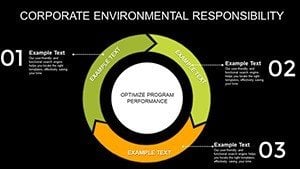
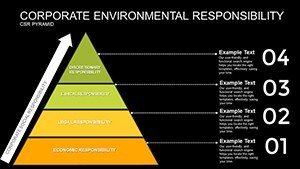
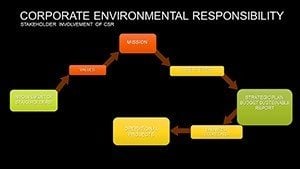
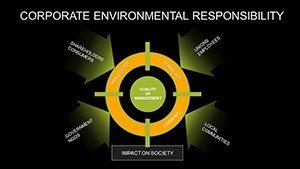
As corporations increasingly prioritize sustainability, communicating environmental responsibility becomes crucial. Our Corporate Environmental Responsibility PowerPoint Charts Template offers 30 editable slides to help you articulate your green commitments with precision and visual appeal. From carbon footprint trackers to sustainability roadmaps, this template is tailored for those championing eco-friendly practices, ensuring your message not only informs but motivates action toward a greener future.
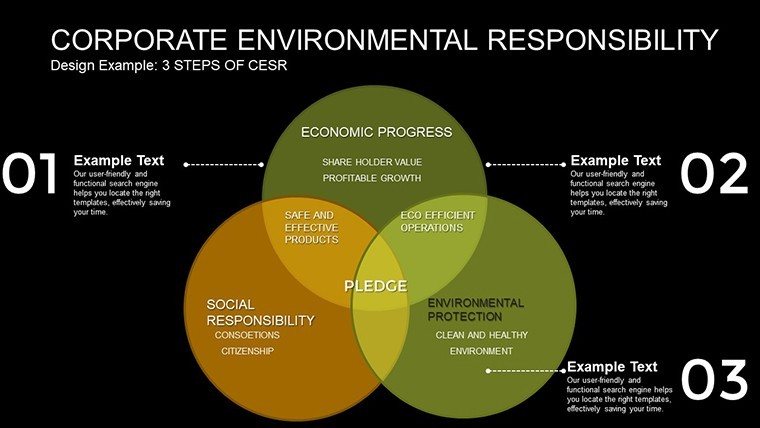
Recall the impact of a well-crafted ESG report - it's not just data; it's a story of stewardship. This template facilitates that with charts designed for environmental metrics, customizable to your organization's data. Edit graphs to show emission reductions or pie charts for resource allocation, all while maintaining a professional, earth-toned aesthetic that underscores your commitment.
Championing Sustainability Through Visual Excellence
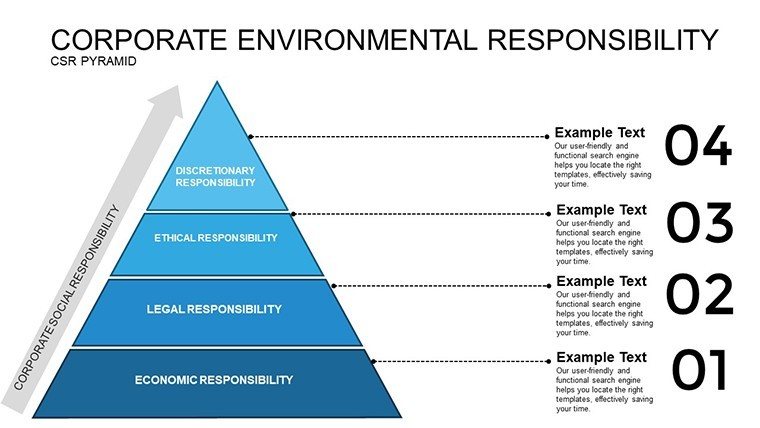
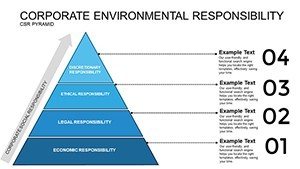
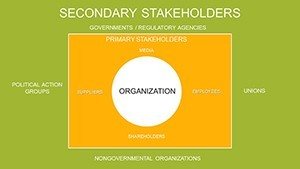
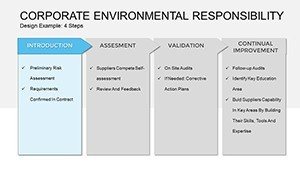
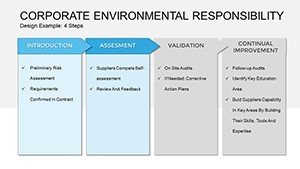
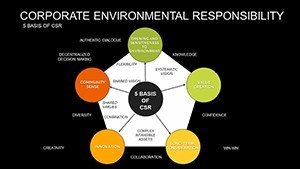
The template's strength is in its specialized charts for environmental data. Use bar graphs to compare yearly waste reductions, aligned with standards from the Global Reporting Initiative (GRI). For non-profits, customize infographics to highlight conservation efforts, similar to WWF's visual campaigns.
Business leaders can integrate it into annual reports, with line charts tracking biodiversity initiatives. Academic institutions teach sustainability courses using editable maps showing global impact, drawing from UN Sustainable Development Goals.
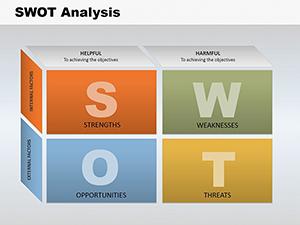
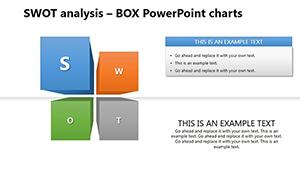
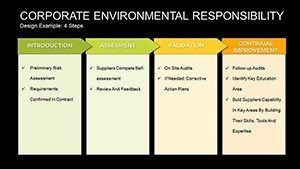
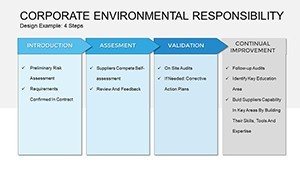
Environmental consultants deliver client strategies via SWOT charts adapted for green audits, echoing approaches in Deloitte's sustainability advisories.
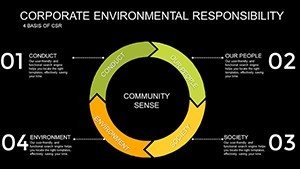
Core Features for Eco-Focused Presentations
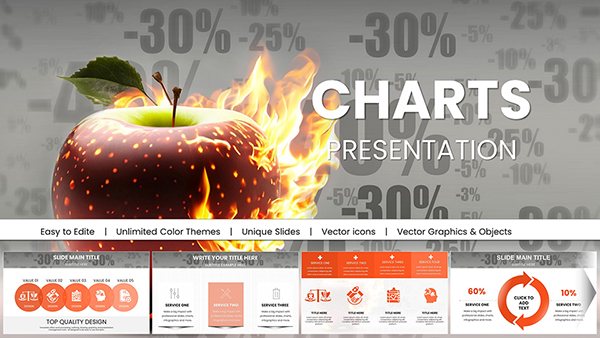
- Stunning Visuals: Professionally designed charts for complex environmental data.
- Full Tailoring: Customize to brand and data specifics effortlessly.
- Data Integration: Seamlessly add from various sources like CSV files.
- Compatibility: Works with PowerPoint and Google Slides.
- Comprehensive Coverage: 30 slides for all aspects of corporate responsibility.
Differing from standard templates, it emphasizes eco-themes, enhancing trustworthiness. Weave LSI such as "sustainability reporting charts" naturally.
Targeted Use Cases in Green Advocacy
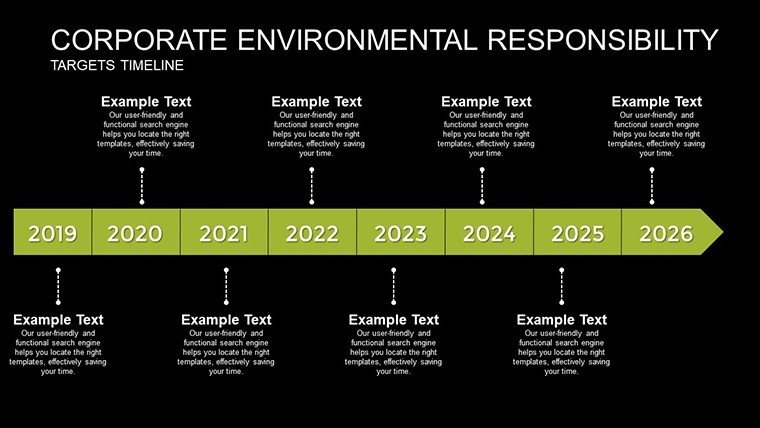
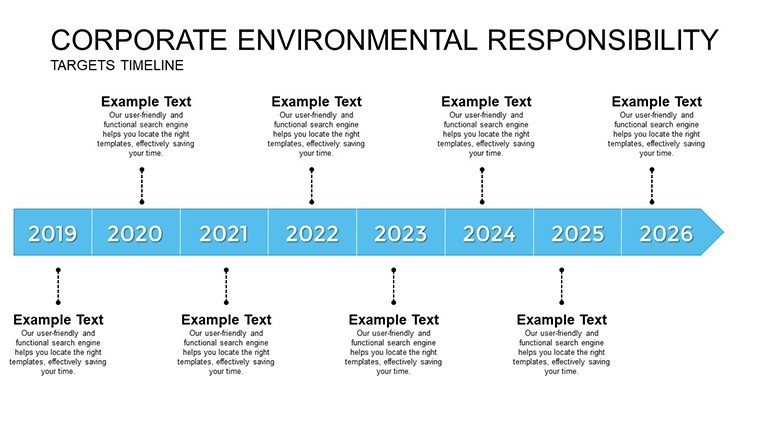
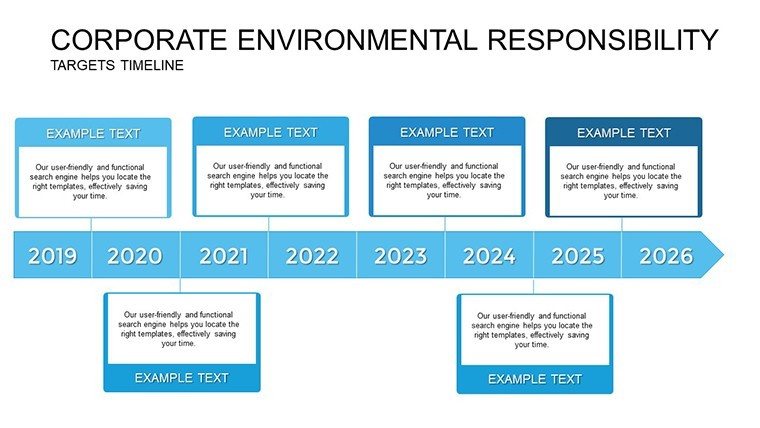
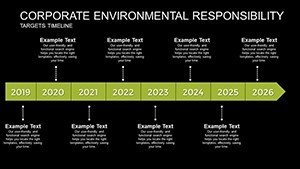
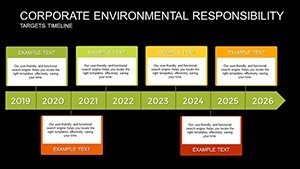
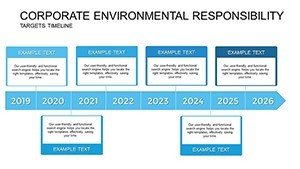
Sustainability managers present compliance data with dashboard slides. Consultants advise on carbon neutrality using timeline charts.
Non-profits rally support with impact visuals; academics illustrate climate models.
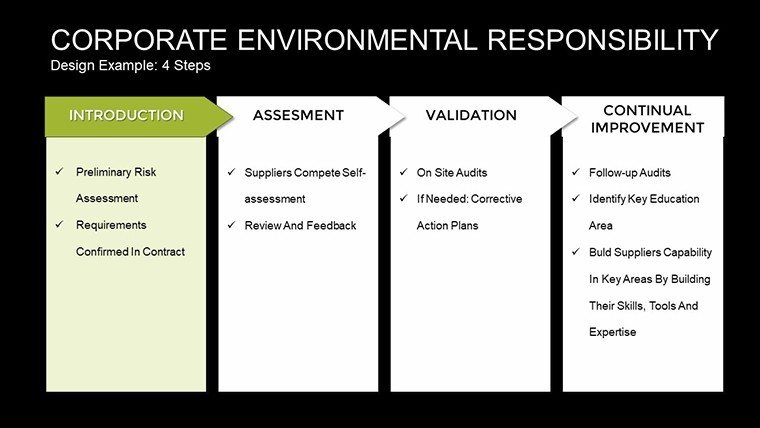
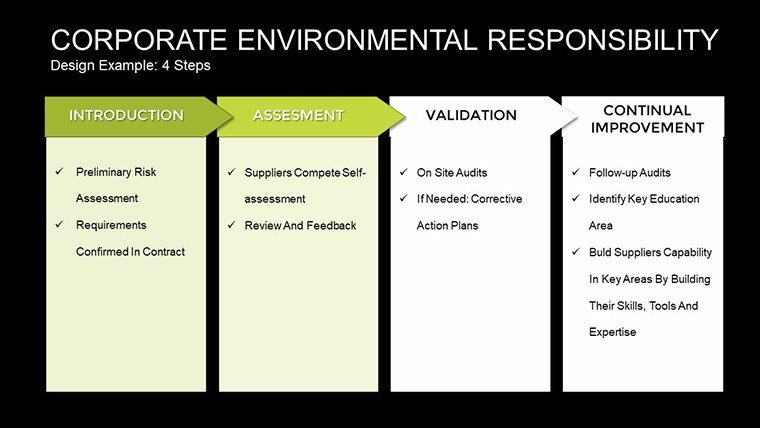
Streamlining Your Eco-Presentation Process
- Set Up Theme: Choose eco-friendly colors.
- Input Metrics: Populate with environmental data.
- Refine Graphics: Adjust for clarity and emphasis.
- Add Narratives: Include text on initiatives.
- Share Impact: Present or export for stakeholders.
Outperforms basics with thematic icons. Subtle humor: "Going green without the envy."
Best Practices for Sustainable Messaging
Cite sources like EPA guidelines for authority. Concise content, bold calls, alt texts: "Environmental responsibility chart for emissions."
Commit to better presentations - download this template to amplify your environmental voice.
Frequently Asked Questions
How editable are the environmental charts?
Fully, including data, colors, and layouts.
Is it suited for non-profits?
Yes, ideal for showcasing conservation efforts.
What data types does it support?
Any environmental metrics, from emissions to recycling rates.
Compatible with which software?
PowerPoint and Google Slides.
Any built-in themes?
Earth-toned designs for sustainability focus.