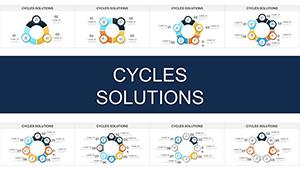
9-Step Cycle Arrows PowerPoint Charts: Empower Your Narratives


Type: PowerPoint Charts template
Category: Cycle
Sources Available: .pptx
Product ID: PC00775
Template incl.: 24 editable slides
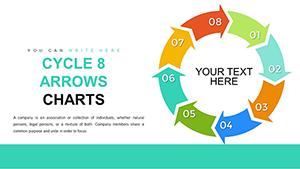
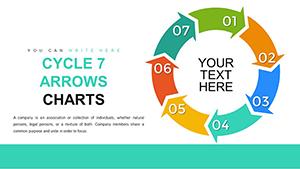
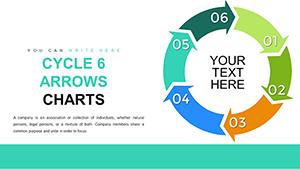
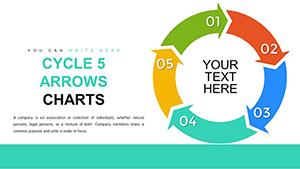
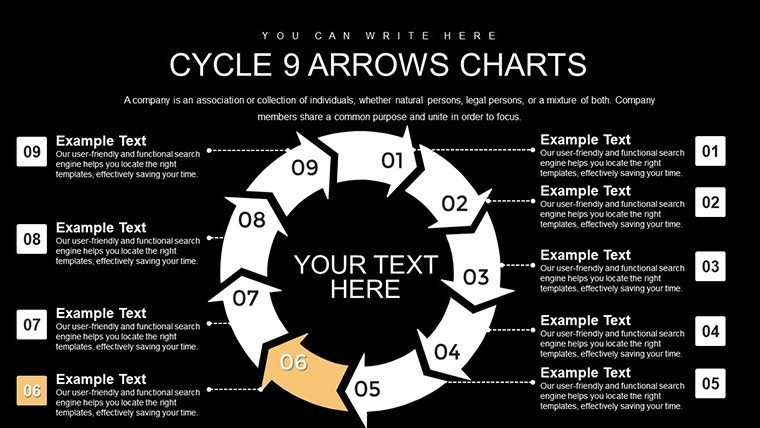
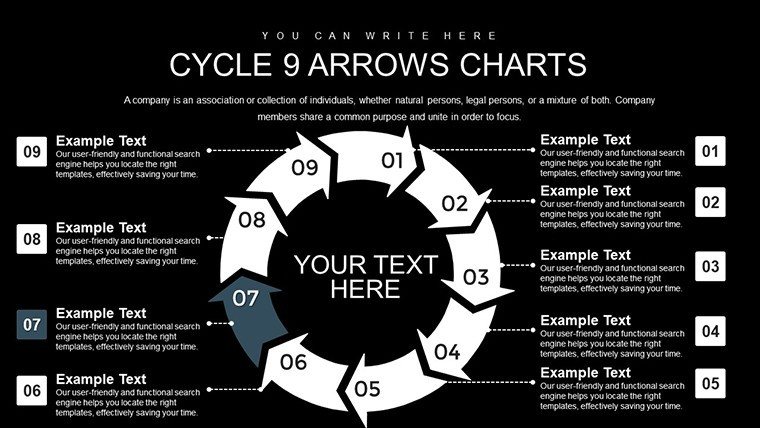
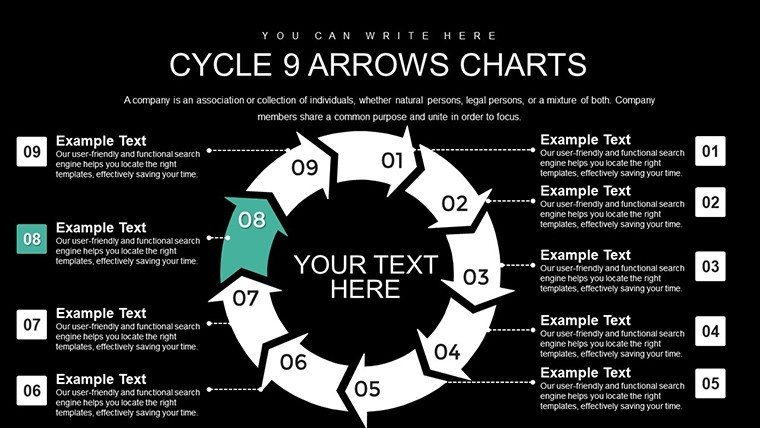
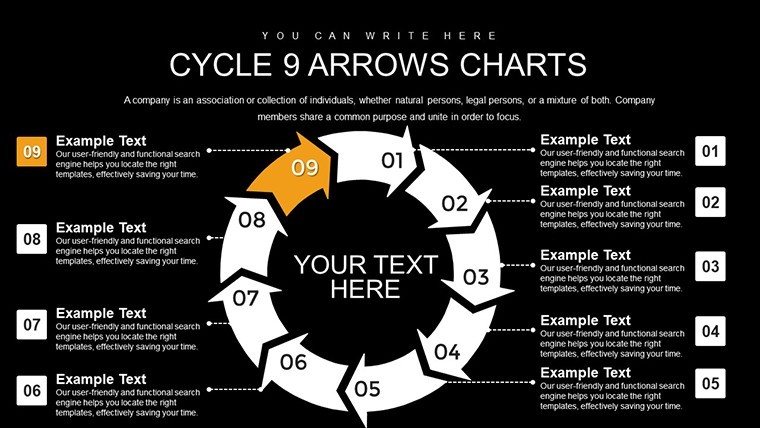
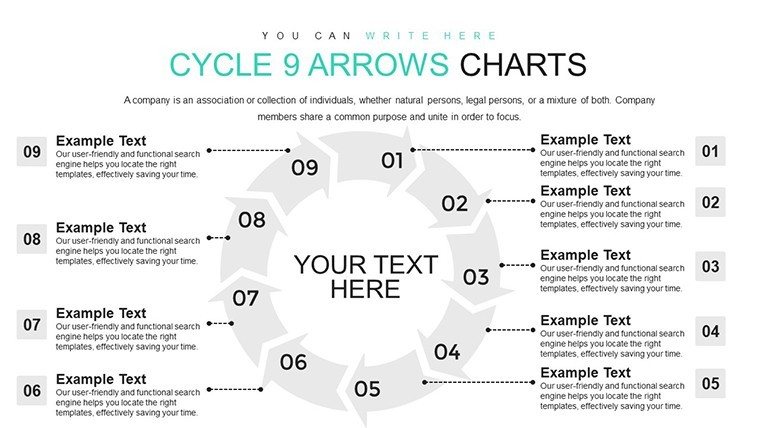
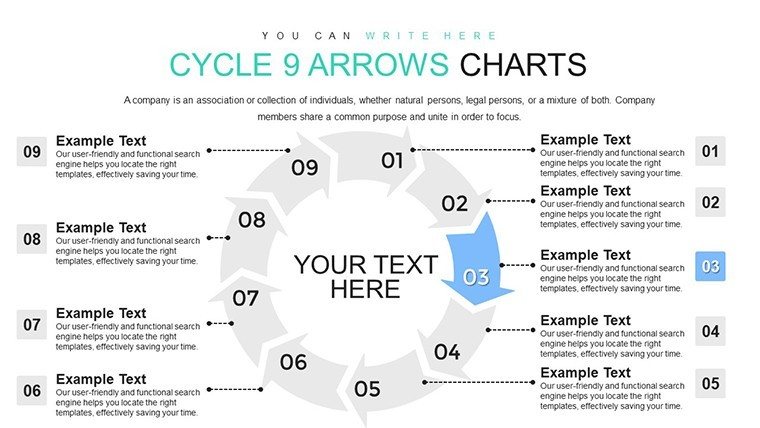
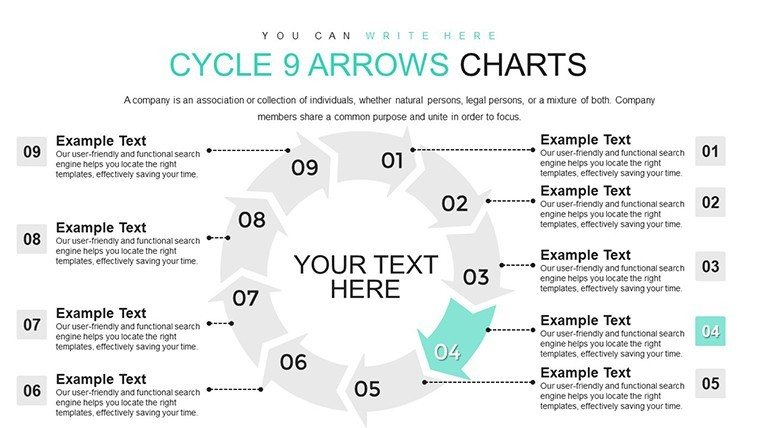
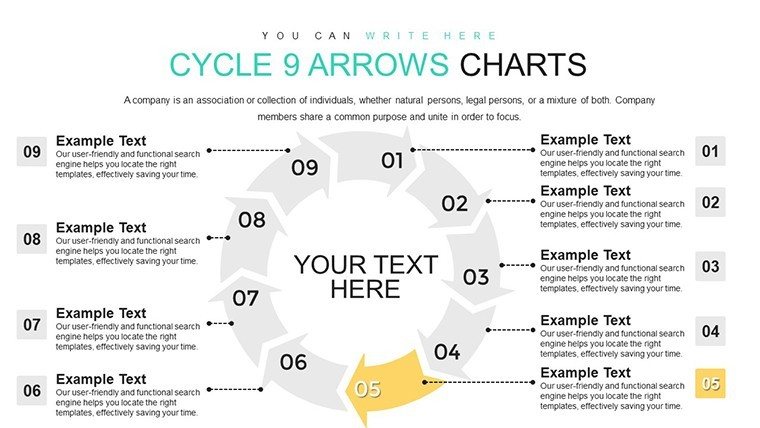
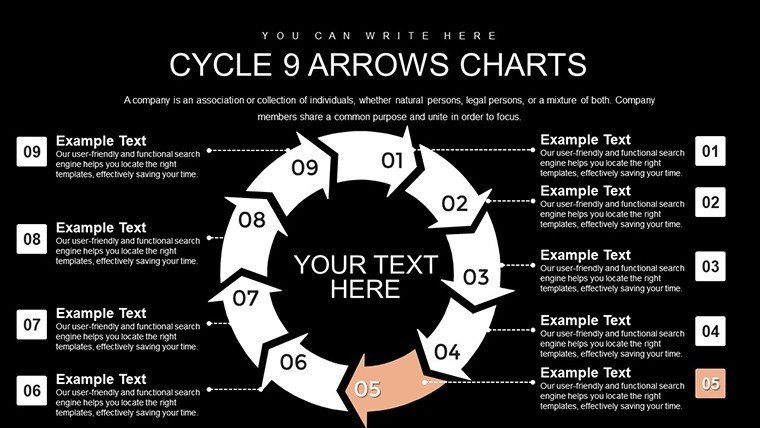
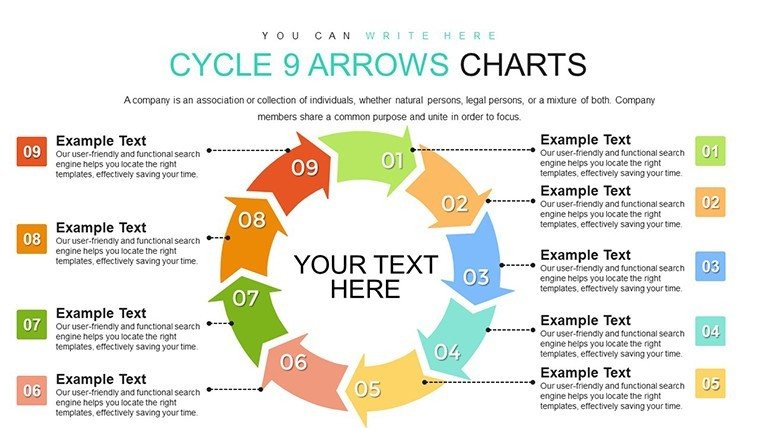
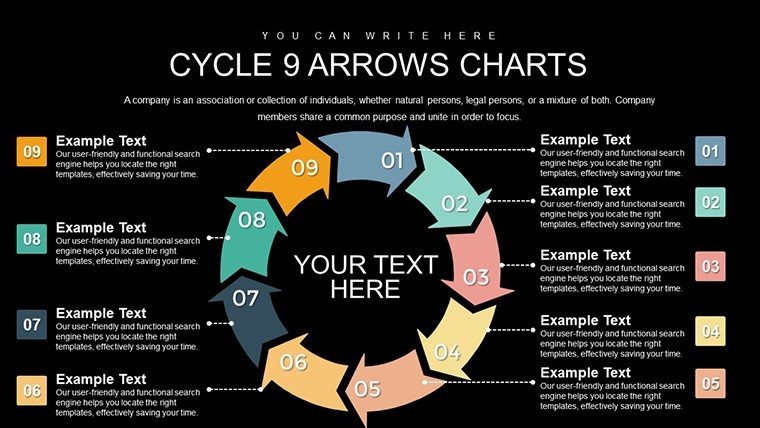
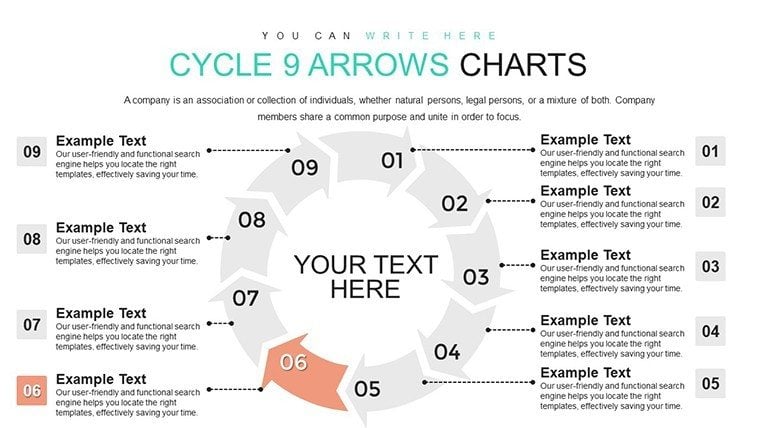
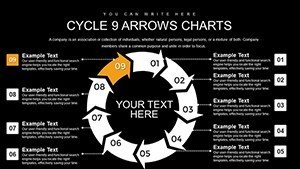
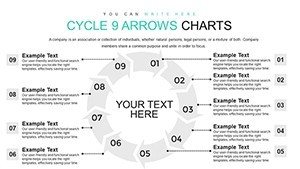
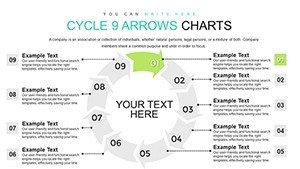
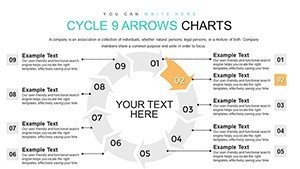
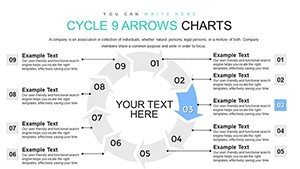
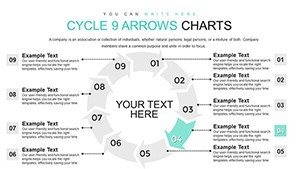
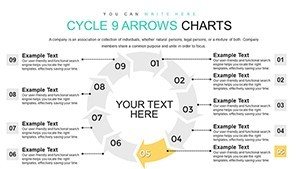
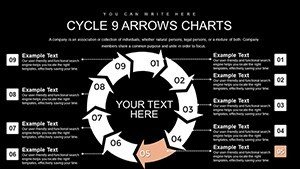
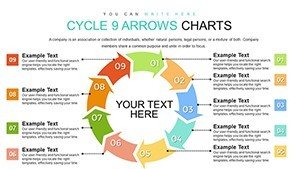
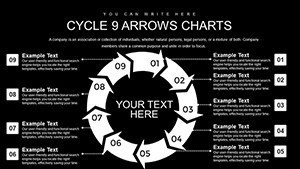
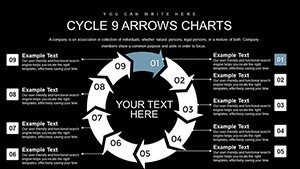
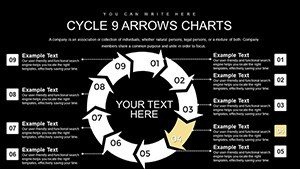
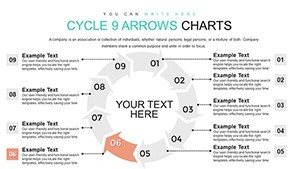
Step into a world where your ideas flow effortlessly and your audience hangs on every visual cue. The 9-Step Cycle Arrows PowerPoint Charts Template is crafted for those who want to go beyond ordinary slides, offering 24 editable masterpieces that bring processes to life. Tailored for marketing teams pitching campaigns or educators breaking down concepts, this template leverages nine interconnected arrows to map out intricate cycles with elegance and efficiency.
Addressing the frustration of disjointed presentations, this tool provides a cohesive framework for visualizing workflows, such as consumer journeys in marketing strategies. Imagine an architect using it to detail nine phases of urban planning, aligning with LEED certification processes for sustainable designs. Its PowerPoint-native format ensures hassle-free editing, while versatile customizations let you infuse personal touches that resonate with your viewers.
What sets this apart is its focus on engagement - smooth animations guide the eye through each step, turning static data into a compelling story. For instance, in a real-world scenario, a digital marketing agency might use the arrows to illustrate a content strategy cycle, from ideation to analytics, resulting in higher client retention as per case studies from firms like HubSpot.
Essential Features for Seamless Customization
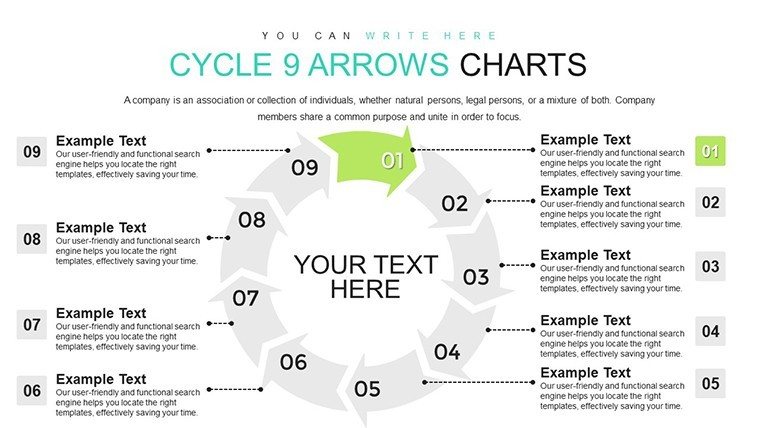
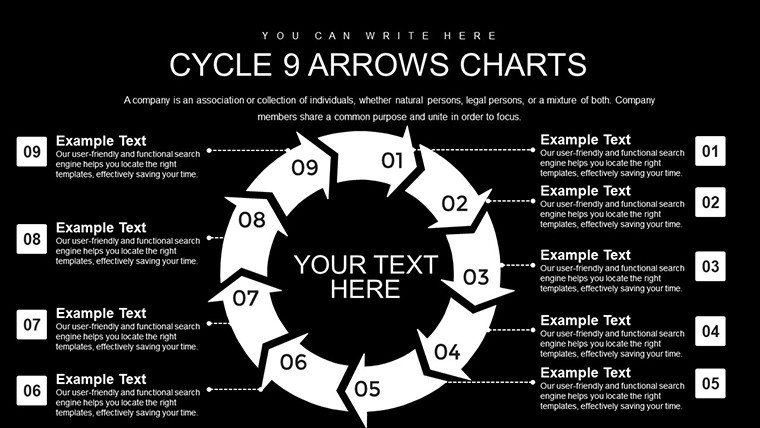
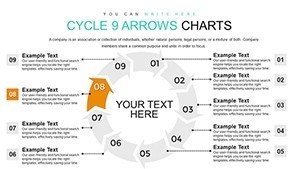
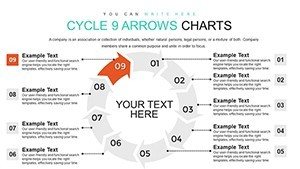
Explore the robust toolkit within this template. The nine arrows serve as a flexible canvas for any cyclical narrative, enhanced by data-driven elements that make insights pop.
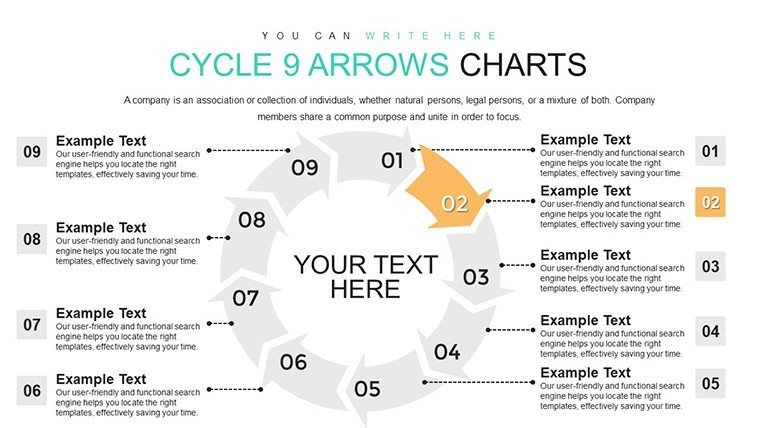
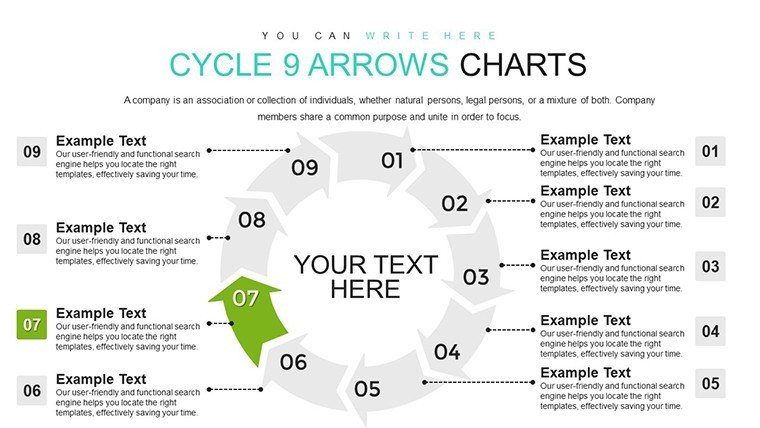
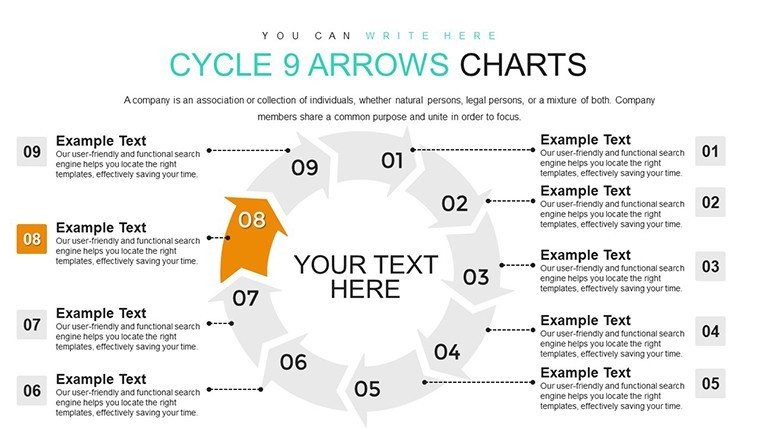
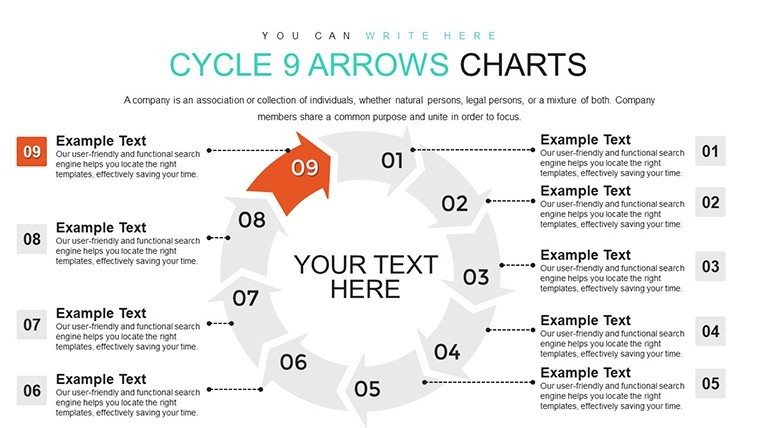
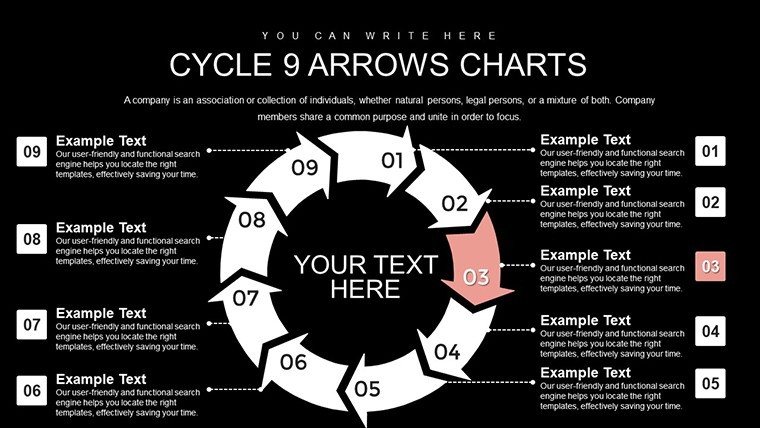
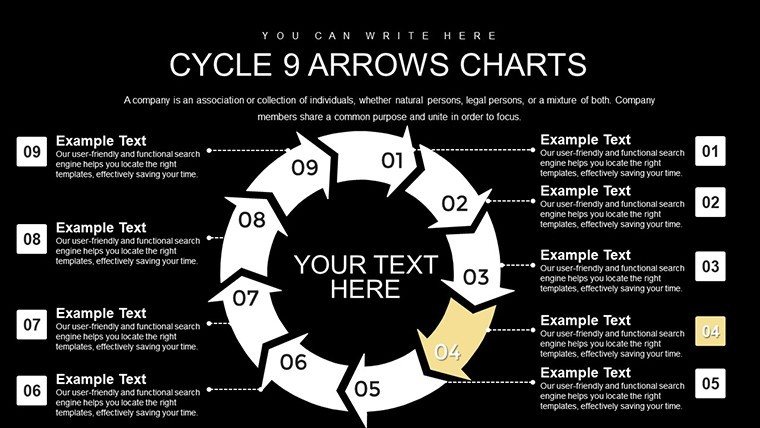
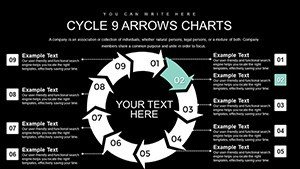
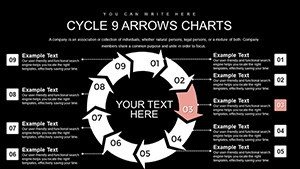
- Animated Transitions: Bring cycles to life with fluid animations that reveal steps progressively.
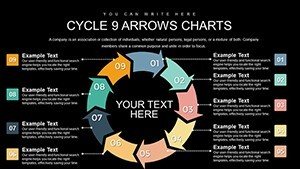
- Color and Font Flexibility: Match your brand's aesthetic with easy-to-apply themes.
- Infographic Integration: Embed icons and diagrams for richer visual storytelling.
- Data Charts: Include editable graphs to support your cycle with hard numbers.
- User-Friendly Interface: Intuitive design speeds up creation without steep learning curves.
These elements are informed by best practices in graphic design, ensuring your slides adhere to principles like Gestalt theory for better perception.
Diverse Use Cases with Proven Impact
In marketing, this template excels at depicting campaign lifecycles - planning, execution, measurement - helping teams like those at Coca-Cola refine strategies. Educators can simplify lesson plans, cycling through topics to boost student retention by up to 30%, as seen in studies from educational journals.
For consultants, it's invaluable in explaining process optimizations, with arrows highlighting iterative improvements. Unlike generic PowerPoint templates, this one offers thematic depth, avoiding the pitfalls of bland visuals that disengage audiences.
Workflow Integration Tips
- Import the template into PowerPoint and duplicate slides as needed.
- Populate arrows with your steps, using text boxes for details.
- Apply custom colors via the slide master for uniformity.
- Incorporate data visualizations from Excel links.
- Test animations in slideshow mode for optimal timing.
Pair with collaboration tools like OneDrive for team input, streamlining revisions.
Expert Design Advice
To maximize appeal, balance text and visuals - use arrows to anchor key points while images provide context. Draw from authoritative sources like the American Marketing Association for campaign visuals, ensuring trustworthiness in your deliverables.
Don't settle for average - grab this 9-Step Cycle Arrows template and craft presentations that inspire and inform.
Frequently Asked Questions
- What makes the 9-step design unique?
- It allows for detailed breakdowns of complex cycles without overwhelming the viewer.
- Can I add my own data to the charts?
- Yes, all charts are data-driven and editable directly in PowerPoint.
- Is animation customization possible?
- Absolutely, adjust timings and effects to fit your pace.
- Does it support team collaboration?
- Yes, share via cloud services for real-time edits.
- How do I handle large datasets?
- Use integrated graphs to summarize data within the cycle.
- Are there export options?
- Export to PDF or images for versatile sharing.