Ishikawa Cause-Effect PowerPoint Charts Template: Decode Problems Visually


Type: PowerPoint Charts template
Category: Business Models, Analysis
Sources Available: .pptx
Product ID: PC00733
Template incl.: 37 editable slides
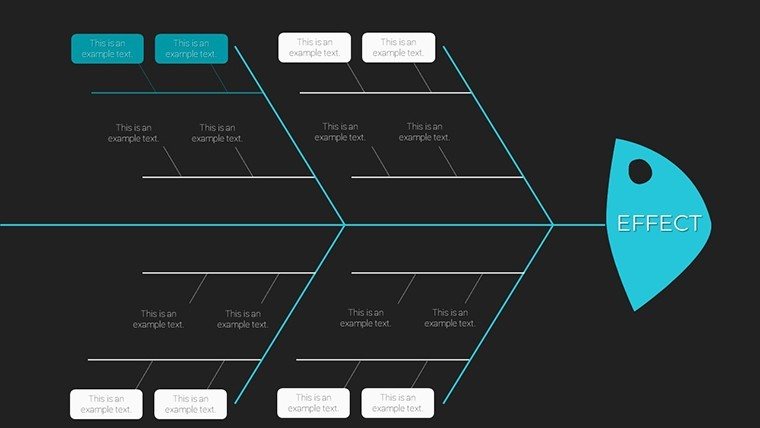
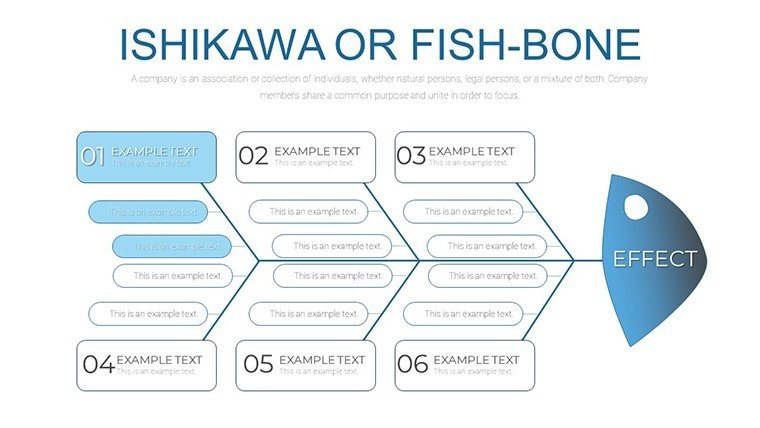
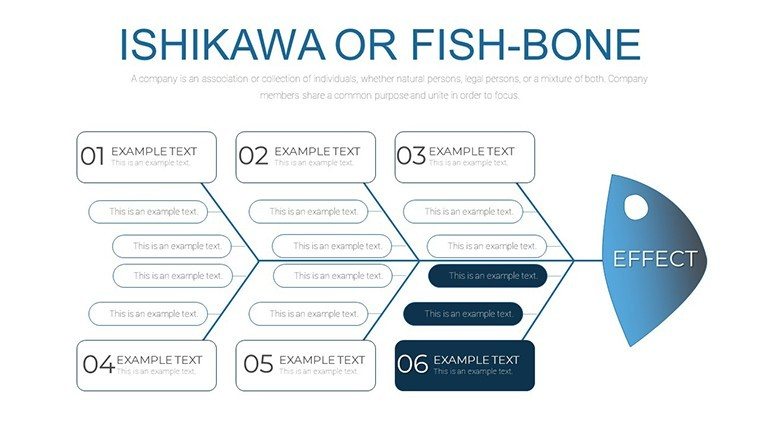
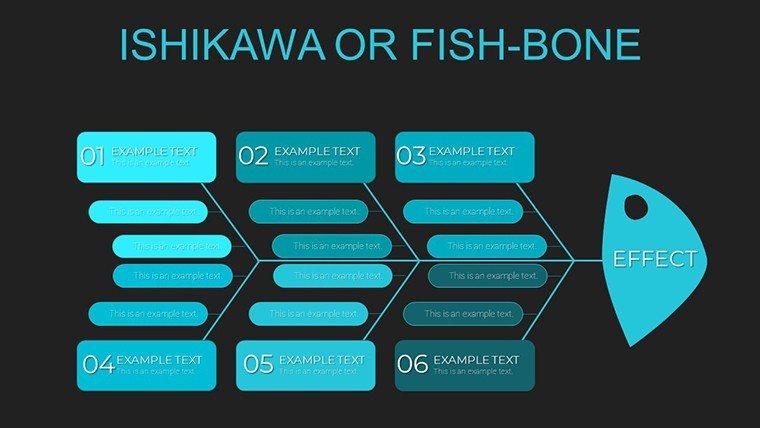
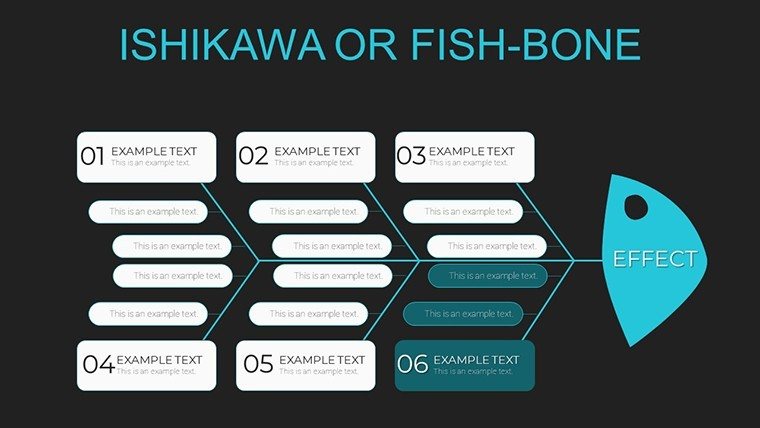
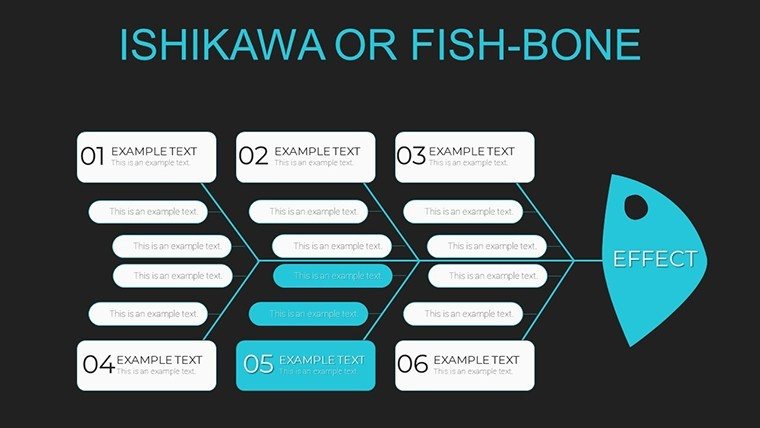
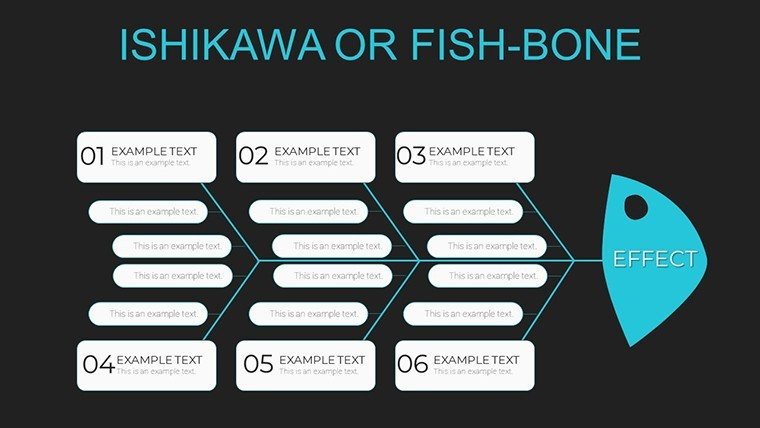
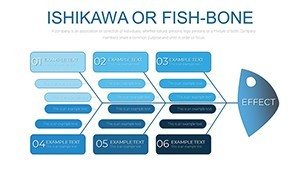
When challenges arise in projects or processes, pinpointing the root causes is key to lasting solutions. The Ishikawa Cause-Effect PowerPoint Charts Template, inspired by Kaoru Ishikawa's renowned fishbone diagram, offers 37 editable slides to map out complexities with ease. Tailored for project managers, quality analysts, and educators, this tool turns abstract problems into structured visuals, categorizing causes like methods, materials, and manpower. Envision leading a team brainstorming session where branches of the fishbone reveal hidden factors, fostering collaborative fixes. With its intuitive design, you'll customize graphs to fit specific scenarios, from manufacturing defects to service delays. This template empowers you to move beyond symptoms, driving proactive improvements and demonstrating expertise in lean methodologies. It's your ally in creating presentations that not only identify issues but inspire corrective actions, ensuring your audience grasps the full picture effortlessly.
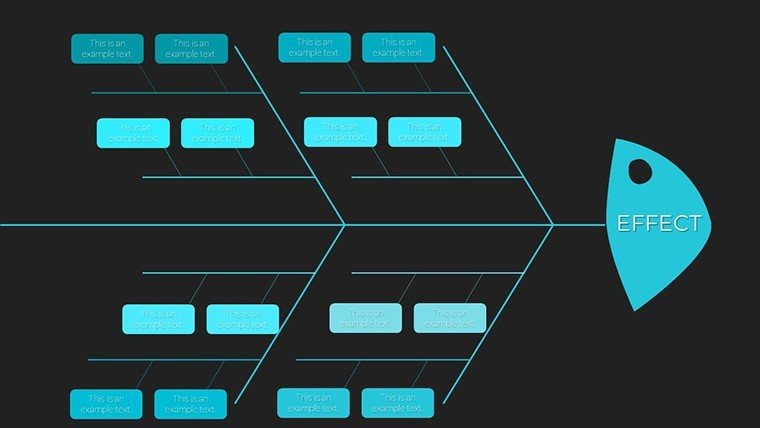
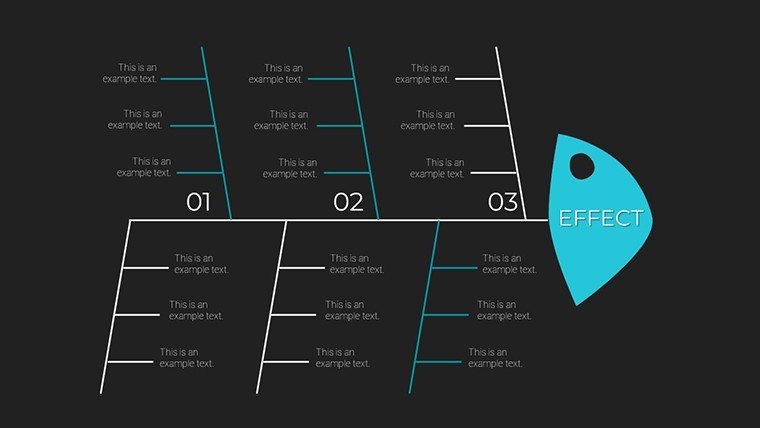
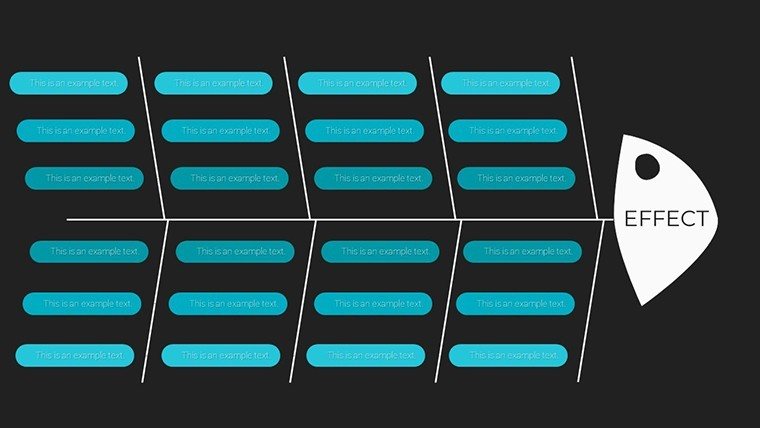
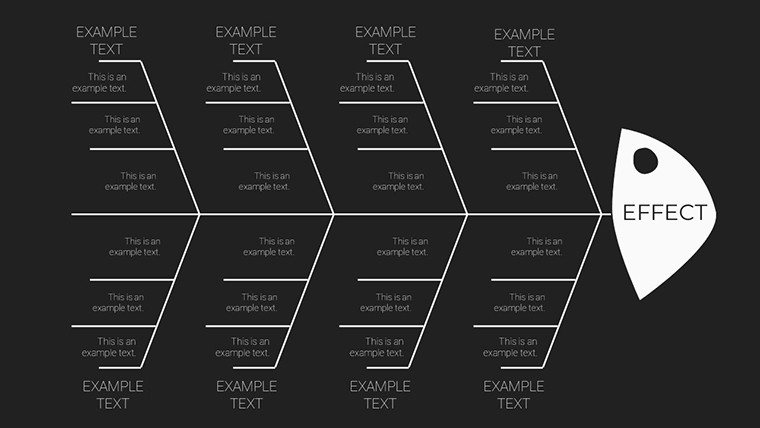
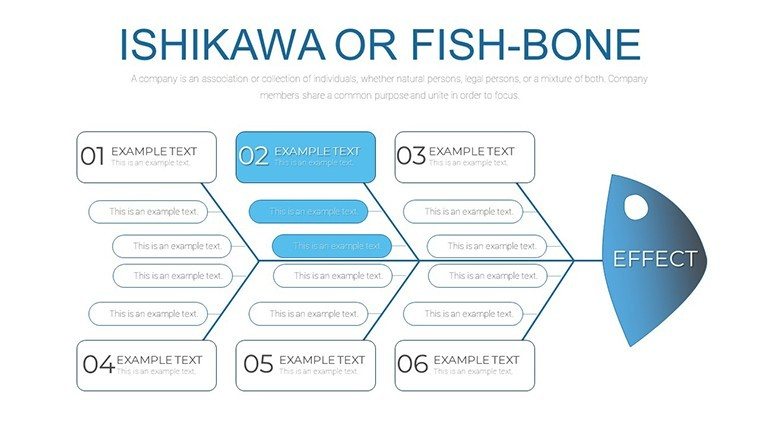
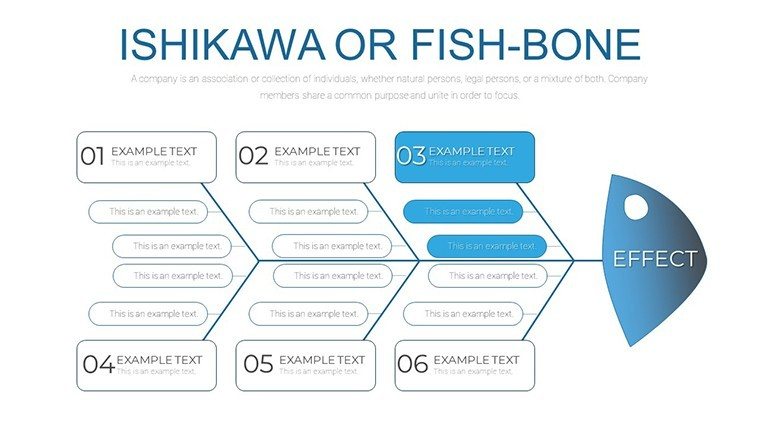
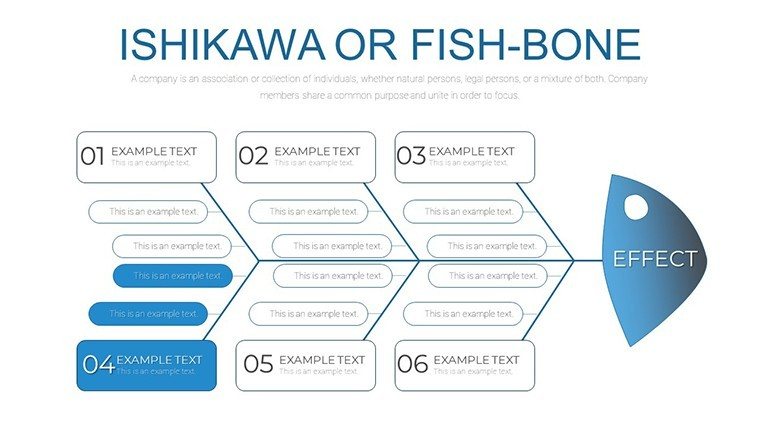
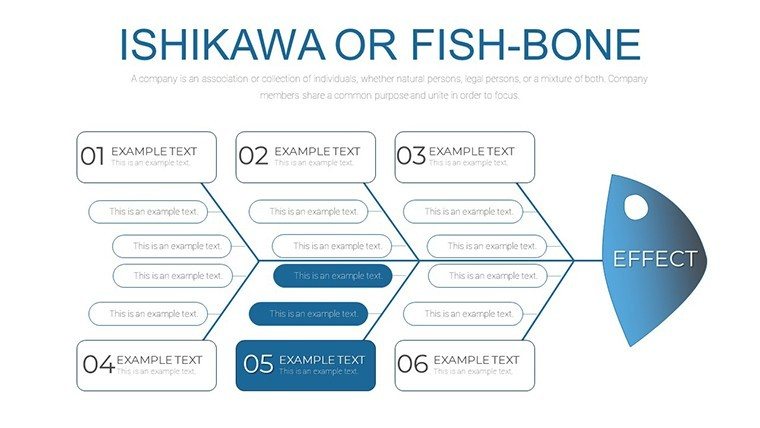
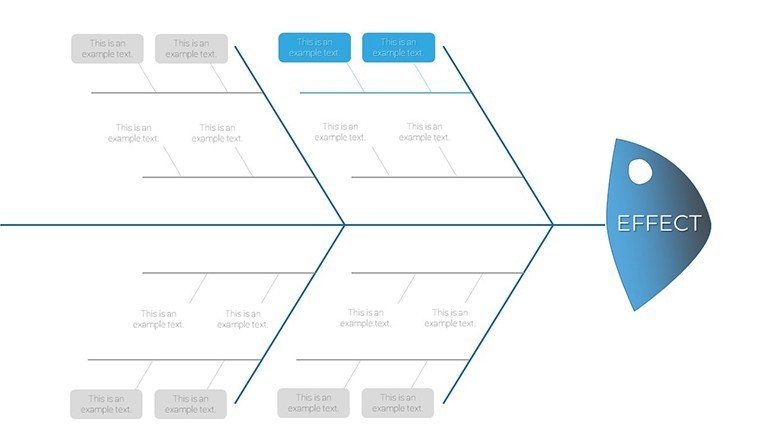
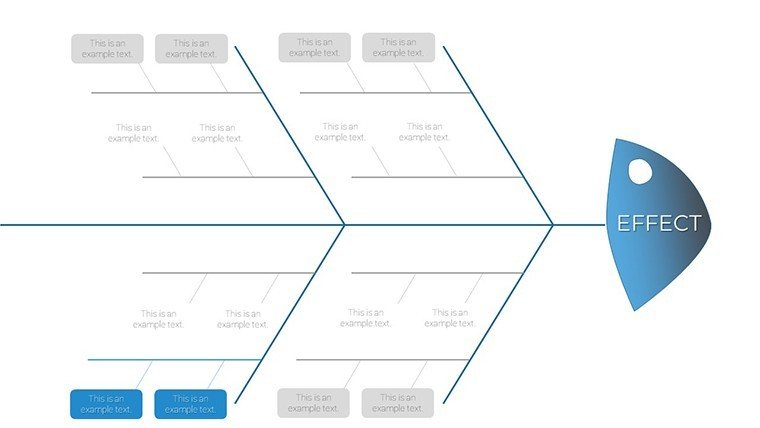
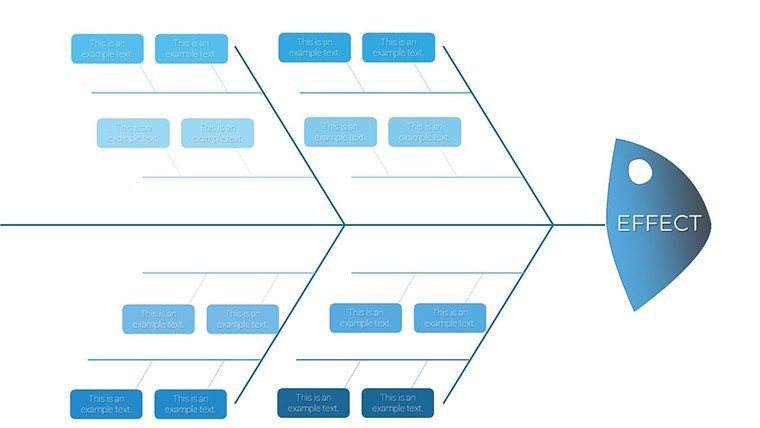
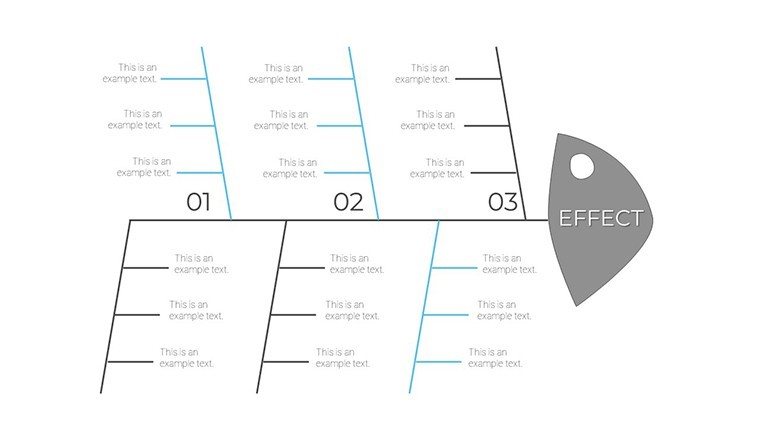
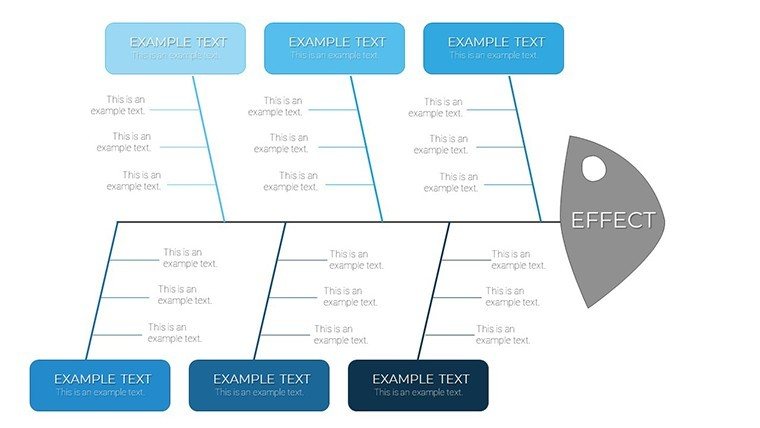
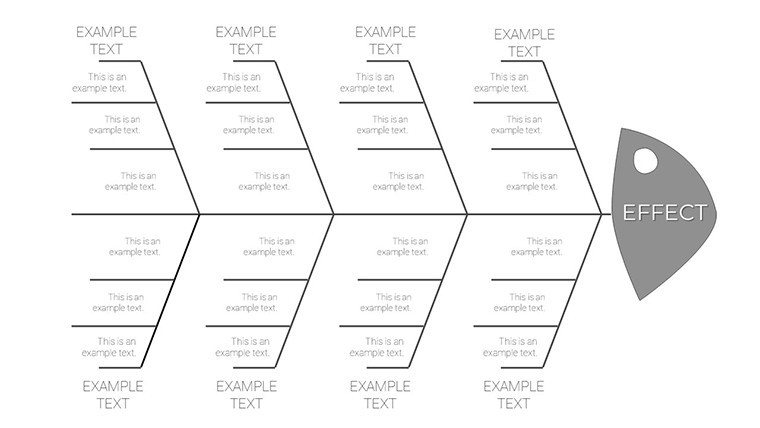
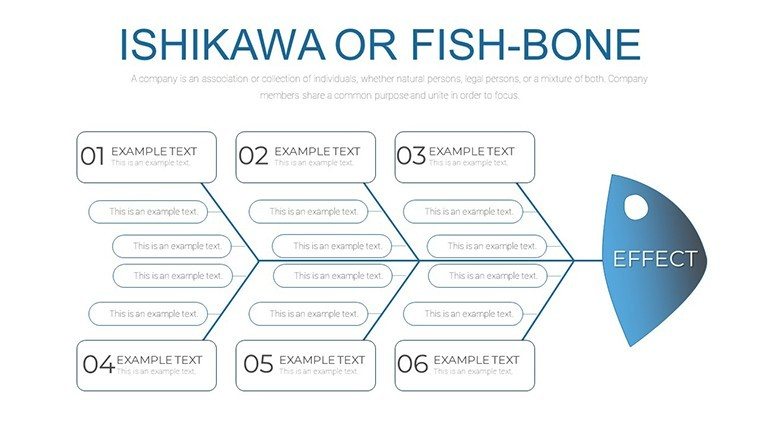
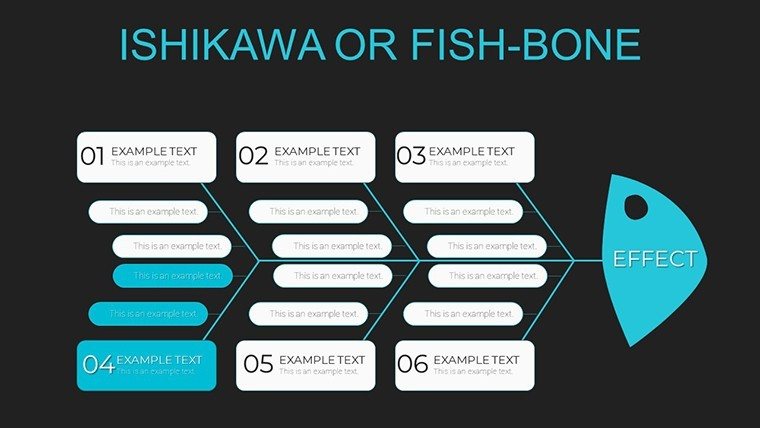
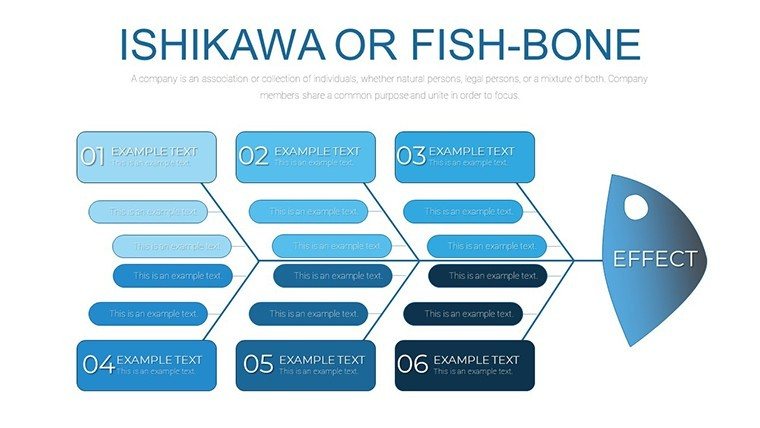
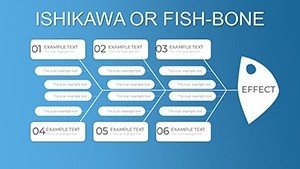
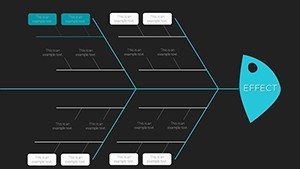
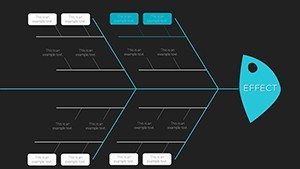
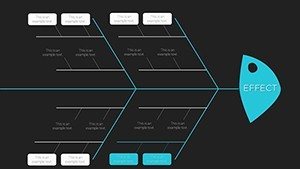
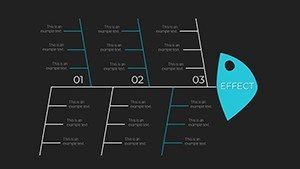
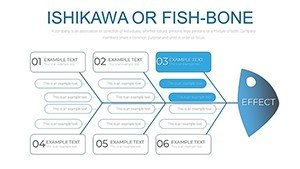
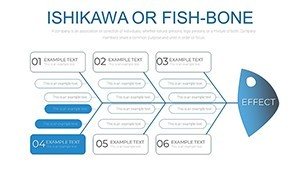
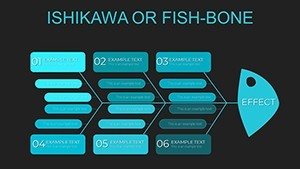
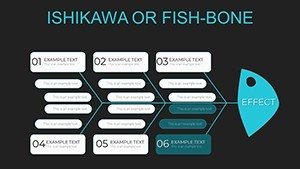
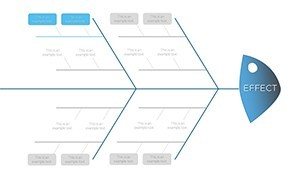
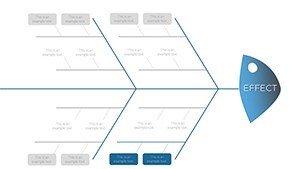
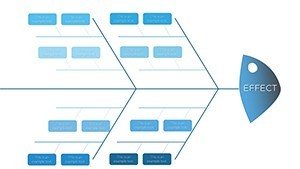
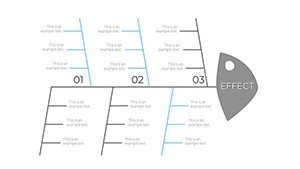
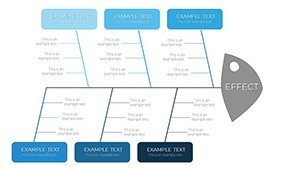
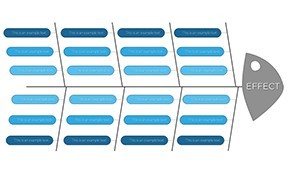
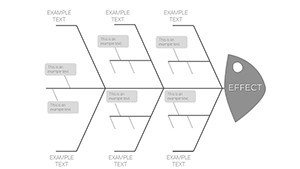
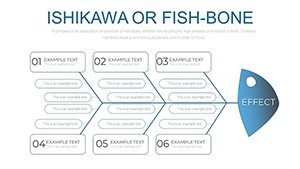
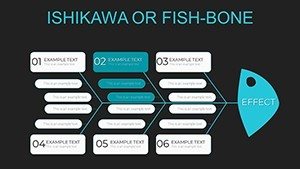
The Essence of Fishbone Diagrams in Action
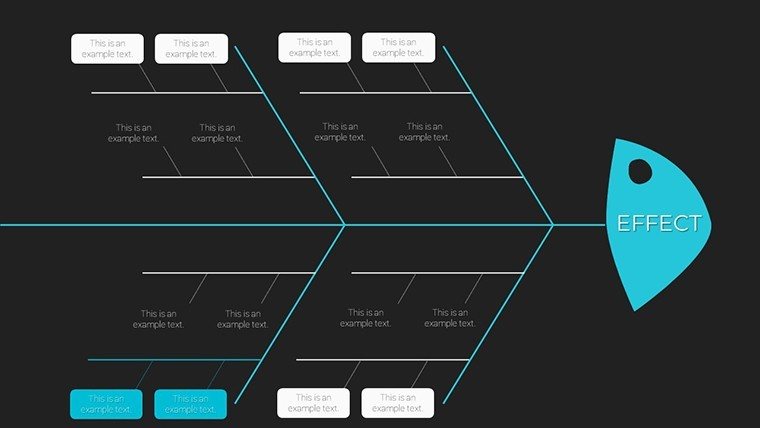
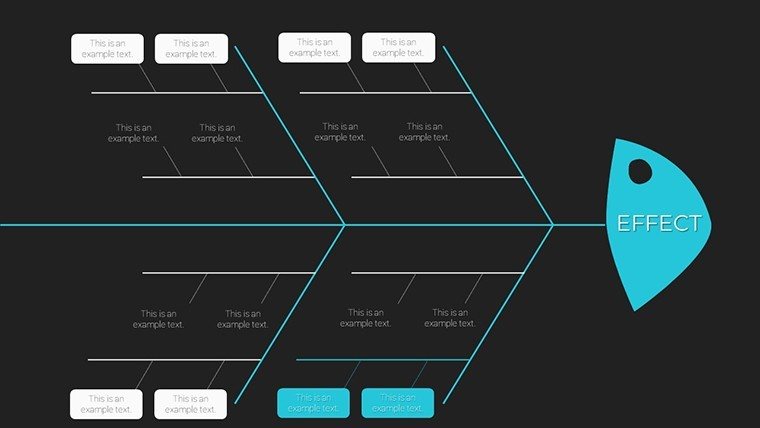
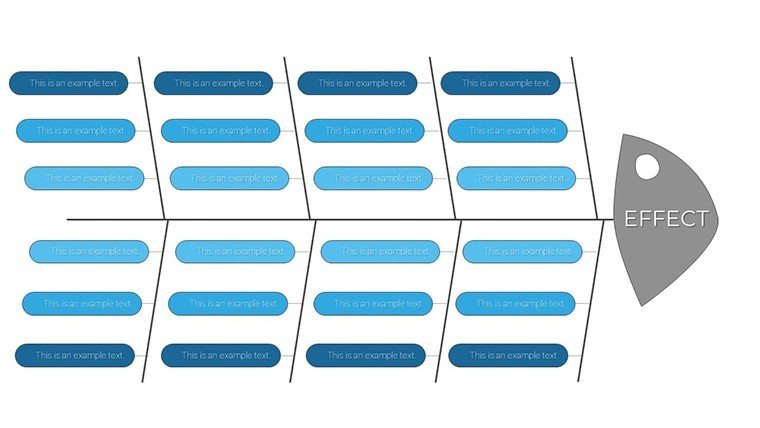
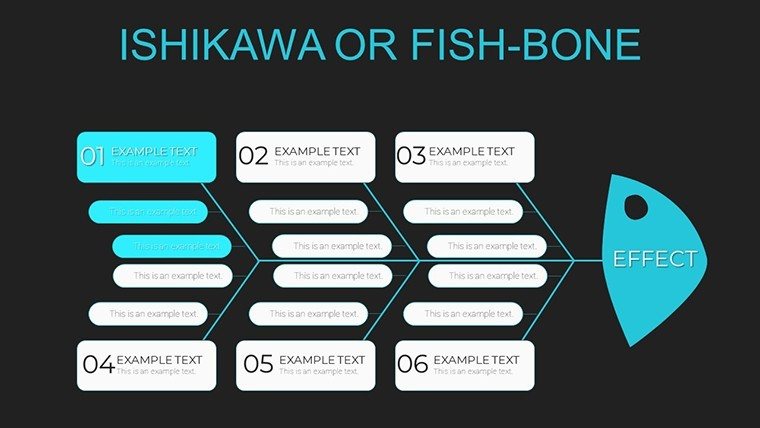
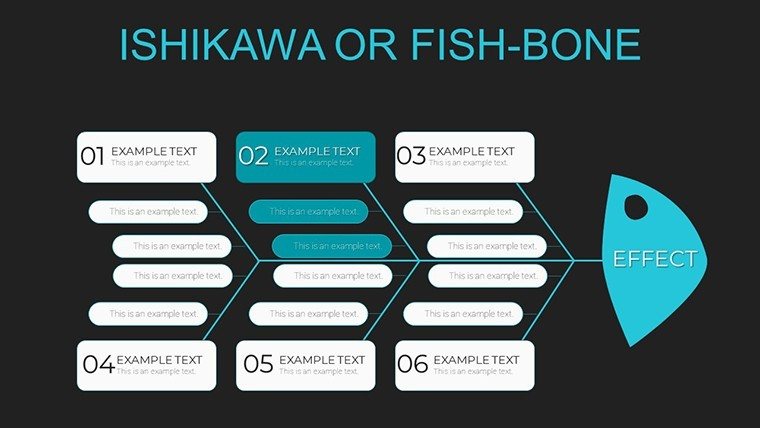
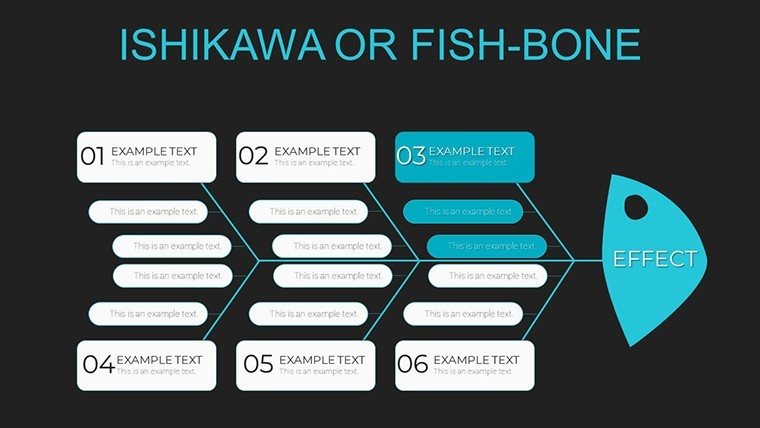
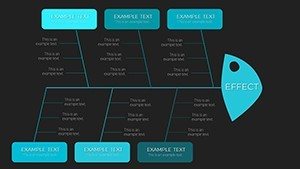
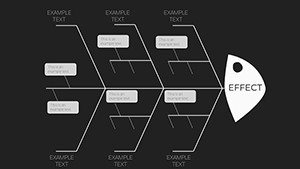
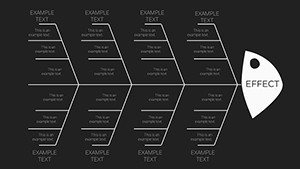
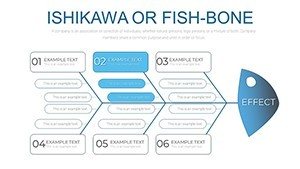
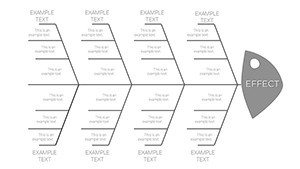
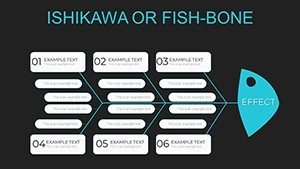
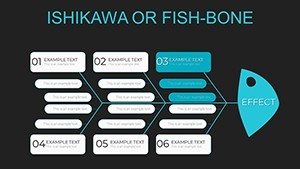
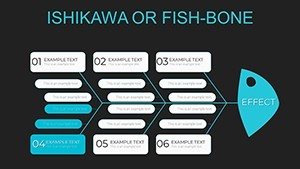
This template's strength is its structured approach to cause-effect analysis. Each slide features a central spine for the problem statement, with branching categories for potential causes. You can expand or contract branches as needed, adding sub-causes with simple drags. Unlike plain drawings, these include gradient fills and icons for visual appeal, making dense information digestible. Customization is key: alter line styles, add text boxes, or integrate data from spreadsheets for evidence-based branches.
Core Features for In-Depth Analysis
- Customizable Branches: Adjust category labels and add unlimited sub-branches for detailed breakdowns.
- Visual Enhancements: Icons and color-coding to differentiate cause types, aiding quick scans.
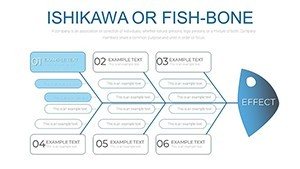
- Multiple Layouts: From basic 4M (Man, Machine, Material, Method) to expanded 6M versions including Measurement and Mother Nature.
- User-Friendly Edits: All elements editable in PowerPoint; compatible with Google Slides for team input.
- Captivating Designs: Pre-set themes that blend with corporate branding for professional outputs.
These address the tedium of manual diagramming, providing a ready framework that aligns with quality standards like ISO 9001.
Practical Scenarios: From Theory to Resolution
In project management, use it to dissect delays - branches might reveal supplier issues or skill gaps. For educators, teach root cause analysis in business classes by simulating case studies, like airline delays categorized into weather, maintenance, and crew. Analysts in healthcare could map patient wait times, identifying bottlenecks for process tweaks. A real-world nod: Toyota's use of Ishikawa diagrams in their production system revolutionized quality control, a legacy this template helps you emulate.
Implementing the Template Step by Step
- Define the problem: Enter it in the central arrow on a chosen slide.
- Categorize causes: Label major branches and brainstorm sub-factors with your team.
- Visualize priorities: Use bolding or colors to highlight high-impact causes.
- Add evidence: Insert charts or notes linking to data sources.
- Present and iterate: Share for feedback, refining in subsequent slides.
Compared to generic tools, this offers specialized layouts that speed up analysis, drawing from Six Sigma principles for robust results.
Advanced Tips for Effective Diagramming
Encourage diverse team input to avoid bias, as per Ishikawa's collaborative ethos. Pair with Pareto charts (included in some slides) to prioritize causes. For , reference studies like those from the American Society for Quality showing fishbone's efficacy in reducing errors. In one manufacturing case, applying this method cut defects by 25%. Export to PDF for reports or integrate with Jira for agile workflows.
Trust in this template's design ensures your analyses are credible and actionable, positioning you as a problem-solving authority.
Step Up Your Analytical Game
With 37 slides at your disposal, this Ishikawa template is a versatile asset for dissecting any issue. It's designed for those committed to excellence in analysis. Don't let problems linger - unlock this tool today and chart a path to smarter solutions.
Frequently Asked Questions
What is an Ishikawa diagram?
Also called fishbone, it's a visual tool for identifying root causes of a problem by categorizing factors.
How many categories can I use?
Flexible - from standard 4-6 to custom; slides support expansion as needed.
Is it only for manufacturing?
No, applicable to services, education, healthcare, and more for broad problem-solving.
Can I animate the branches?
Yes, use PowerPoint animations to reveal causes sequentially for engaging presentations.
Does it include examples?
Some slides have placeholders; customize with your data for real scenarios.