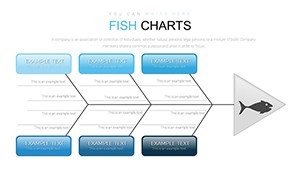
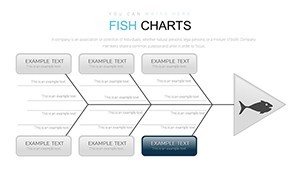
Analysis Ishikawa Fishbone PowerPoint Charts Template: Master Root Cause Analysis


Type: PowerPoint Charts template
Category: Business Models
Sources Available: .pptx
Product ID: PC00731
Template incl.: 48 editable slides
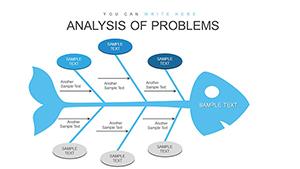
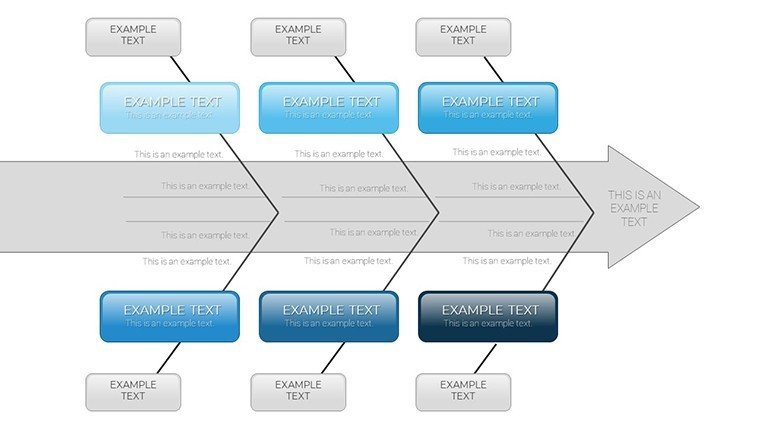
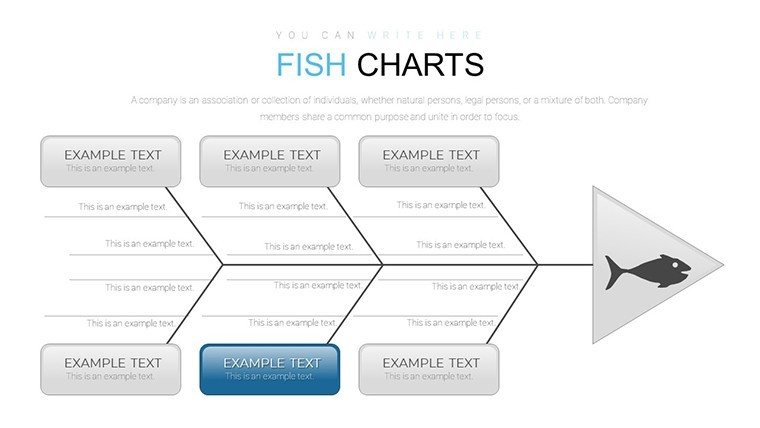
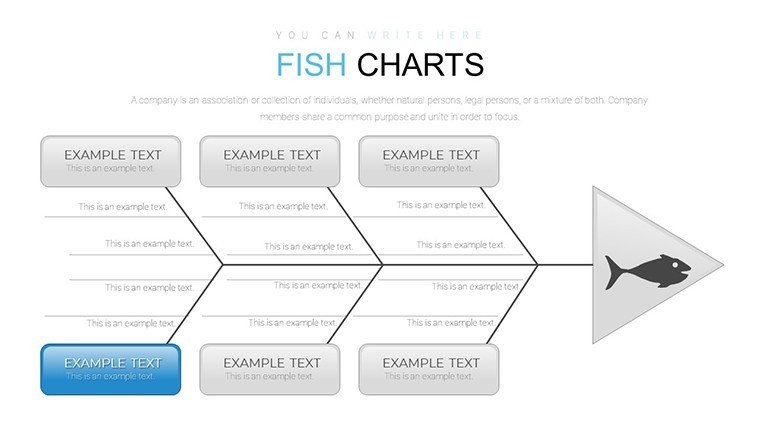
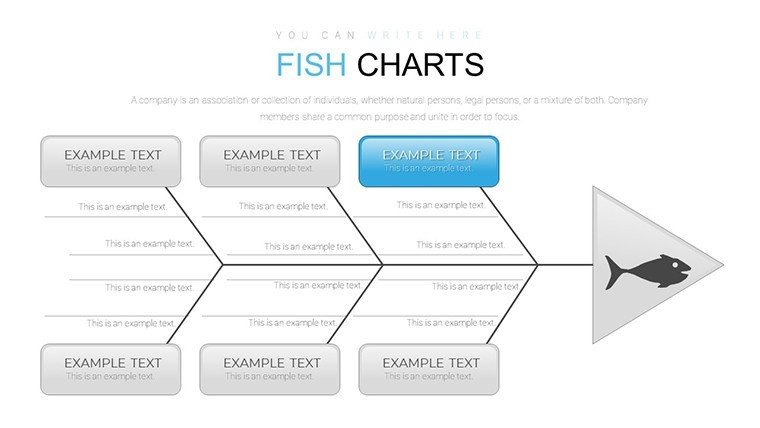
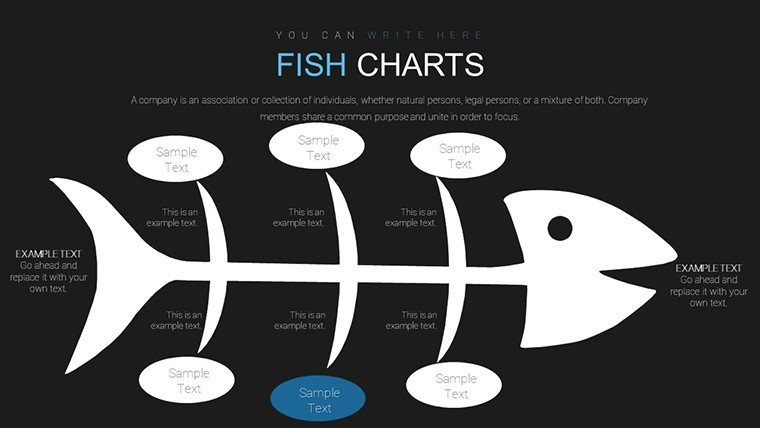
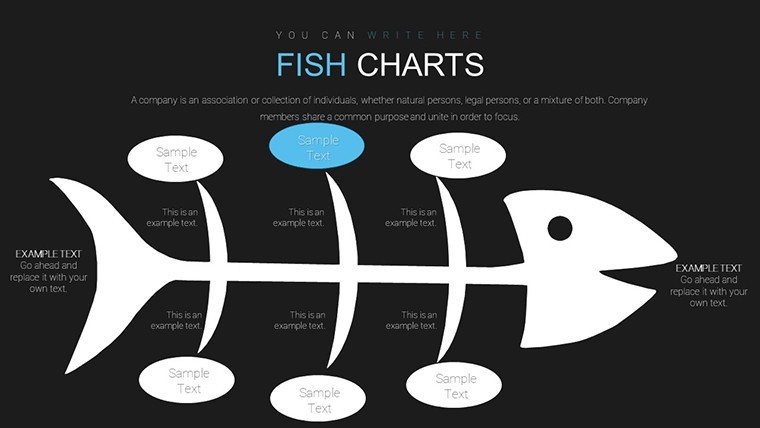
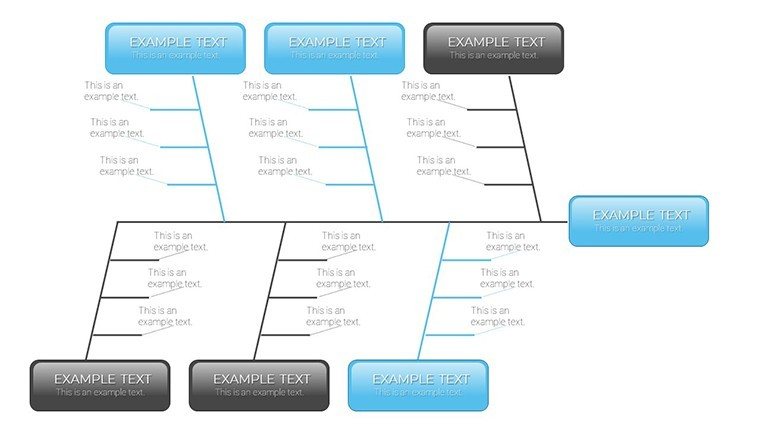
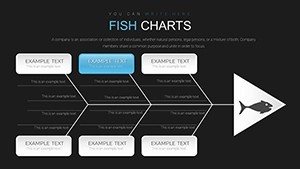
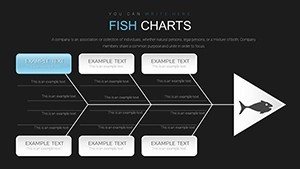
In the intricate world of problem-solving, where identifying the true origins of issues can mean the difference between stagnation and breakthrough, the Ishikawa Fishbone Diagram emerges as a timeless ally. Named after quality management pioneer Dr. Kaoru Ishikawa, this cause-and-effect tool transforms chaotic challenges into structured insights. Our Analysis Ishikawa Fishbone PowerPoint Charts Template brings this methodology to life with 48 fully editable slides, designed for professionals who demand precision and clarity in their presentations. Whether you're dissecting manufacturing defects, unraveling customer complaints, or tackling project delays in architecture, this template equips you to visualize complexities with ease.
Imagine leading a team through a construction project overrun - factors like materials, manpower, methods, and machinery all converging on a single problem head. With our template, you can branch out these elements intuitively, fostering collaborative brainstorming that aligns with standards from organizations like the American Institute of Architects (AIA). This isn't just a diagram; it's a strategic framework that enhances decision-making, saves time, and boosts productivity. Tailored for business managers, educators, consultants, and students, it integrates seamlessly into PowerPoint, allowing drag-and-drop customization to match your brand's aesthetic.
Unlocking the Power of Structured Problem-Solving
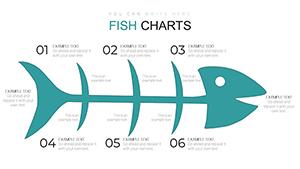
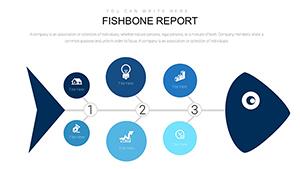
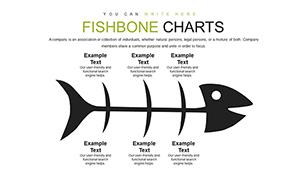
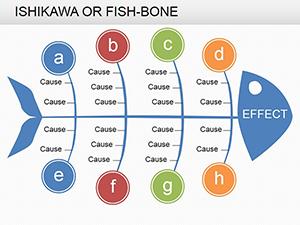
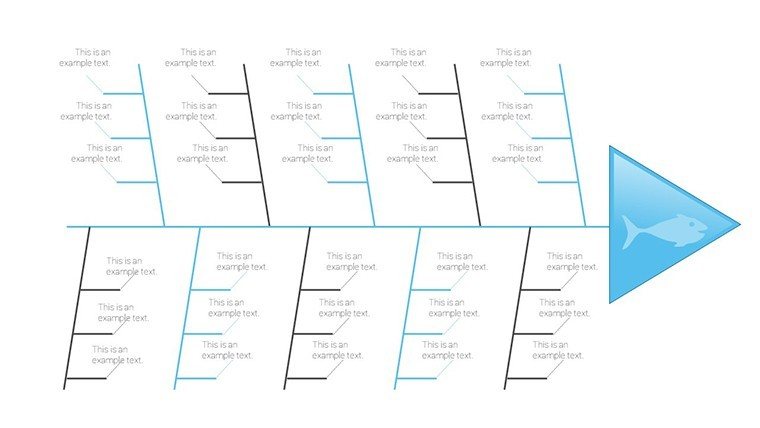
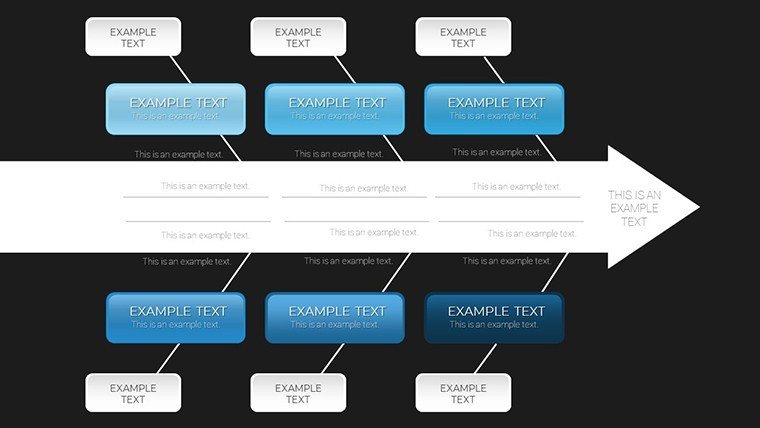
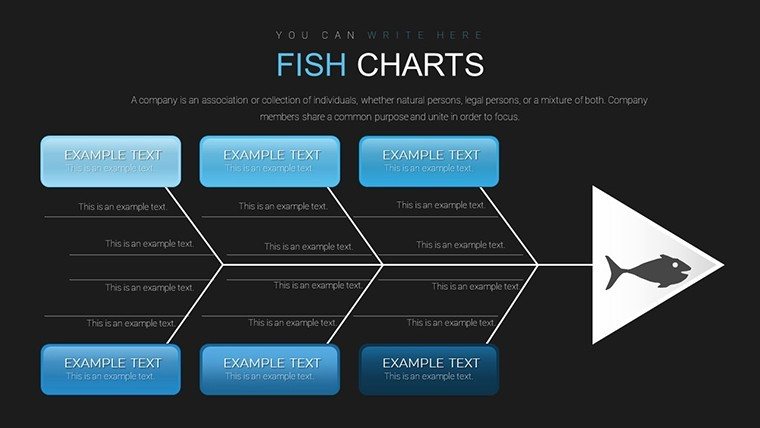
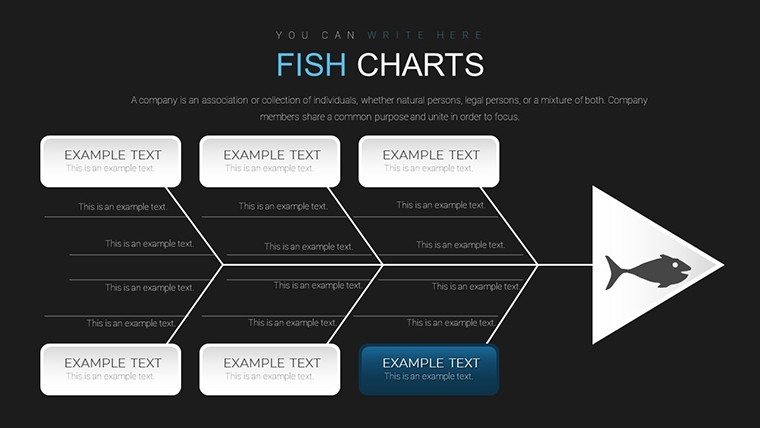
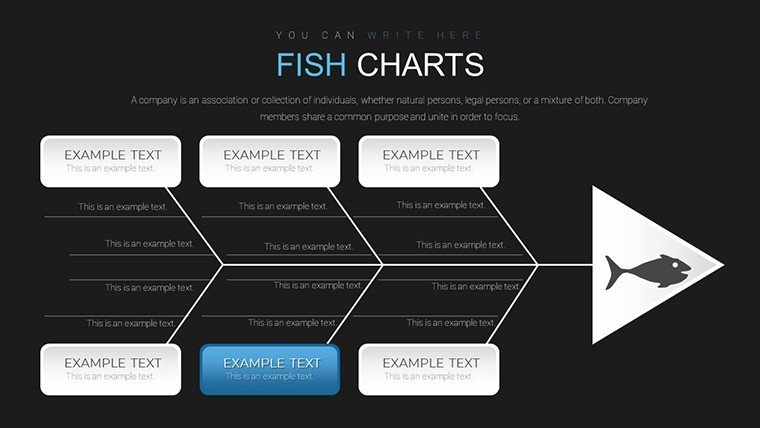
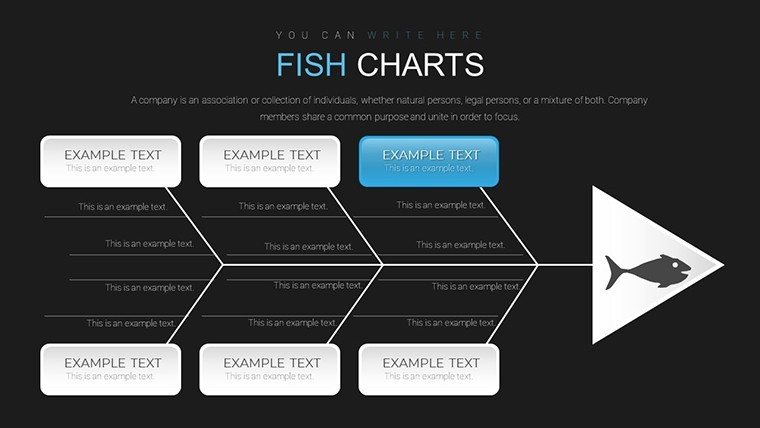
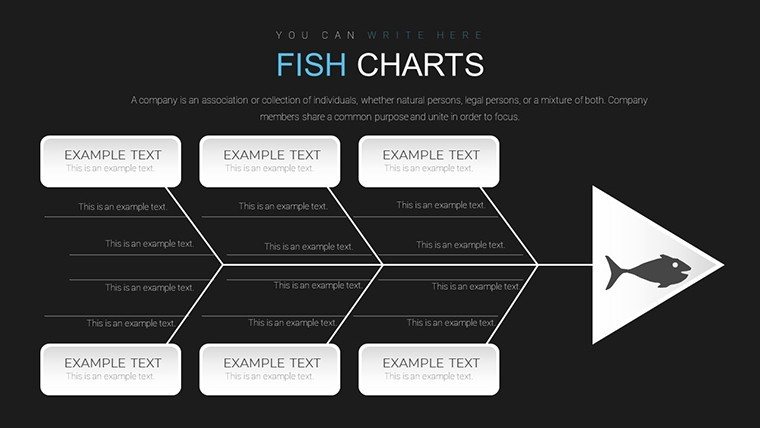
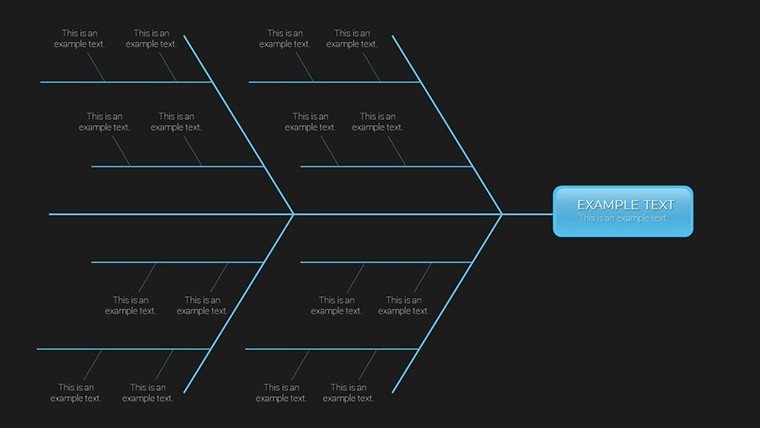
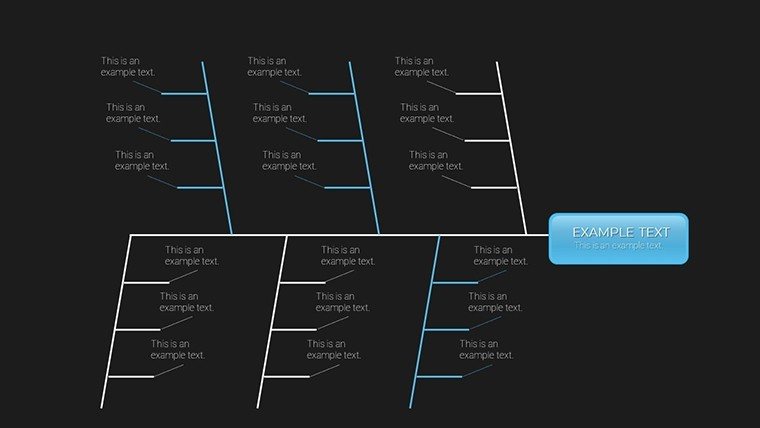
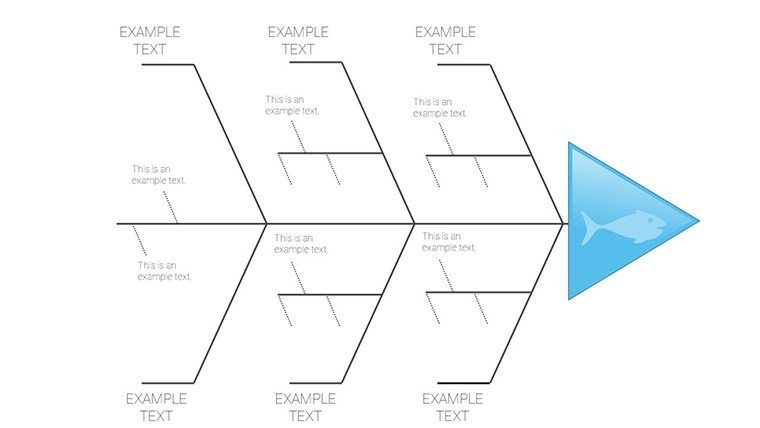
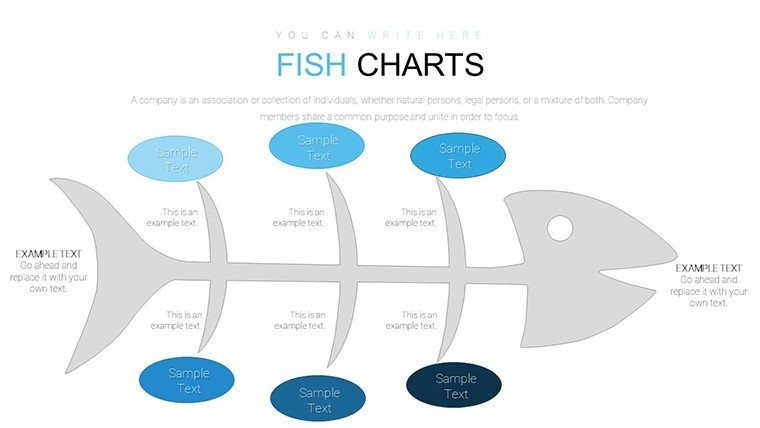
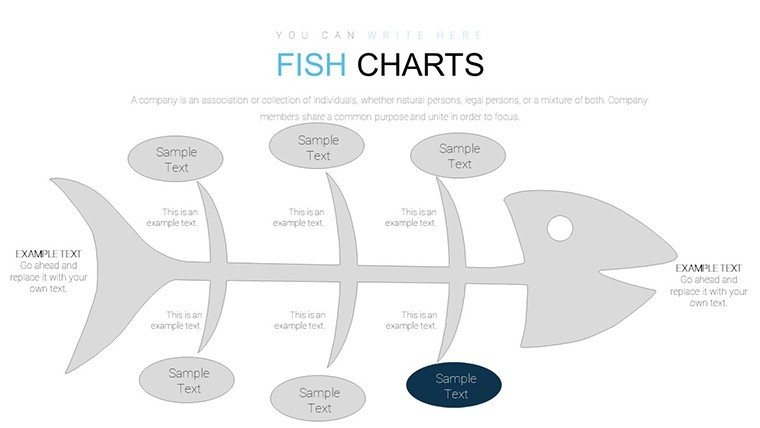
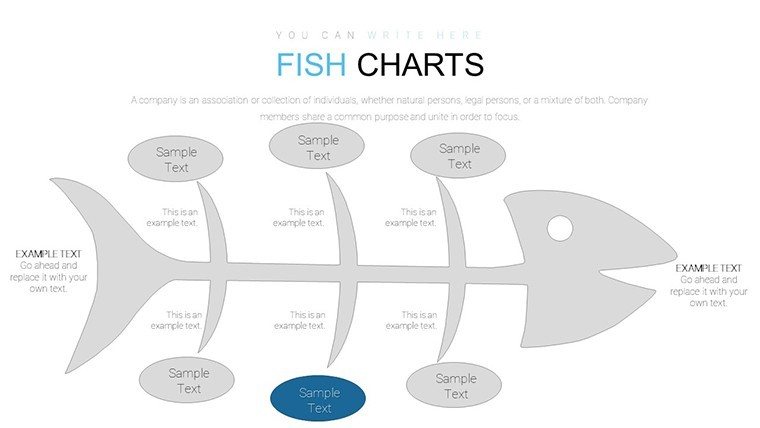
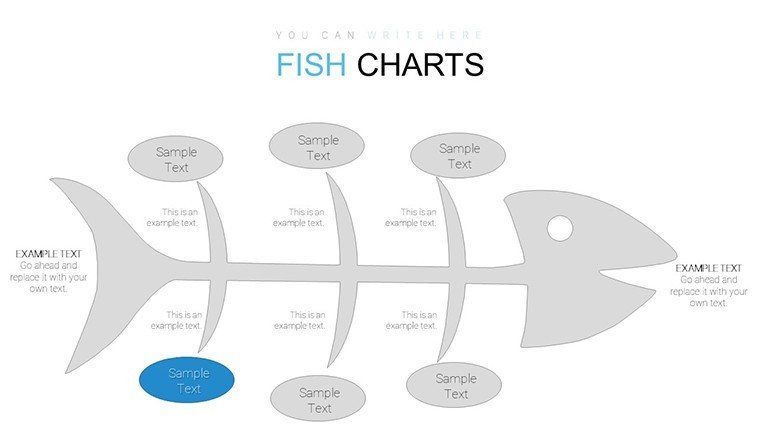
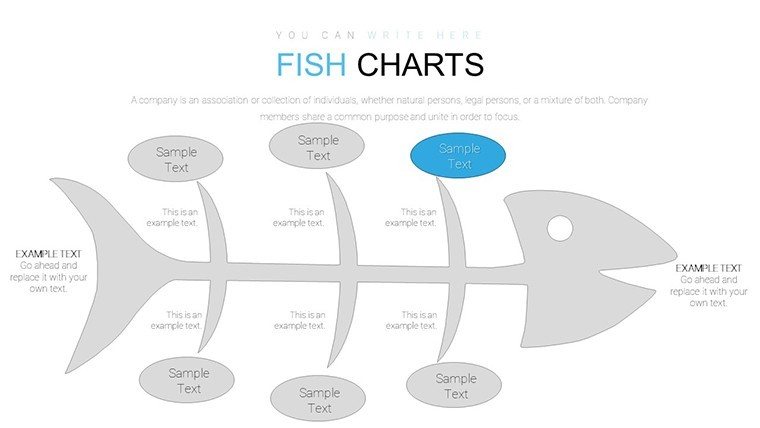
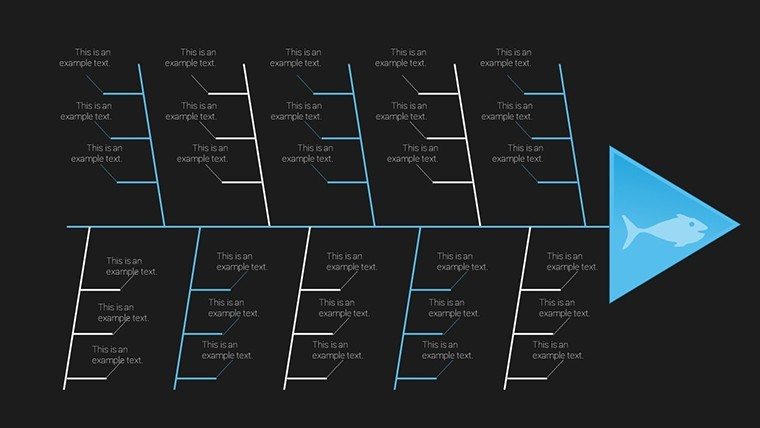
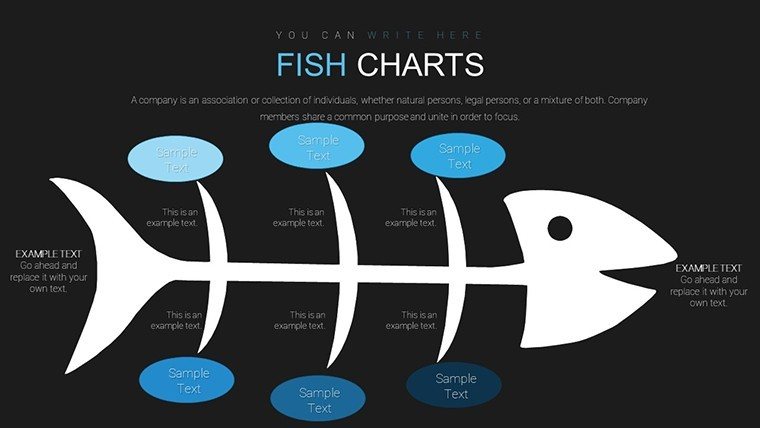
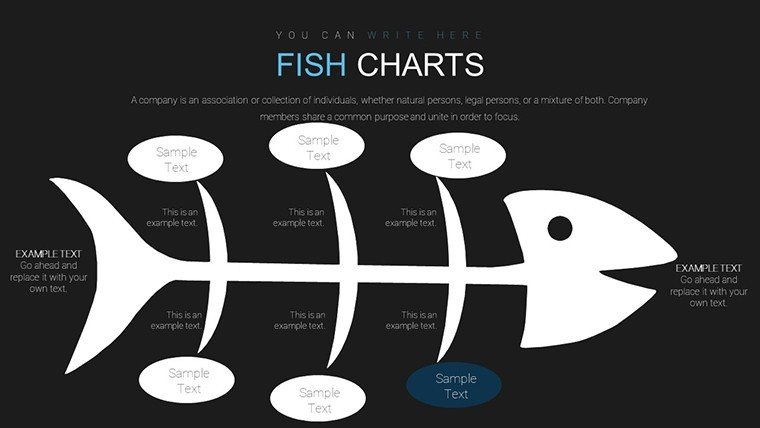
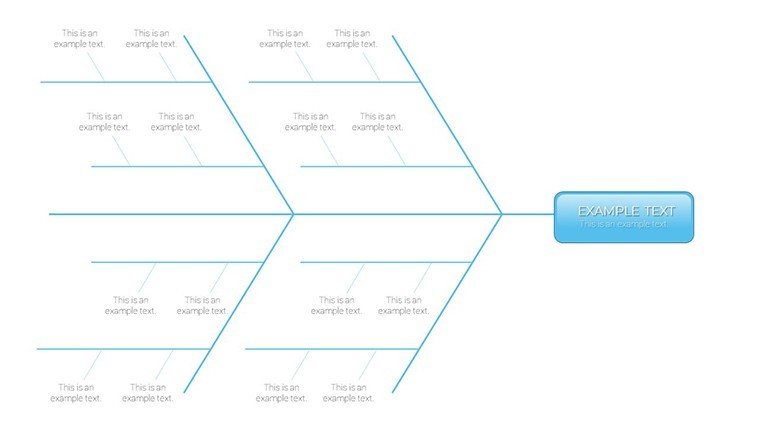
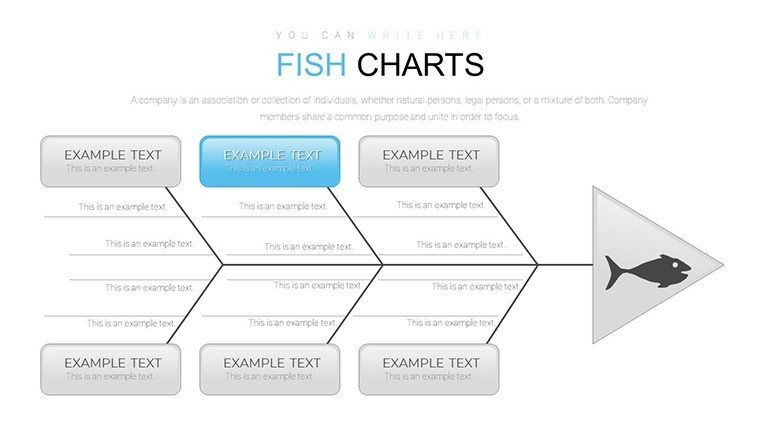
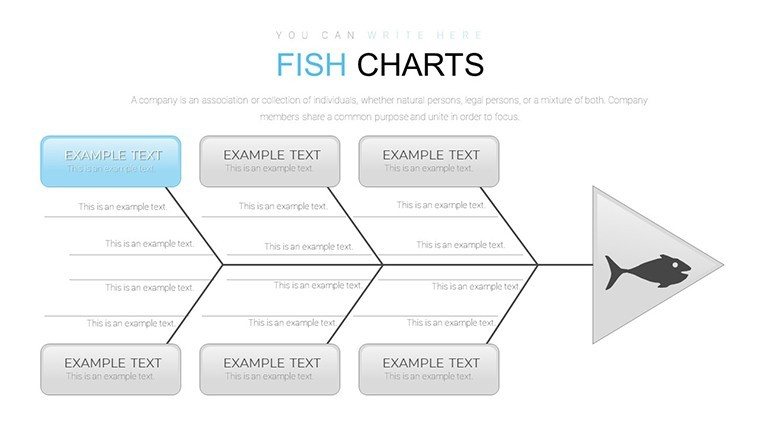
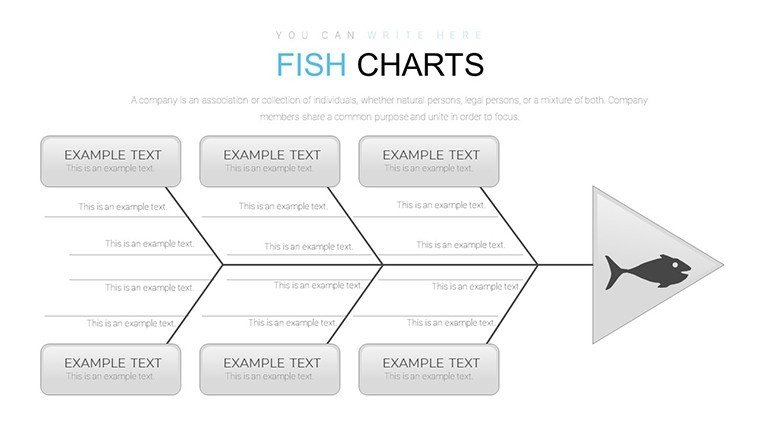
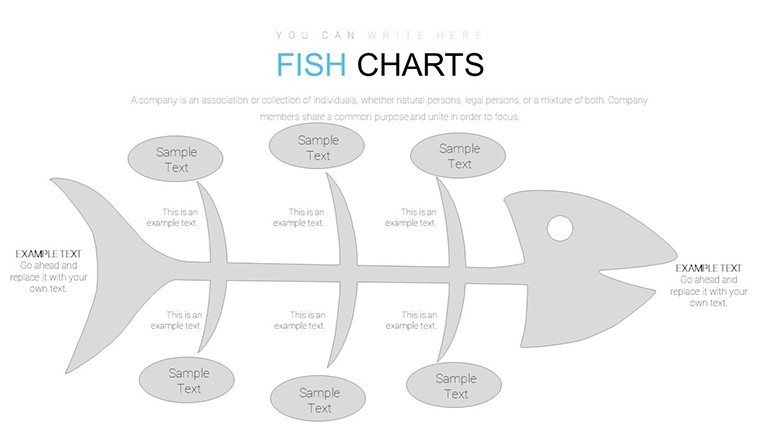
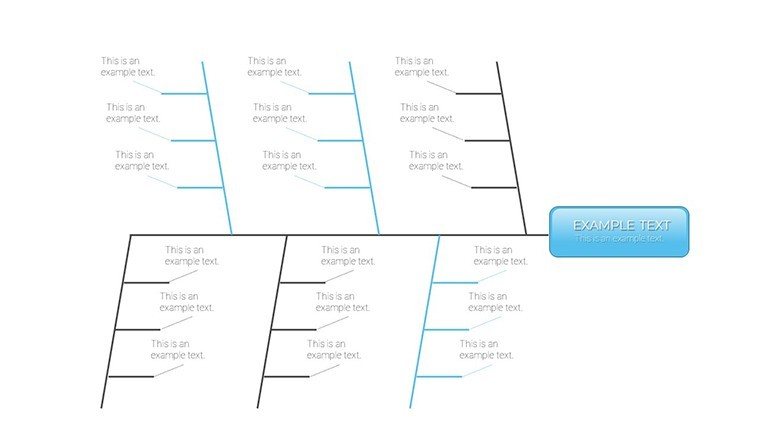
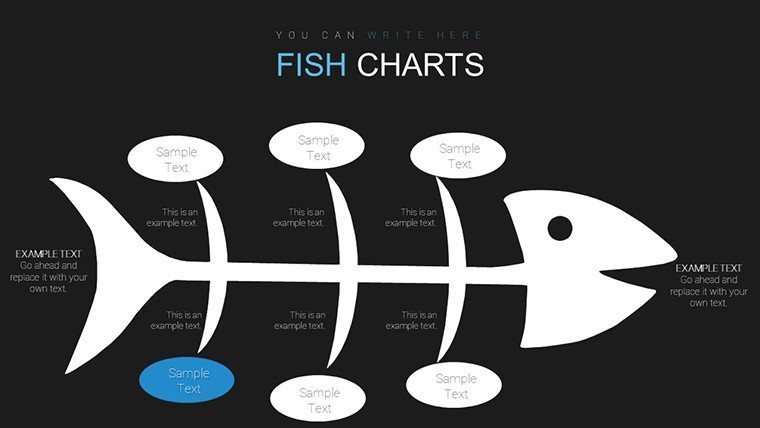
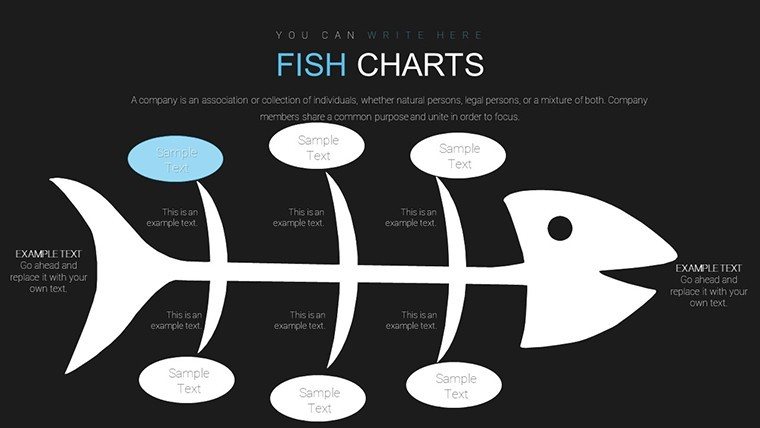
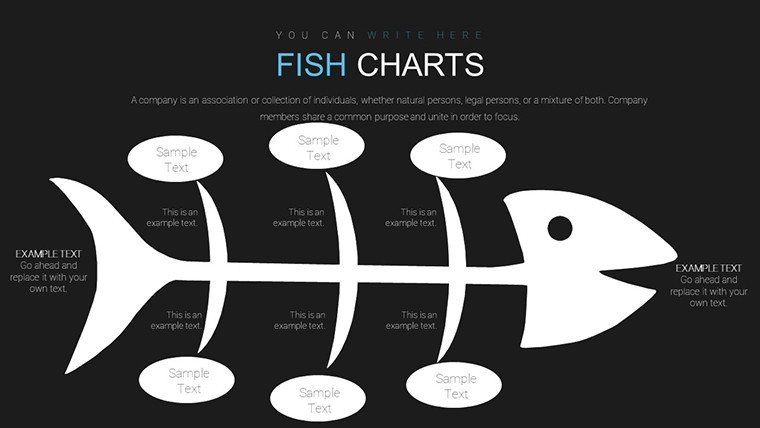
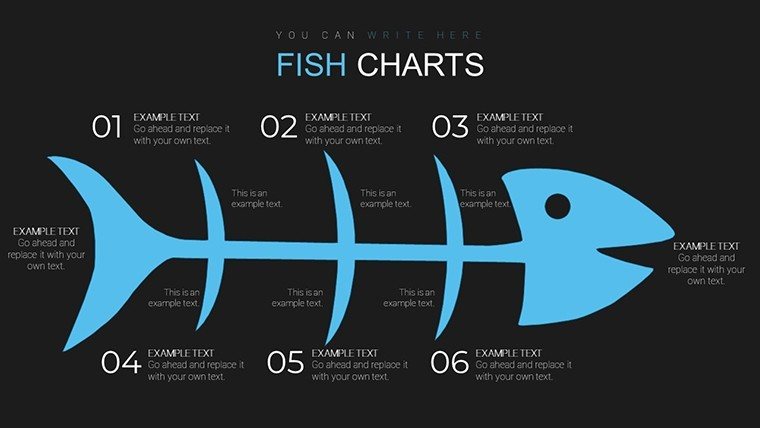
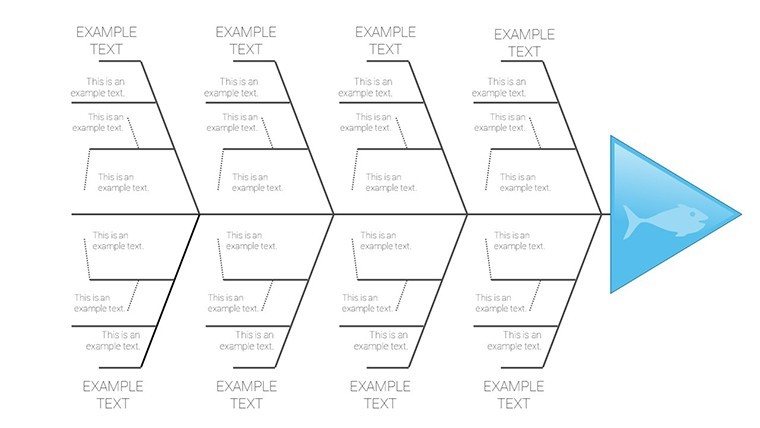
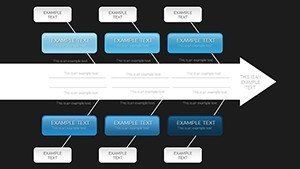
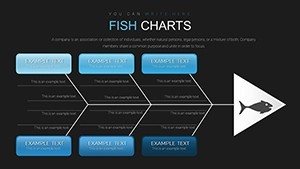
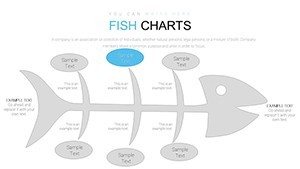
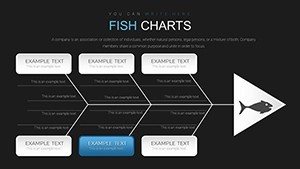
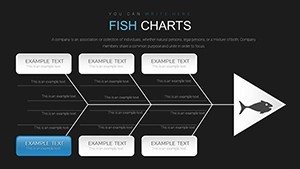
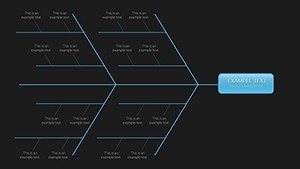
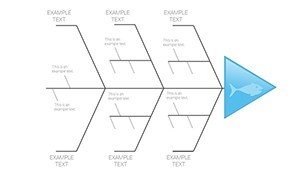
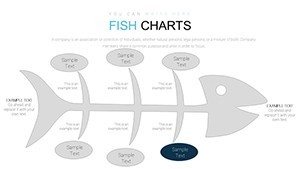
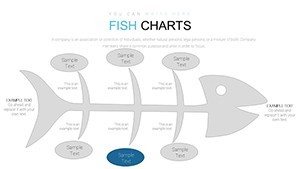
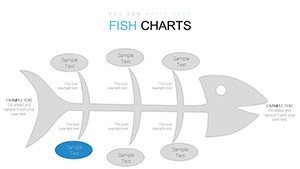
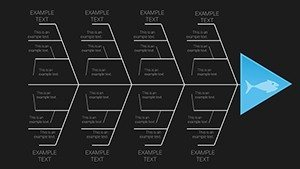
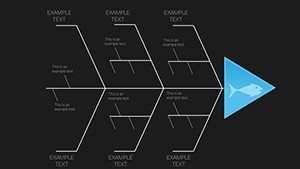
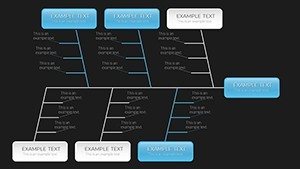
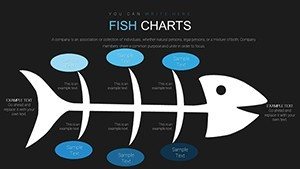
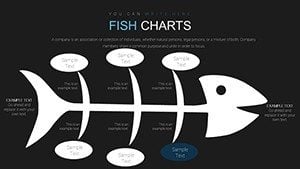
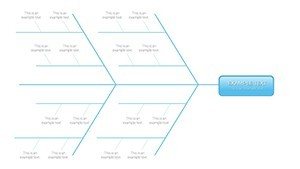
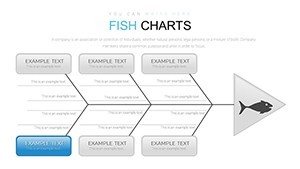
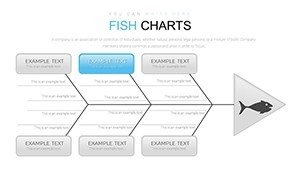
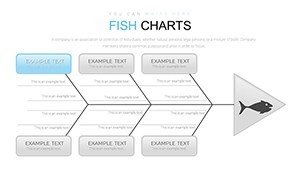
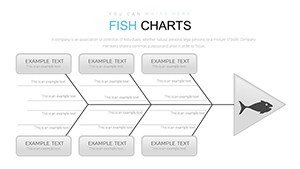
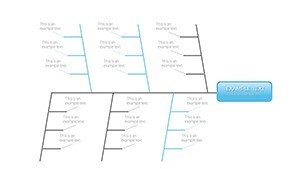
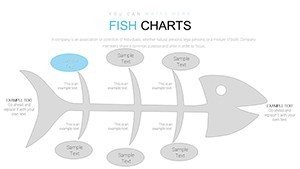
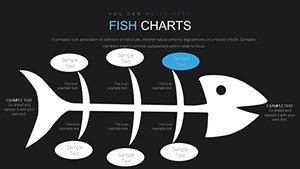
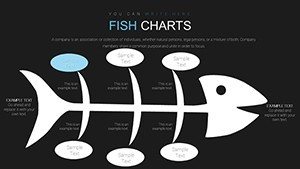
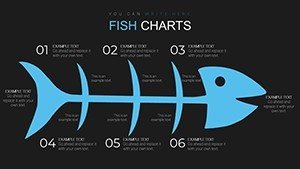
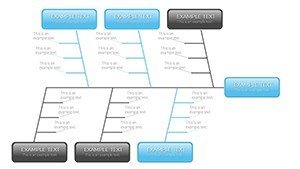
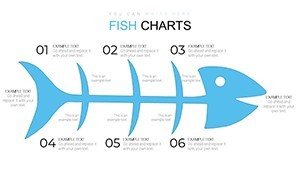
Diving deeper, the Ishikawa Fishbone Diagram categorizes potential causes into major branches - often the 4Ms (Man, Machine, Material, Method) or customized to your needs, such as Environment or Measurement in technical fields. Our template offers versatile layouts, from basic skeletons to intricate multi-level branches, ensuring adaptability across industries. For architects, picture mapping out delays in urban planning: environmental regulations as one bone, supplier issues as another, leading to informed solutions that prevent future pitfalls.
Each of the 48 slides is crafted with professional-grade visuals - crisp lines, thematic colors, and scalable icons that maintain quality even when projected in large conference rooms. Unlike starting from scratch in basic PowerPoint, which can consume hours, this pre-built resource lets you focus on content. Add text, adjust hierarchies, or incorporate data points effortlessly. Real-world applications shine in case studies, like a firm using it to analyze sustainable building material failures, aligning with LEED certification processes for greener outcomes.
Key Features That Set This Template Apart
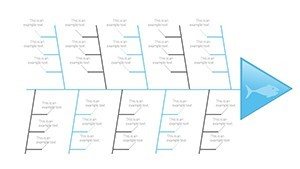
- Customizable Branches: Expand or contract categories to fit your analysis depth, ideal for complex scenarios like architectural design flaws.
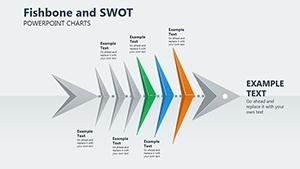
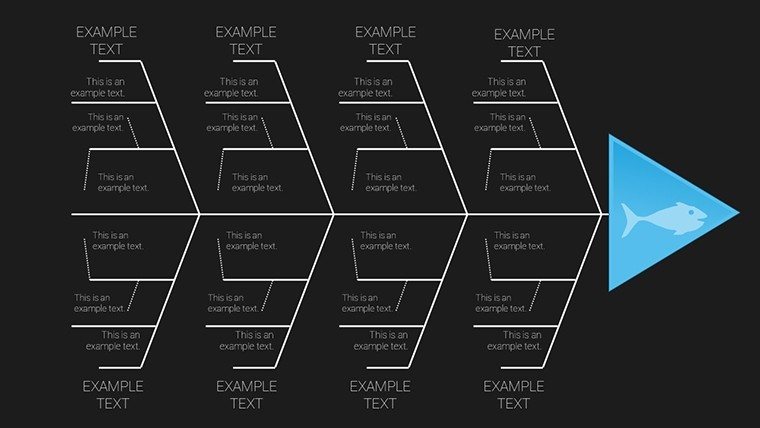
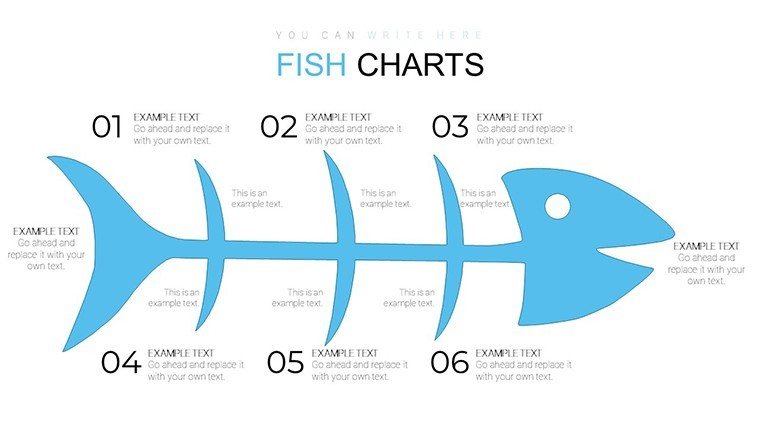
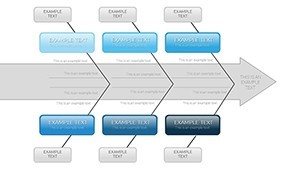
- Professional Visuals: High-impact graphics that engage audiences, with options for 2D or subtle 3D effects to highlight key causes.
- User-Friendly Editing: No advanced skills needed - intuitive interface supports quick modifications, compatible with PowerPoint 2016 and later versions.
- Versatile Applications: From healthcare diagnostics to educational case studies, but especially potent in architecture for project post-mortems.
- Integrated Guidelines: Built-in tips and examples accelerate your workflow, ensuring every presentation adheres to best practices.
Beyond features, the benefits are tangible. Teams report 30% faster resolution times when using visual aids like this, drawing from methodologies endorsed by quality experts. In architecture, where projects involve multifaceted stakeholders, this template facilitates clear communication, turning abstract problems into actionable plans. Consider a scenario in high-rise development: categorizing causes of structural inefficiencies leads to optimized designs, potentially saving thousands in revisions.
Real-World Applications and Use Cases
Let's explore targeted workflows. Start by defining the problem at the fish head - say, "Delayed Project Timeline" for an architectural firm. Branch into categories: under "People," list skill gaps; under "Processes," note approval bottlenecks. Populate with data from site reports, then prioritize using color-coding. Present to clients with animated reveals for emphasis, making your pitch not just informative but persuasive.
Compared to standard PowerPoint tools, which offer rigid shapes, our template's themed icons - gears for machinery, blueprints for methods - add contextual relevance. For educators teaching AIA-compliant project management, incorporate student exercises on hypothetical builds, fostering critical thinking. Consultants might use it in workshops, demonstrating ROI through before-and-after analyses of operational issues.
Incorporate this into your daily toolkit: during team meetings, export slides to PDFs for sharing, or embed in reports. The versatility extends to hybrid formats, working flawlessly on Google Slides with minor adjustments. Users praise its role in elevating pitches, like securing funding for eco-friendly designs by clearly outlining risk factors and mitigations.
Step-by-Step Guide to Maximizing Your Template
- Open the .pptx file in PowerPoint and select a base layout.
- Input your main problem and brainstorm branches collaboratively.
- Customize visuals - change colors to align with your firm's palette, inspired by modern architectural trends like minimalist blues and grays.
- Add data evidence, such as stats from industry reports, to bolster credibility.
- Rehearse the presentation, using transitions to build suspense in revealing causes.
- Download updates or related templates for expanded libraries.
This approach not only solves immediate issues but builds a culture of proactive analysis. In fields like architecture, where innovation meets regulation, such tools are indispensable for staying ahead.
Elevate Your Analytical Edge Today
Why settle for guesswork when precision is at your fingertips? Our Ishikawa Fishbone Template isn't merely slides - it's a gateway to smarter strategies. Professionals who've integrated it into their workflows, from boutique design studios to large engineering firms, attest to its transformative power. Ready to dissect problems with surgical accuracy? Customize your analysis now and drive meaningful change.
Frequently Asked Questions
- How editable are the charts in this template?
- Fully editable - adjust branches, colors, texts, and layouts to suit your needs without restrictions.
- Is this compatible with Google Slides?
- Yes, upload the .pptx file to Google Slides for seamless use, though some advanced features may vary.
- Can I use this for non-business purposes?
- Absolutely, it's ideal for educational or personal problem-solving, like analyzing study habits.
- What if I need more than 48 slides?
- Duplicate slides easily within PowerPoint to expand your deck as required.
- Are there tutorials included?
- Yes, built-in guidelines and example diagrams provide step-by-step support.