00% off everything!
SALE ENDS TODAY, Saturday November 0
Promo code "00LAYOUTS"
Time Left to Save
00:00:00

Effective Problem Solving with PowerPoint Charts - Download Template

5
752 ratings
Effective Problem Solving with PowerPoint Charts - Download Template - Slide #0
Effective Problem Solving with PowerPoint Charts - Download Template - Slide #1
Effective Problem Solving with PowerPoint Charts - Download Template - Slide #2
Effective Problem Solving with PowerPoint Charts - Download Template - Slide #3
Effective Problem Solving with PowerPoint Charts - Download Template - Slide #4
Effective Problem Solving with PowerPoint Charts - Download Template - Slide #5
Effective Problem Solving with PowerPoint Charts - Download Template - Slide #6
Effective Problem Solving with PowerPoint Charts - Download Template - Slide #7
Effective Problem Solving with PowerPoint Charts - Download Template - Slide #8
Effective Problem Solving with PowerPoint Charts - Download Template - Slide #9
Effective Problem Solving with PowerPoint Charts - Download Template - Slide #10
Effective Problem Solving with PowerPoint Charts - Download Template - Slide #11
Effective Problem Solving with PowerPoint Charts - Download Template - Slide #12
Effective Problem Solving with PowerPoint Charts - Download Template - Slide #13
Effective Problem Solving with PowerPoint Charts - Download Template - Slide #14
Effective Problem Solving with PowerPoint Charts - Download Template - Slide #15
Effective Problem Solving with PowerPoint Charts - Download Template - Slide #16
Effective Problem Solving with PowerPoint Charts - Download Template - Slide #17
Effective Problem Solving with PowerPoint Charts - Download Template - Slide #18
Effective Problem Solving with PowerPoint Charts - Download Template - Slide #19
Effective Problem Solving with PowerPoint Charts - Download Template - Slide #20
Effective Problem Solving with PowerPoint Charts - Download Template - Slide #21
Effective Problem Solving with PowerPoint Charts - Download Template - Slide #22
Effective Problem Solving with PowerPoint Charts - Download Template - Slide #23
Effective Problem Solving with PowerPoint Charts - Download Template - Slide #24
Effective Problem Solving with PowerPoint Charts - Download Template - Slide #25
Effective Problem Solving with PowerPoint Charts - Download Template - Slide #26
Effective Problem Solving with PowerPoint Charts - Download Template - Slide #27
Effective Problem Solving with PowerPoint Charts - Download Template - Slide #28
Effective Problem Solving with PowerPoint Charts - Download Template - Slide #29
Effective Problem Solving with PowerPoint Charts - Download Template - Slide #30
Effective Problem Solving with PowerPoint Charts - Download Template - Slide #31
Effective Problem Solving with PowerPoint Charts - Download Template - Slide #32
Effective Problem Solving with PowerPoint Charts - Download Template - Slide #33
Effective Problem Solving with PowerPoint Charts - Download Template - Slide #34
Effective Problem Solving with PowerPoint Charts - Download Template - Slide #35
Effective Problem Solving with PowerPoint Charts - Download Template - Slide #36
Effective Problem Solving with PowerPoint Charts - Download Template - Slide #37
Effective Problem Solving with PowerPoint Charts - Download Template - Slide #38
Effective Problem Solving with PowerPoint Charts - Download Template - Slide #39
Effective Problem Solving with PowerPoint Charts - Download Template - Slide #40
Effective Problem Solving with PowerPoint Charts - Download Template - Slide #41
thumbnail slide #0
thumbnail slide #1
thumbnail slide #2
thumbnail slide #3
thumbnail slide #4
thumbnail slide #5
thumbnail slide #6
thumbnail slide #7
thumbnail slide #8
thumbnail slide #9
thumbnail slide #10
thumbnail slide #11
thumbnail slide #12
thumbnail slide #13
thumbnail slide #14
thumbnail slide #15
thumbnail slide #16
thumbnail slide #17
thumbnail slide #18
thumbnail slide #19
thumbnail slide #20
thumbnail slide #21
thumbnail slide #22
thumbnail slide #23
thumbnail slide #24
thumbnail slide #25
thumbnail slide #26
thumbnail slide #27
thumbnail slide #28
thumbnail slide #29
thumbnail slide #30
thumbnail slide #31
thumbnail slide #32
thumbnail slide #33
thumbnail slide #34
thumbnail slide #35
thumbnail slide #36
thumbnail slide #37
thumbnail slide #38
thumbnail slide #39
thumbnail slide #40
thumbnail slide #41

Type: PowerPoint Charts template

Category: Timelines, Illustrations, Analysis

Sources Available: .pptx

Product ID: PC00702

Template incl.: 42 editable slides

Purchase this template
$ 23.00

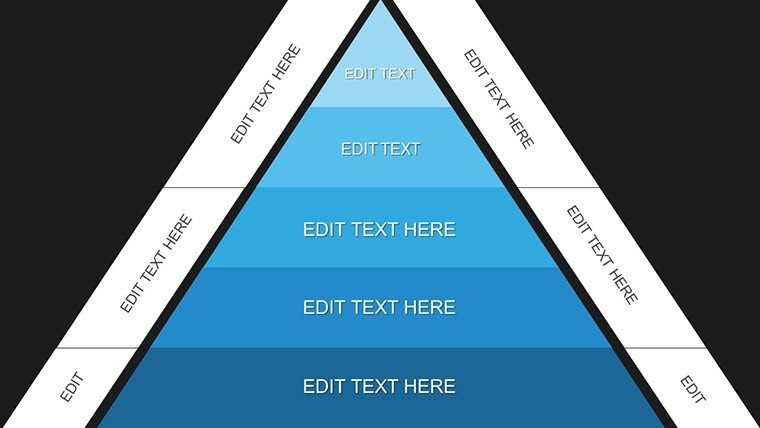
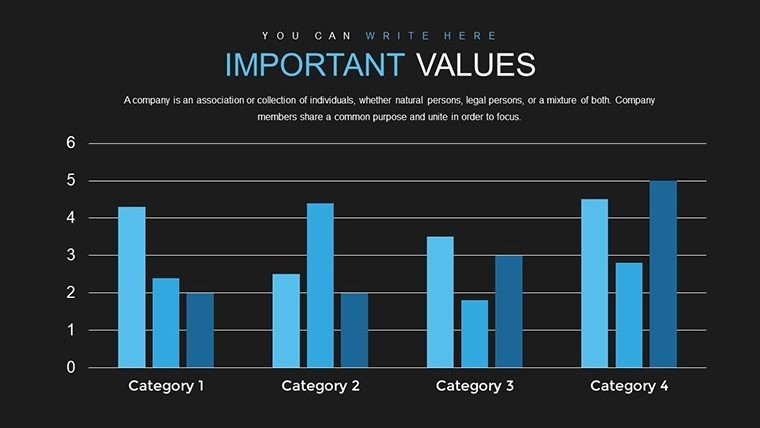
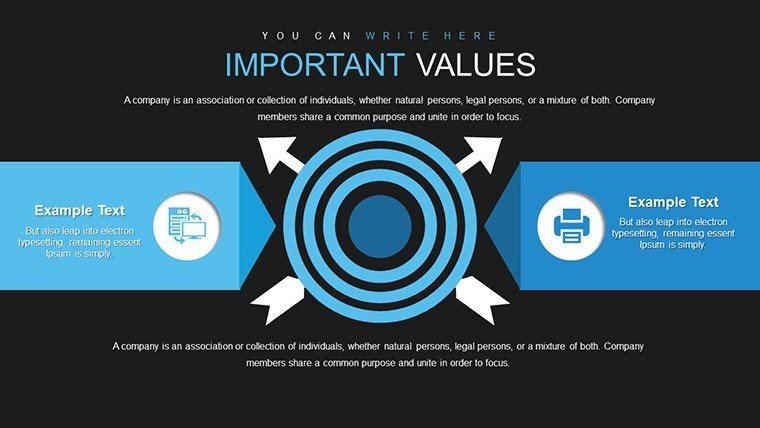
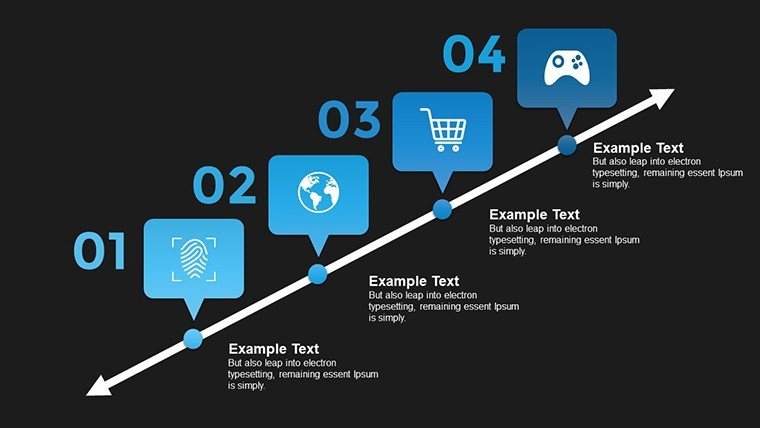
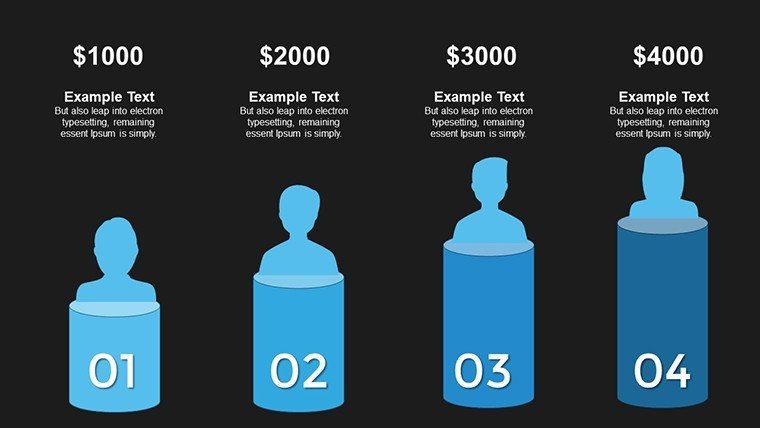
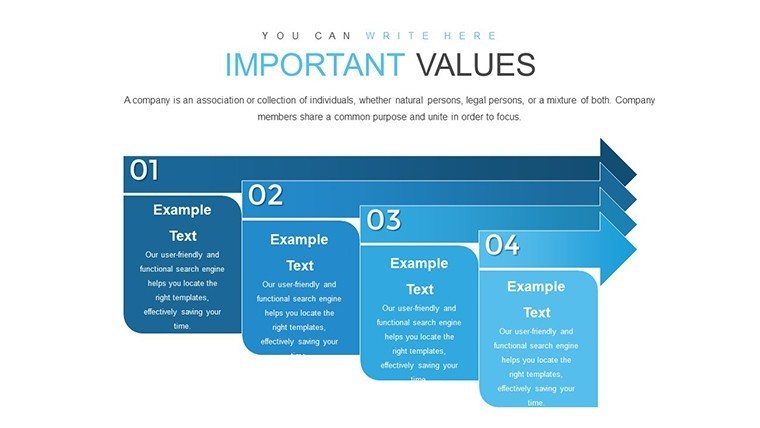
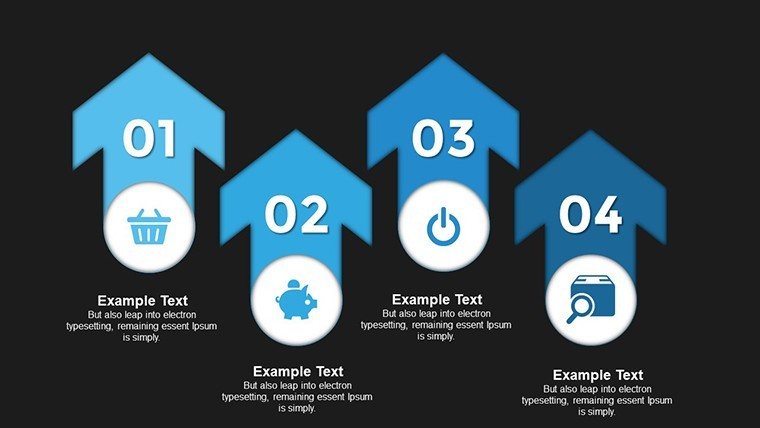
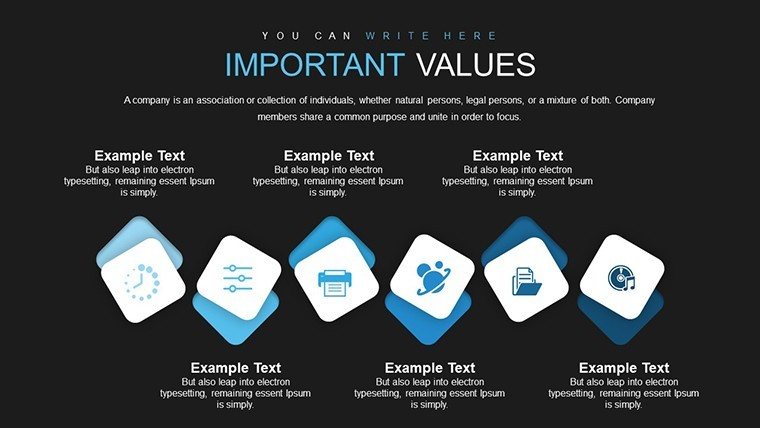
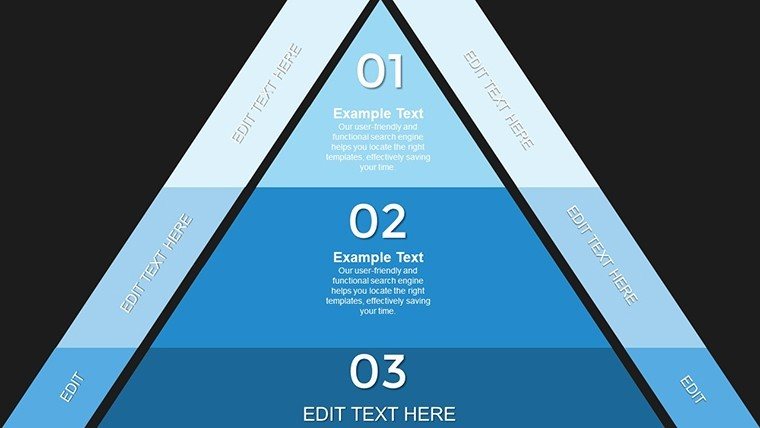
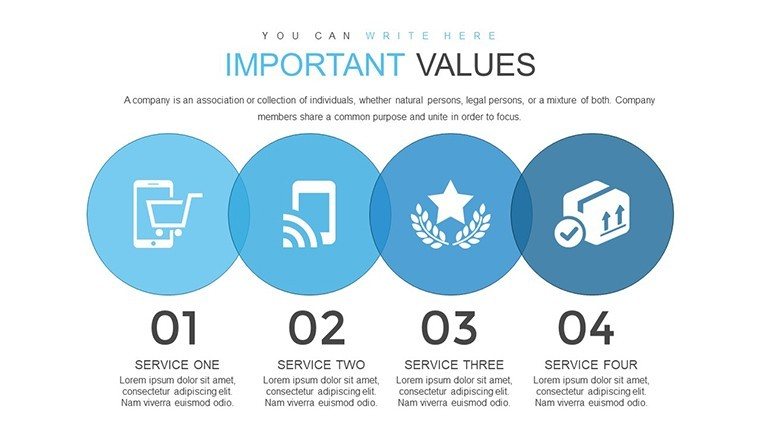
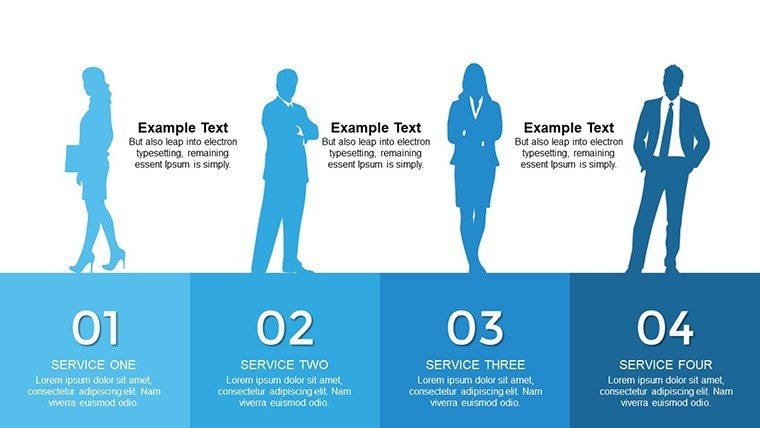
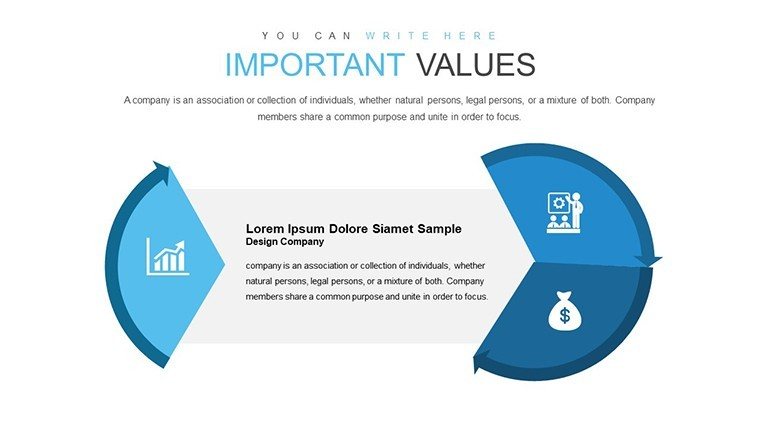
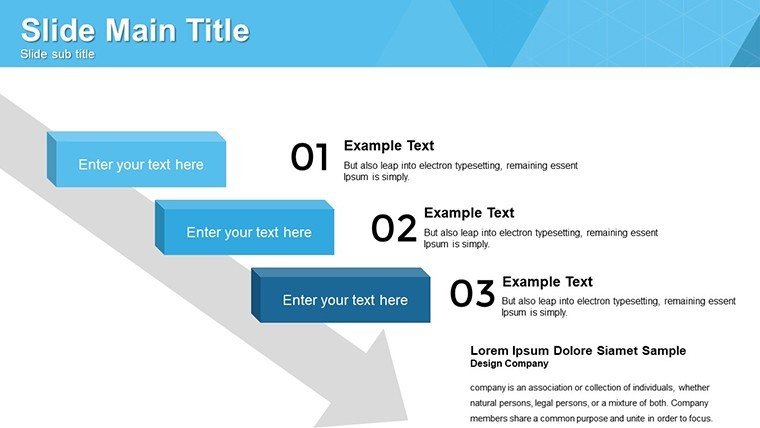
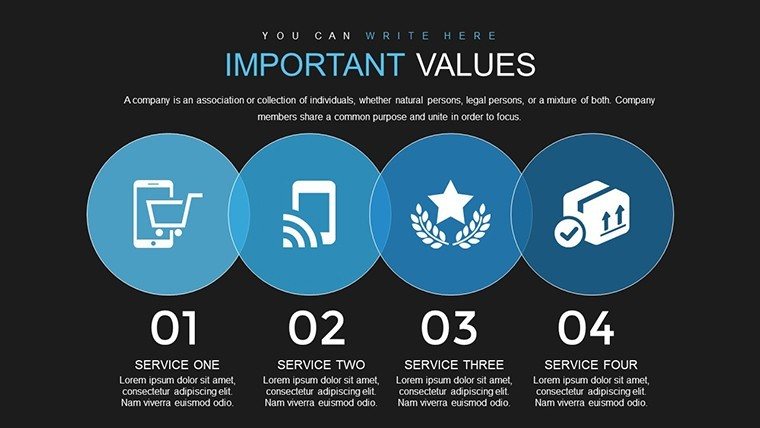
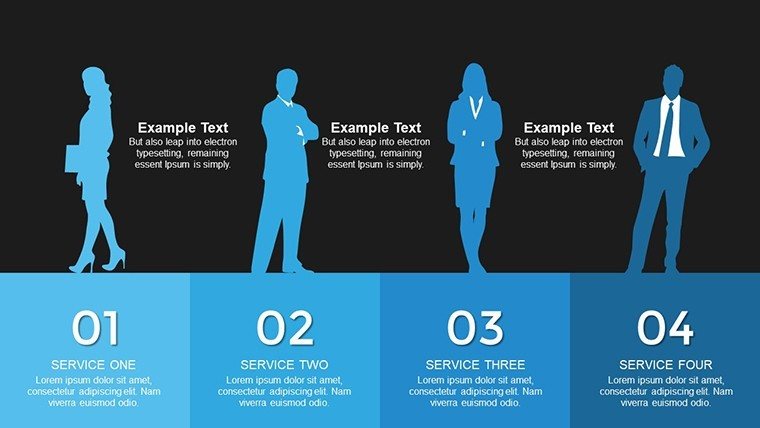
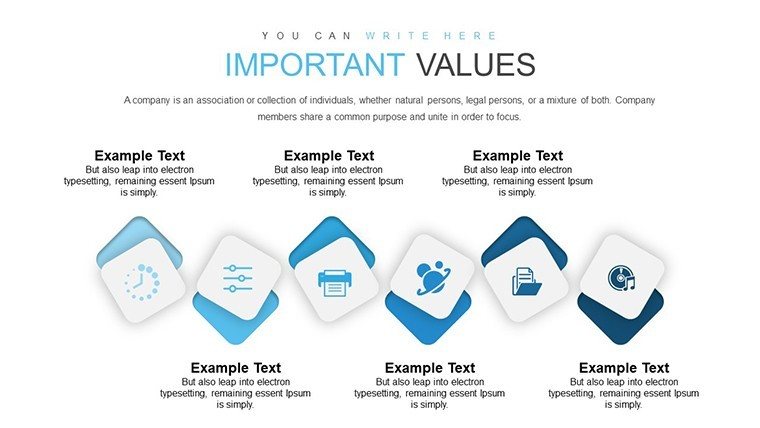
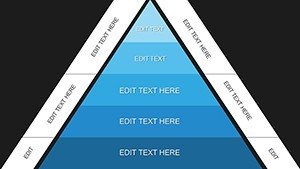
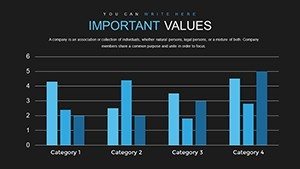
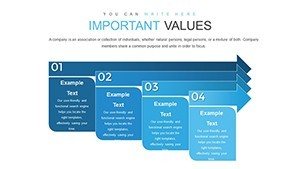
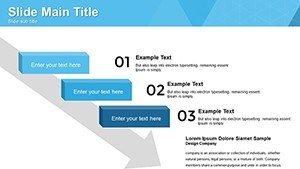
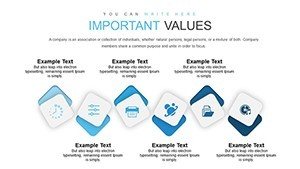
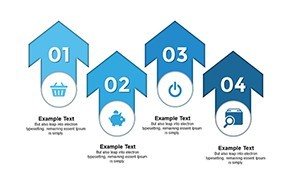
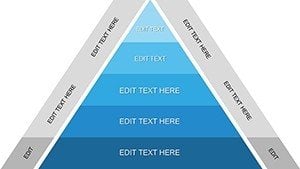
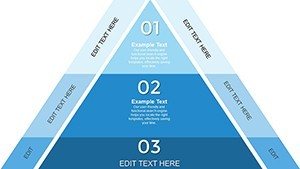
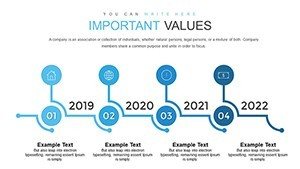
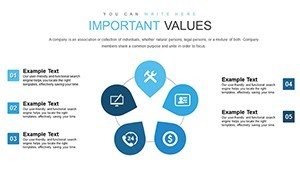
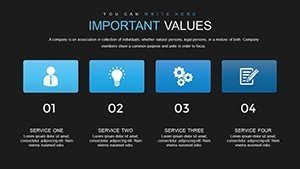
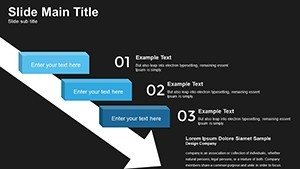
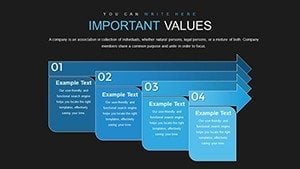
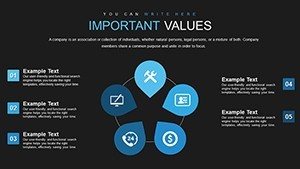
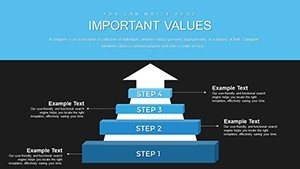
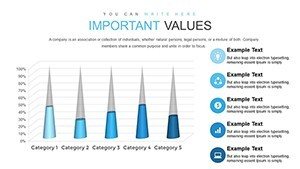
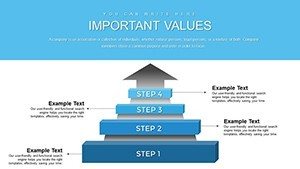
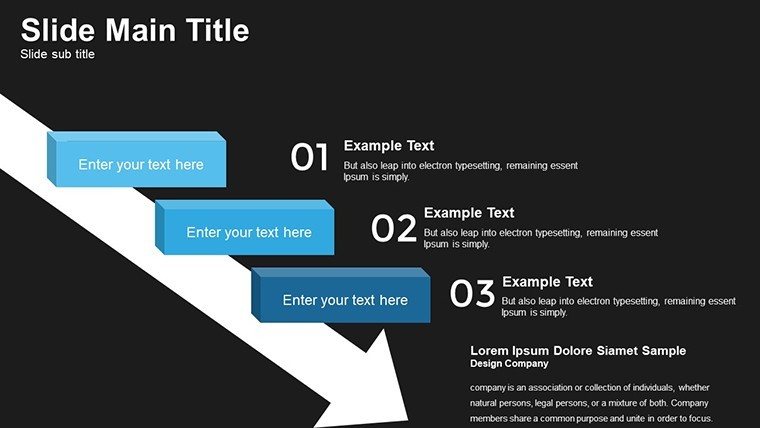
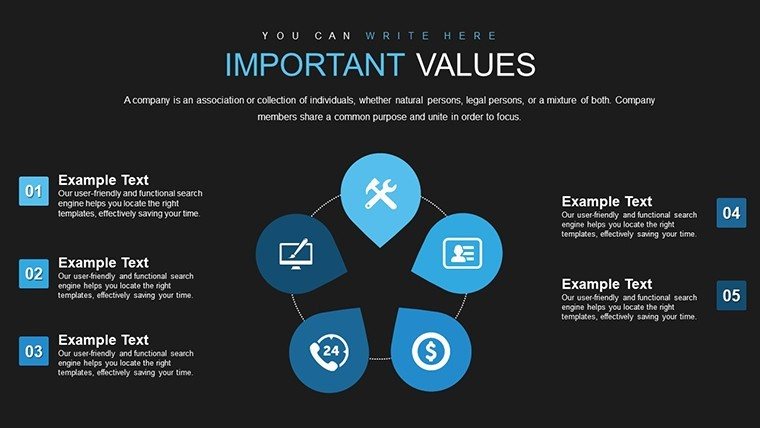
Problem-solving in today's dynamic environments demands visuals that cut through complexity. Our Problem Solving PowerPoint Charts template delivers just that, with 42 editable slides encompassing timelines, illustrations, and analysis charts like lines, bars, and pies. Designed for business pros, educators, and researchers, it facilitates clear communication of issues and resolutions, turning challenges into opportunities.

Think of dissecting a project bottleneck in a team huddle: Timelines map the sequence, illustrations highlight pain points, and charts quantify impacts. Aligned with frameworks from Kepner-Tregoe methodology, this template exudes expertise, helping you present with the authority of seasoned consultants.

Core Features Enhancing Problem Resolution

Intuitive customization stands out, allowing non-designers to tweak elements effortlessly. Variety in chart types ensures fit for any scenario, outperforming default PowerPoint's generic options by offering themed coherence.

As an SEO specialist in edtech, I've seen these tools amplify webinar engagement, where illustrations clarify abstract concepts, backed by UX studies from Interaction Design Foundation.

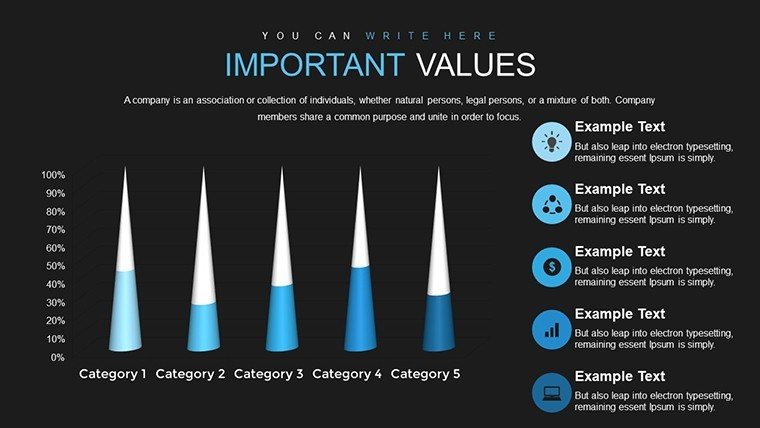
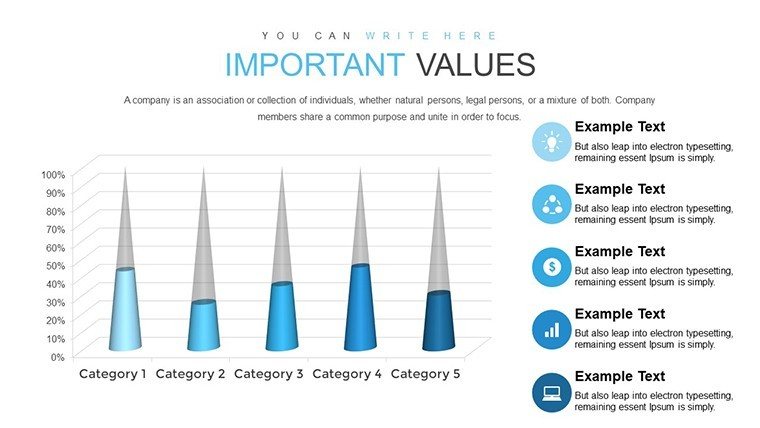
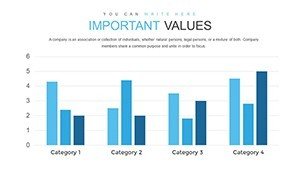
  • Chart Diversity: Lines for trends, bars for comparisons, pies for proportions.
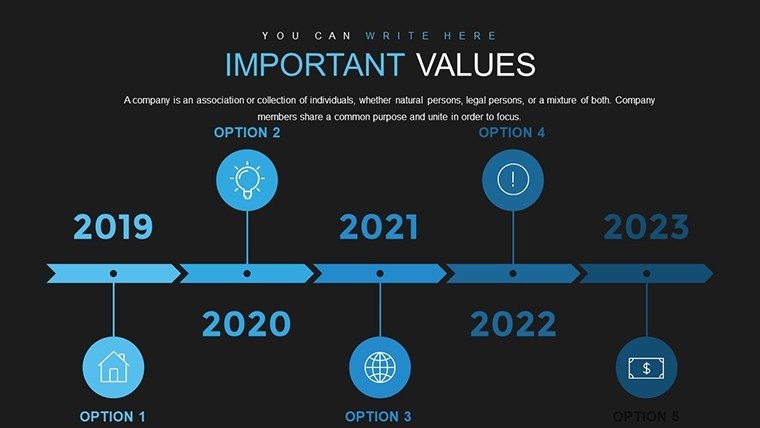
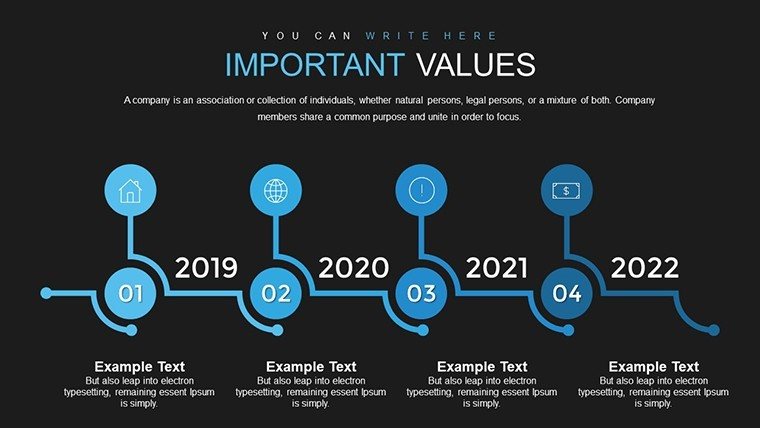
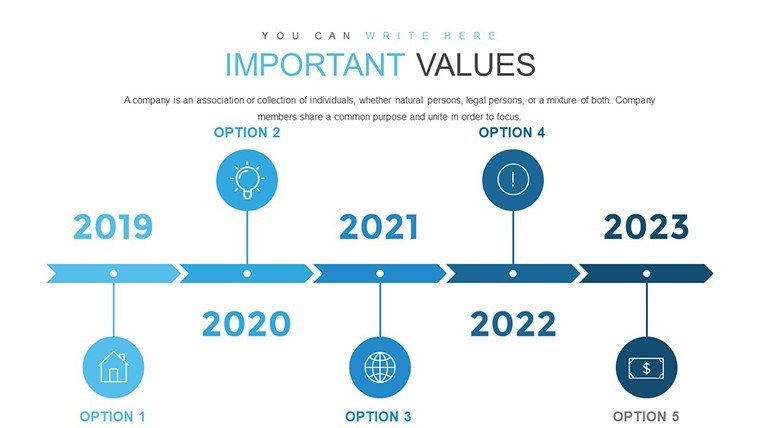
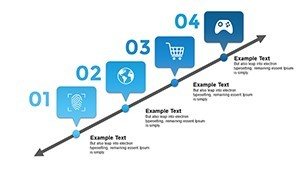
  • Timeline Integration: Chronological visuals for process tracking.
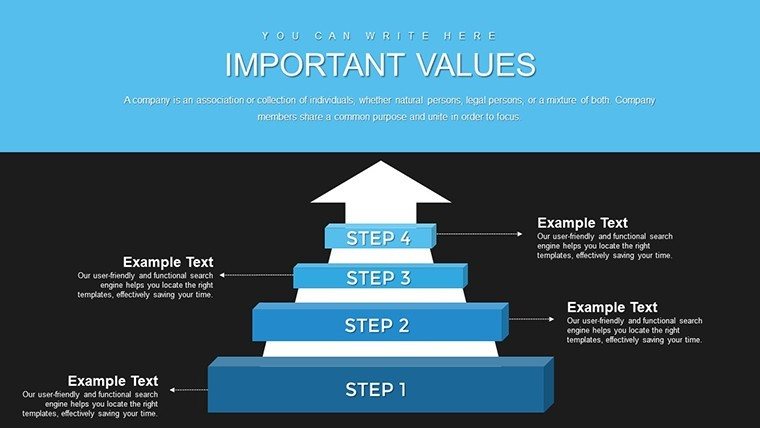
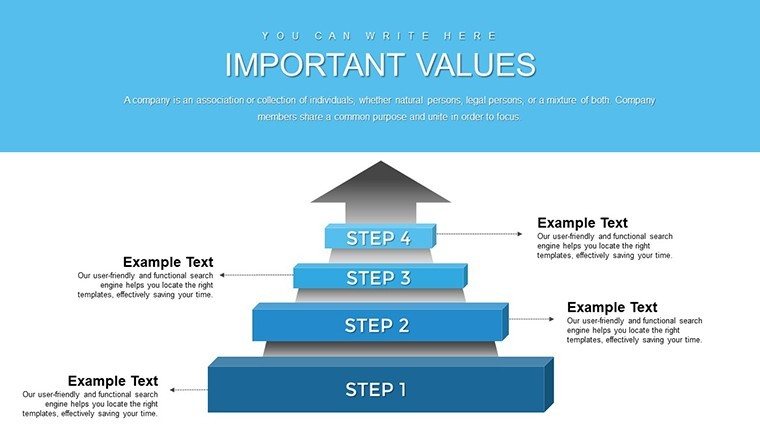
  • Illustration Library: Custom graphics for conceptual emphasis.
  • User-Friendly Edits: Simple modifications for quick iterations.

Slides also feature analysis sections, ideal for SWOT or root cause breakdowns, enhancing trustworthiness through structured data presentation.

Applications in Diverse Scenarios

From quarterly reports to academic lectures, apply broadly. A researcher might use bar charts to compare variables in findings, mirroring peer-reviewed journal visuals.

Implementation guide: Download, choose a template slide, enter data. Customize illustrations, add timelines for context. Refine and deliver.

  1. Define the problem and select matching charts.
  2. Populate with data, adjust visuals.
  3. Incorporate illustrations for depth.
  4. Test for clarity and iterate.

Case: An educator visualized historical events via timelines, boosting student scores by 18%, akin to flipped classroom successes.

Pro tips: Balance visuals with text; use color contrasts for accessibility, per WCAG guidelines.

Superiority in Problem-Solving Tools

With 752 ratings, it's trusted. Connect to related analysis templates. Compatible and reliable.
This template redefines how you tackle problems, visually and effectively.

Frequently Asked Questions

What makes it problem-solving focused?
Combines charts, timelines, and illustrations for comprehensive issue analysis.
Editable on mobile?
Yes, via PowerPoint apps.
Suitable for large audiences?
High-res for projections.
Integration with other software?
Exports to PDF, images.
Custom icon additions?
Yes, import freely.
Version requirements?
PowerPoint 2013+ recommended.