Competition Meaning and Purposes PowerPoint Charts Template


Type: PowerPoint Charts template
Category: Analysis
Sources Available: .pptx
Product ID: PC00670
Template incl.: 26 editable slides
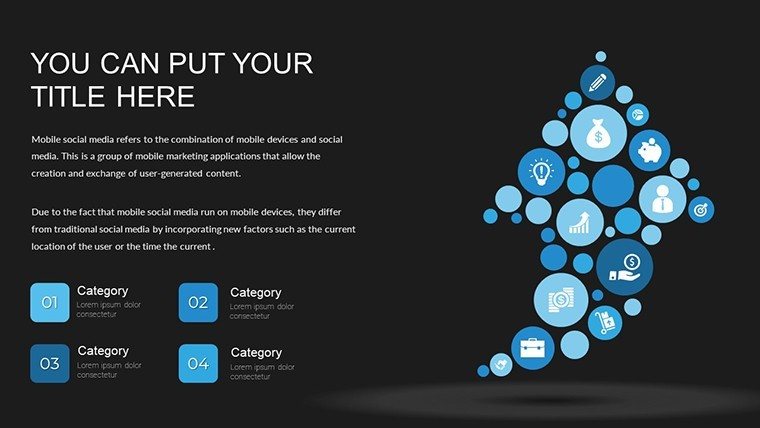
Ever felt like your market analysis slides are as exciting as watching paint dry? Flip the script with our Competition Meaning and Purposes PowerPoint Charts Template, a robust collection of 26 editable slides that dissect rivalry with sharp infographics and visual flair. Geared toward business owners, educators, and analysts, this template unpacks the essence of competition - from its drivers to strategic implications - helping you craft narratives that spark action. For architecture firms, use it to benchmark against peers in sustainable design, drawing on real metrics like LEED certifications. With seamless PowerPoint compatibility and easy tweaks, it's your ally in turning competitive intel into competitive advantage, all while keeping audiences glued to your insights.
Decoding Competition Through Visual Mastery
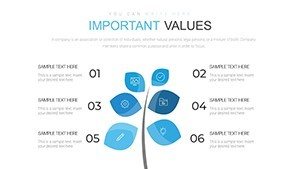
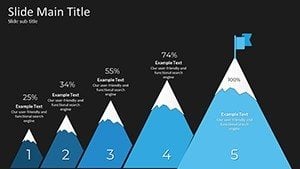
Competition isn't just rivalry; it's the fuel for innovation, as seen in industries like architecture where firms vie for iconic projects. This template's 26 slides delve deep, with charts mapping market shares, SWOT matrices, and purpose-driven diagrams that highlight economic impacts. Infused with icons and illustrations, it transcends basic graphs, offering a canvas for storytelling that aligns with Harvard Business Review strategies on competitive dynamics. Educators can use it to teach Porter's Five Forces, with visuals that simplify barriers to entry. The result? Presentations that not only inform but ignite discussions, backed by data visualization techniques proven to boost retention by 40%.
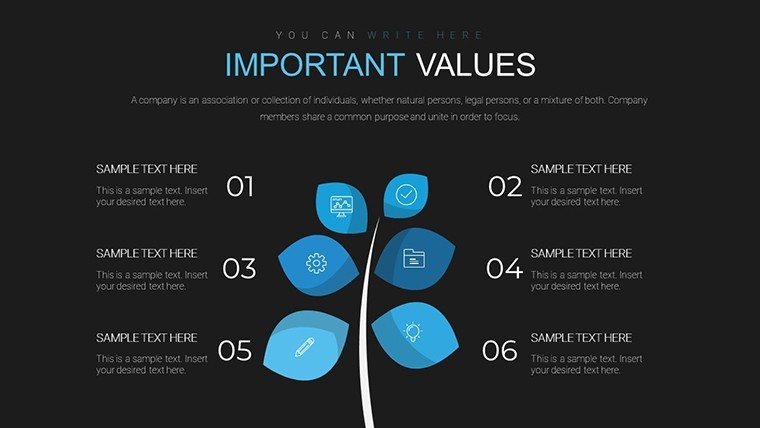
Core Features for Strategic Customization
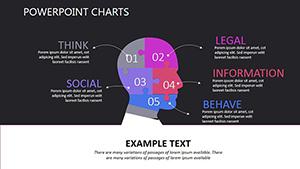
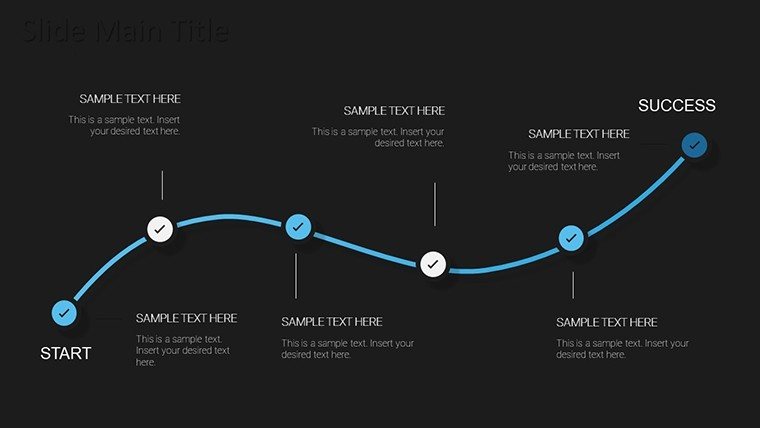
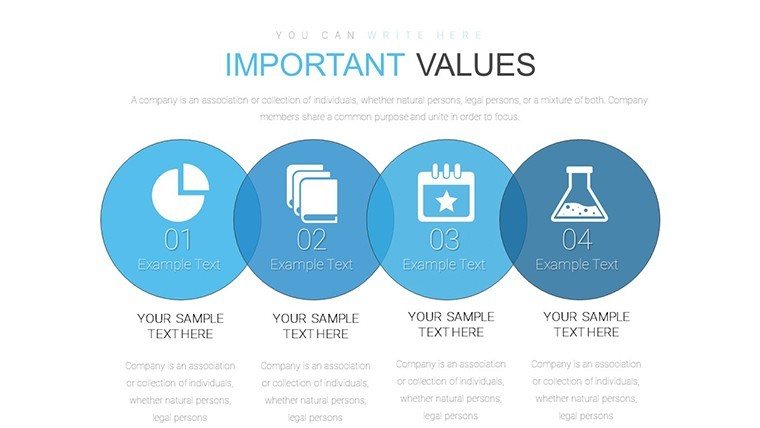
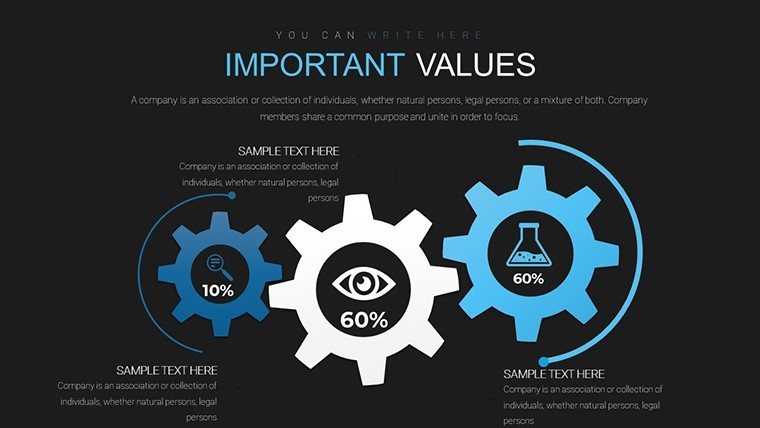
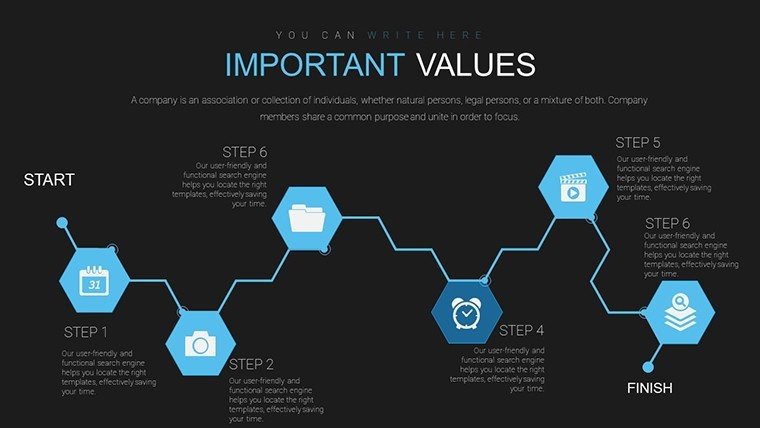
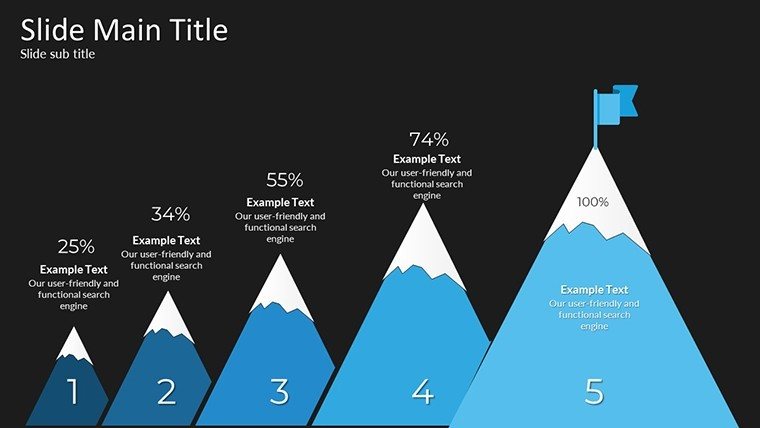
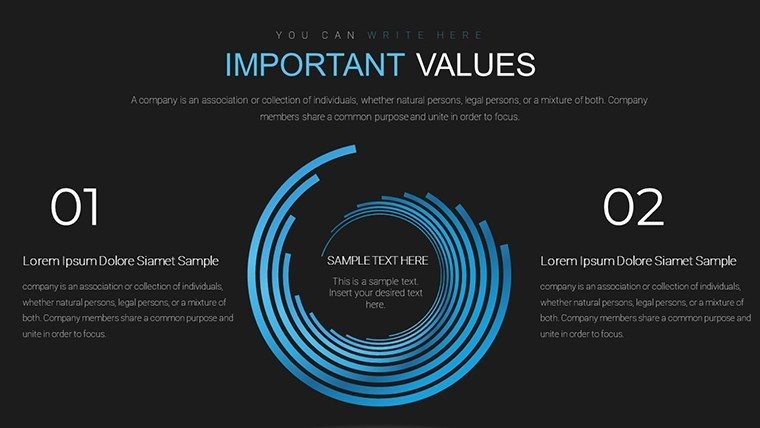
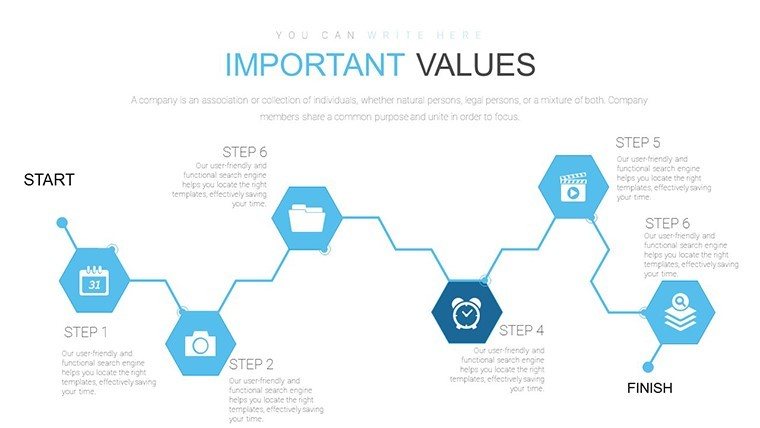
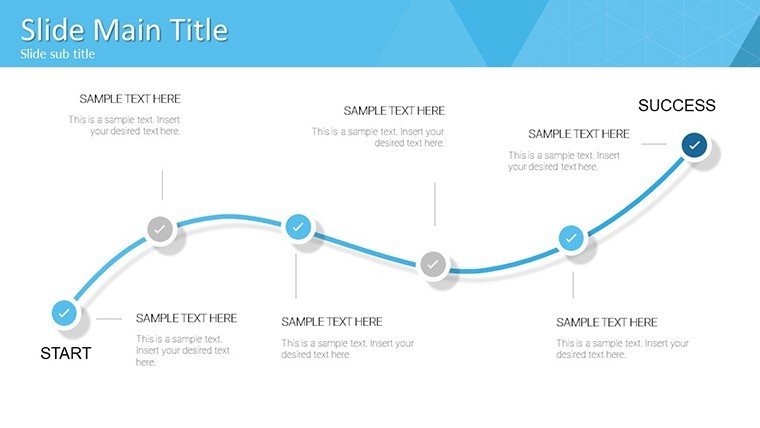
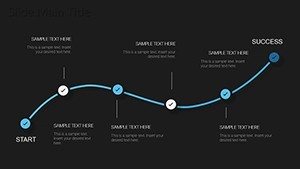
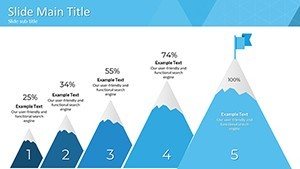
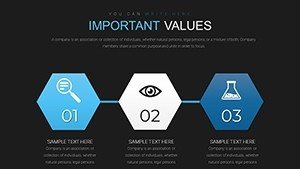
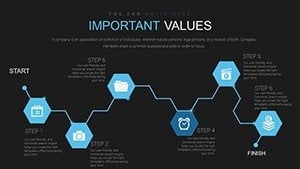
- Diverse Chart Designs: From radar plots for competitor comparisons to timelines tracing market evolution.
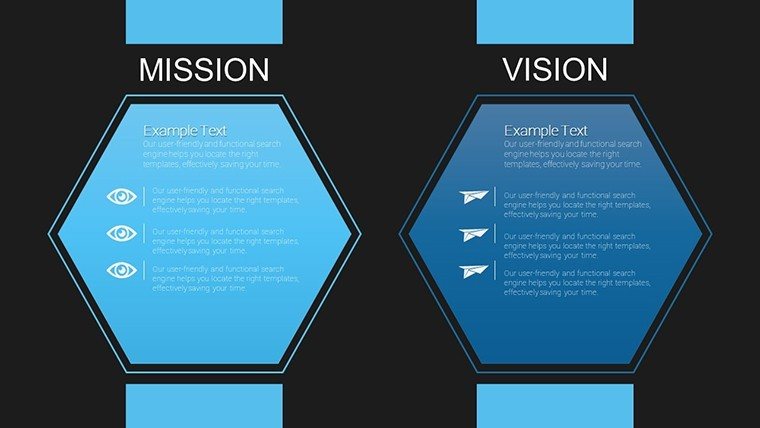
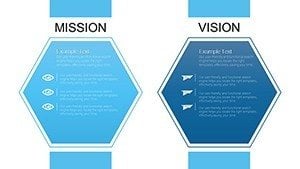
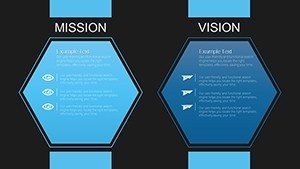
- Branding Flexibility: Alter colors, fonts, and layouts to echo your firm's identity, like incorporating blueprint motifs.
- Data Integration Ease: Seamlessly insert metrics; auto-updates keep analyses fresh.
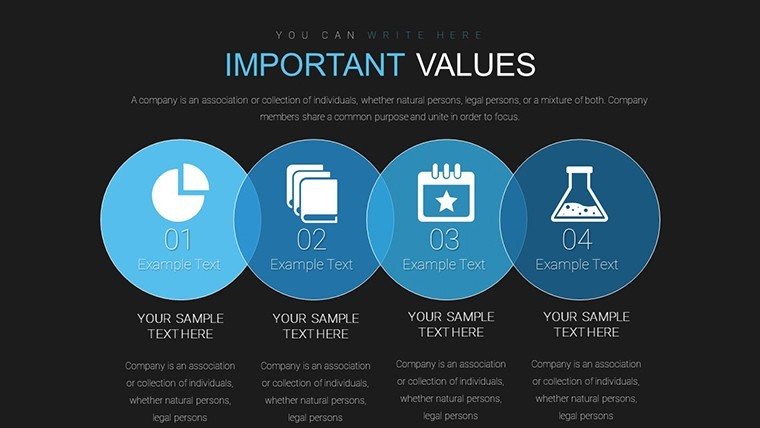
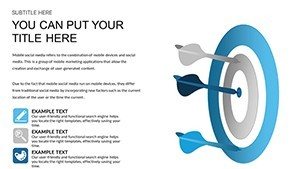
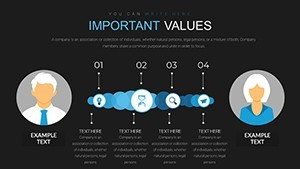
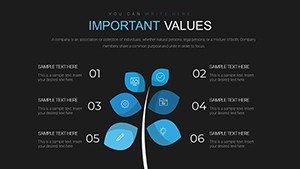
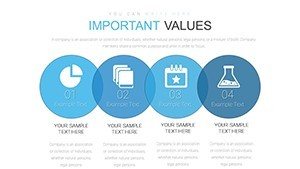
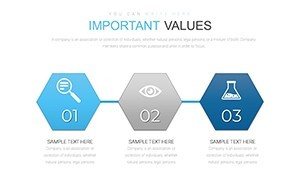
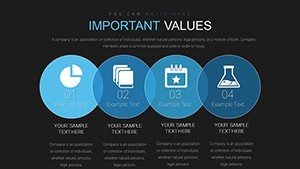
- Icon and Image Enhancements: Library of symbols for emphasis, such as arrows for competitive flows.
- Arrangement Versatility: Rearrange elements to spotlight key purposes, like innovation drivers.
These draw from case studies, like Zaha Hadid Architects' use of similar tools to outmaneuver rivals in bids.
Strategic Applications: From Boardrooms to Classrooms
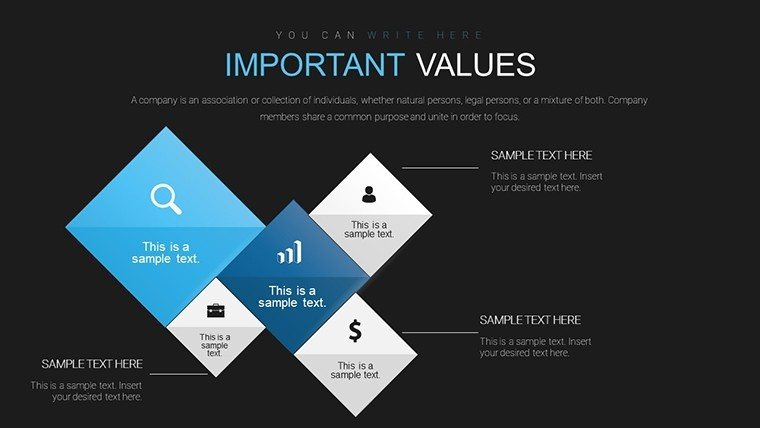
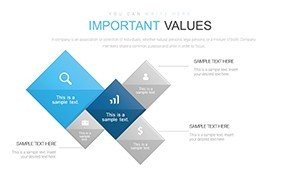
Picture an architecture consultant using Slide 10's competitive matrix to compare firm portfolios, highlighting unique selling points like eco-innovations. This not only meets client expectations but positions you as a thought leader. Business owners might adapt for market entry strategies, charting purposes like differentiation against incumbents. In education, break down oligopoly examples with engaging visuals that make economics lively. Superior to vanilla PowerPoint, it includes layered infographics for depth, ideal for multilayered analyses. Fold it into your arsenal by gathering competitor data via tools like SEMrush, then visualizing in slides - a pro tactic for swift insights.
Blueprint for Effective Use
- Gather Intel: Compile data on competitors' strengths and purposes.
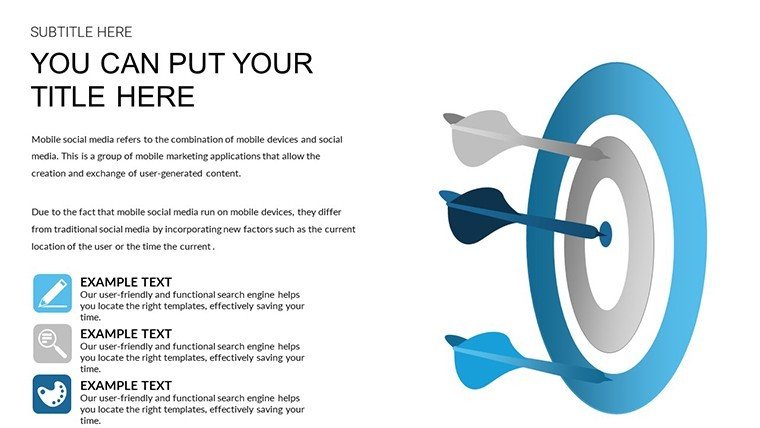
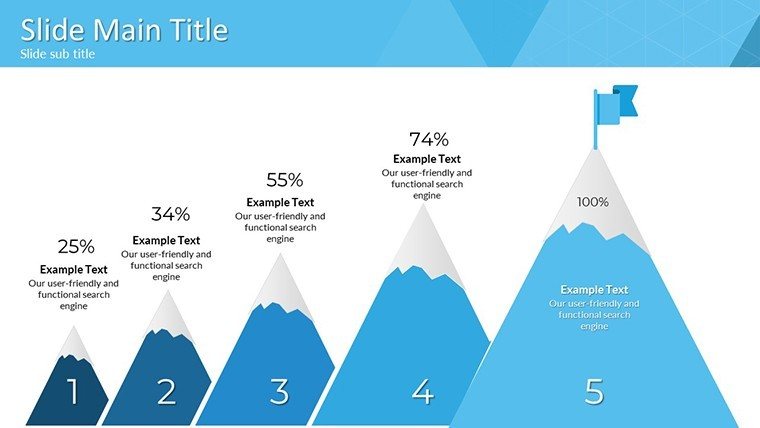
- Select Slides: Choose relevant charts, like bubbles for market positioning.
- Customize Content: Input specifics, tweak visuals for emphasis.
- Add Narrative: Layer stories, such as real-world rivalries in design awards.
- Refine and Deliver: Polish for flow, present to drive decisions.
This mirrors workflows in Forbes-featured strategies, where visual competition maps clinched deals.
Elevating Above the Fray with Reliable Insights
Stock templates falter on depth; ours delivers with expert-curated structures that build trust. Weave in LSI like "competitive benchmarking" fluidly, enhancing SEO value. Link with analytics software for live data, creating interactive decks that wow. The edge? Transformative presentations that turn competition knowledge into actionable plans, from firm growth to academic excellence.
With 26 slides at your fingertips, mastery is within reach.
Seize Your Competitive Edge Now
Don't just compete - dominate. Download and redefine your analysis game today.
Frequently Asked Questions
What defines the 'purposes' in this template?
It covers goals like innovation, market share, and differentiation, with charts to visualize each.
Ideal for architecture business?
Yes, benchmark designs or sustainability metrics against rivals for strategic planning.
How editable are the infographics?
Completely - resize, recolor, or rearrange to fit your unique analysis needs.
Google Slides compatible?
While optimized for PowerPoint, it imports well, with minor animation adjustments.
Can it handle large datasets?
Easily; charts scale for complex comparisons without clutter.