Promo code "00LAYOUTS"
Venn PowerPoint Charts: Visualize Overlaps with Ease
Type: PowerPoint Charts template
Category: Venn
Sources Available: .pptx
Product ID: PC00668
Template incl.: 28 editable slides
In the intricate world of architecture, where design elements intersect with functionality and sustainability, our Venn Diagram PowerPoint Charts Template becomes an indispensable ally. Spanning 28 editable slides, this resource is crafted for architects, planners, and educators who need to illustrate connections between concepts like urban zoning, material choices, and environmental impacts. Imagine presenting to a review board how aesthetic appeal overlaps with structural integrity in a LEED-certified building - our Venn charts make such complexities crystal clear. Compatible with PowerPoint and Google Slides, the template features high-quality, customizable diagrams that save time and amplify your message. No more struggling with basic shapes; dive into professional visuals that align with AIA guidelines for effective communication. Whether comparing project phases or stakeholder interests, this tool turns abstract ideas into tangible insights, fostering better collaboration and decision-making in your firm.
Exploring the Versatility of Venn Diagrams in Design
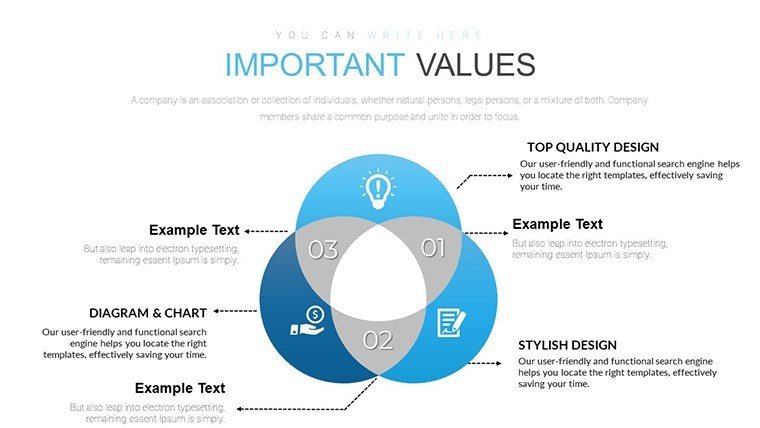
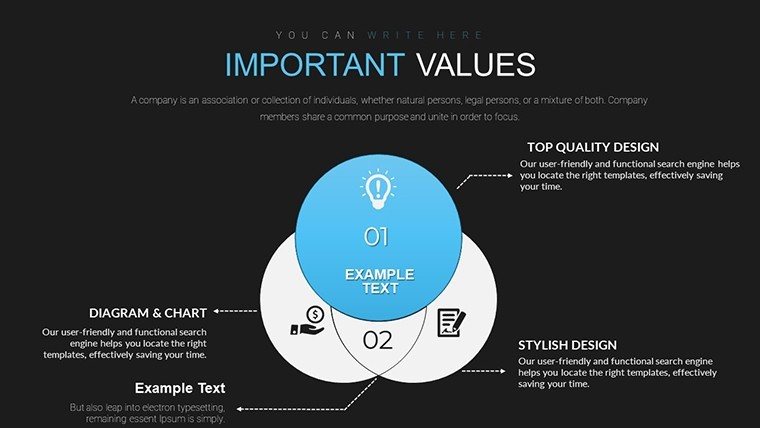
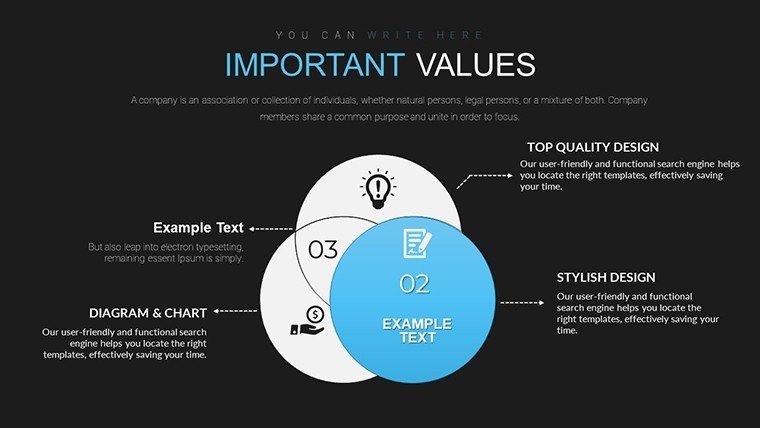
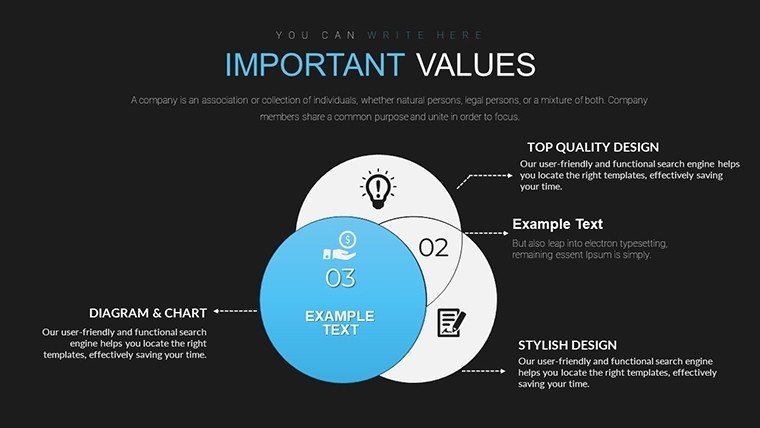
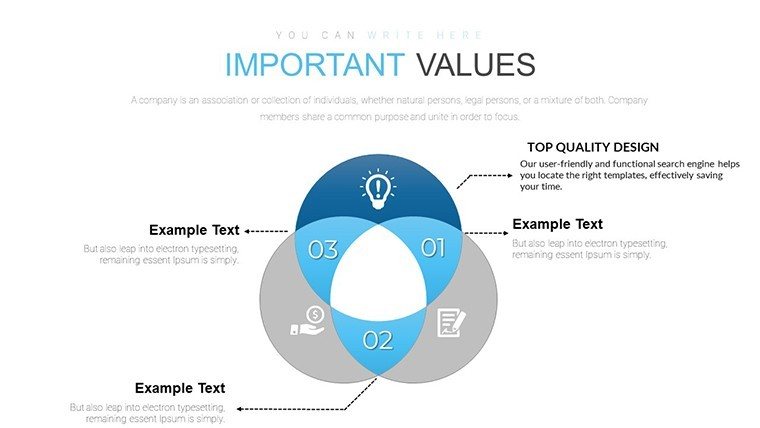
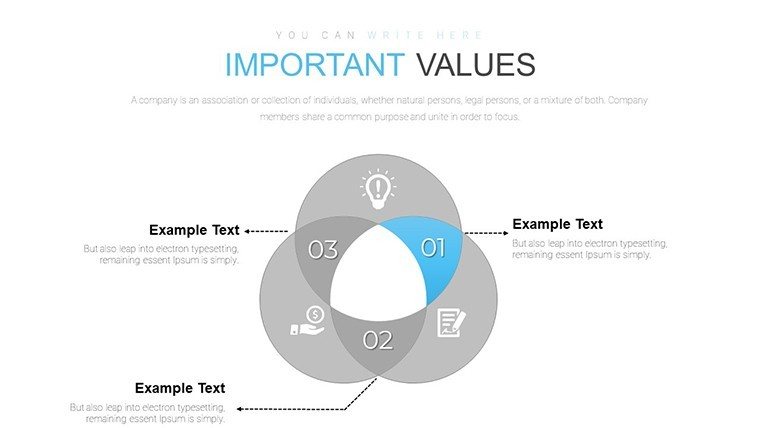
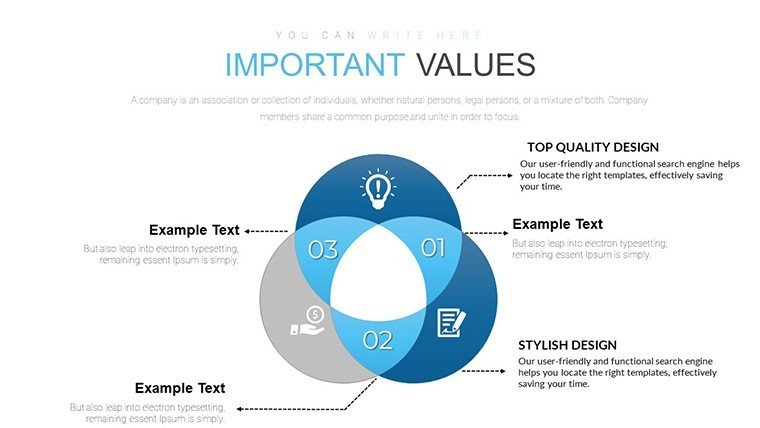
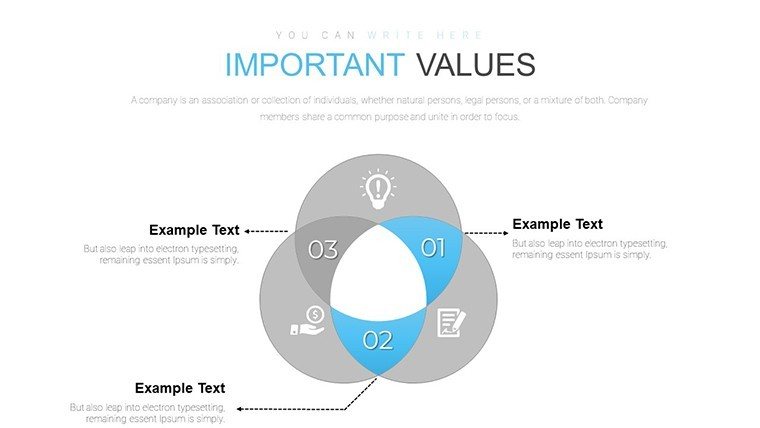
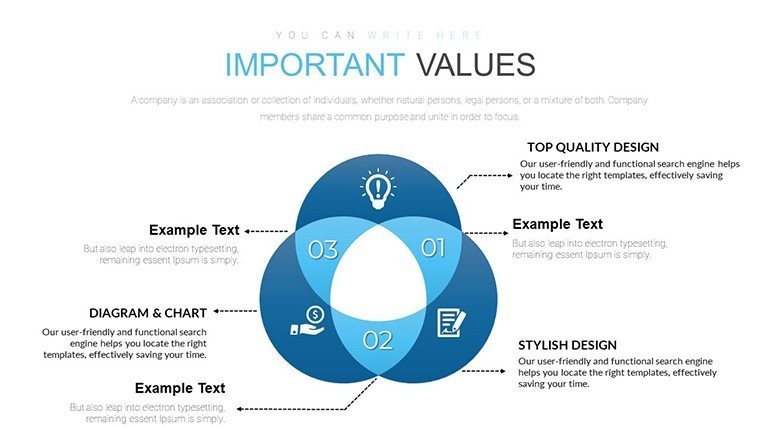
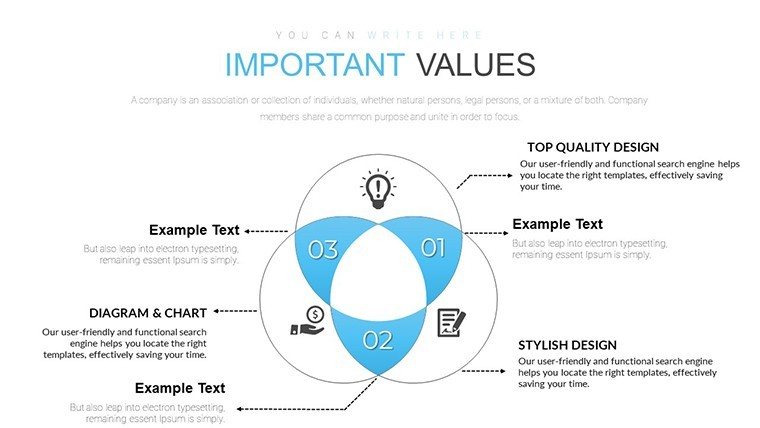
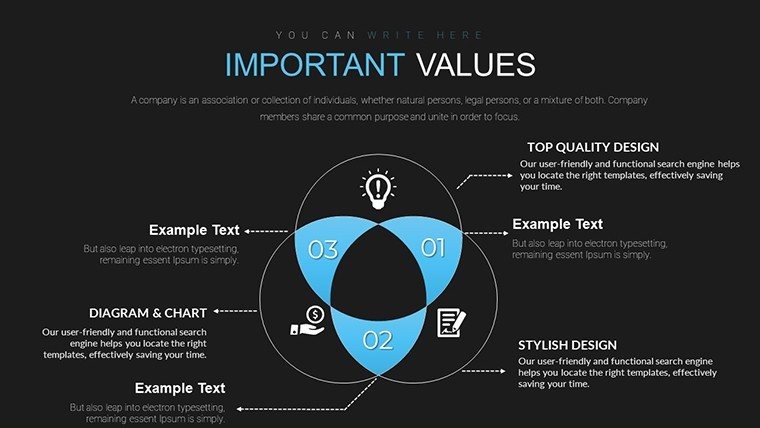
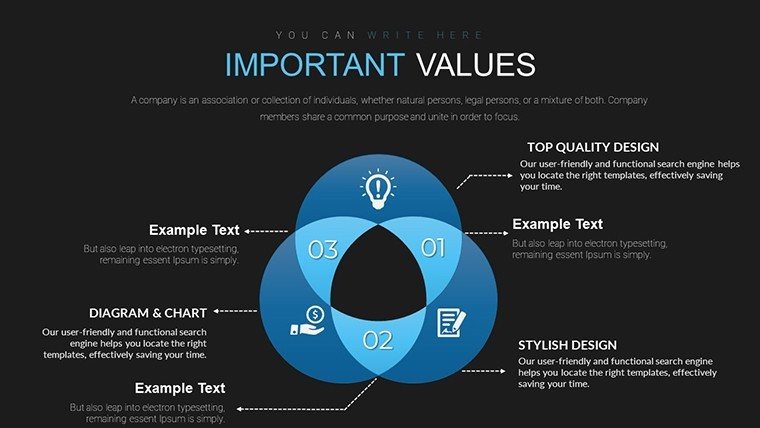
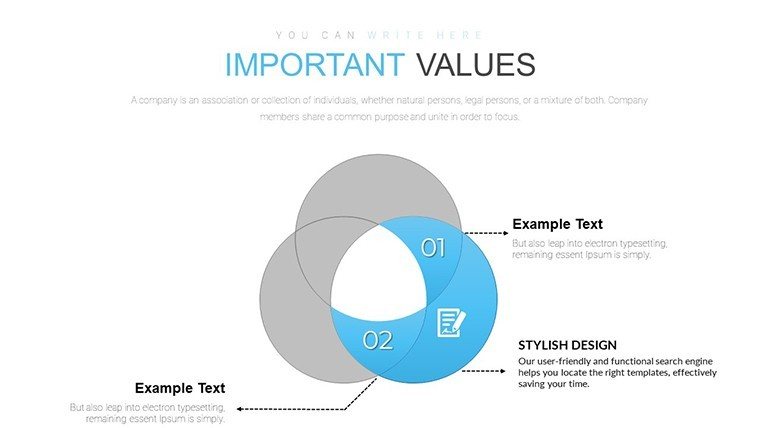
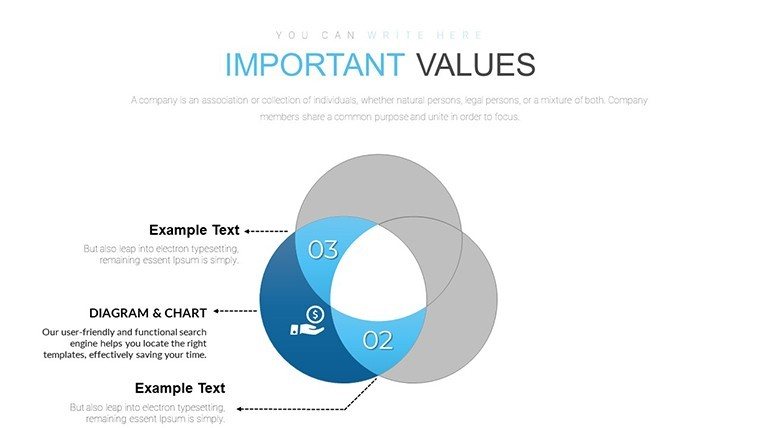
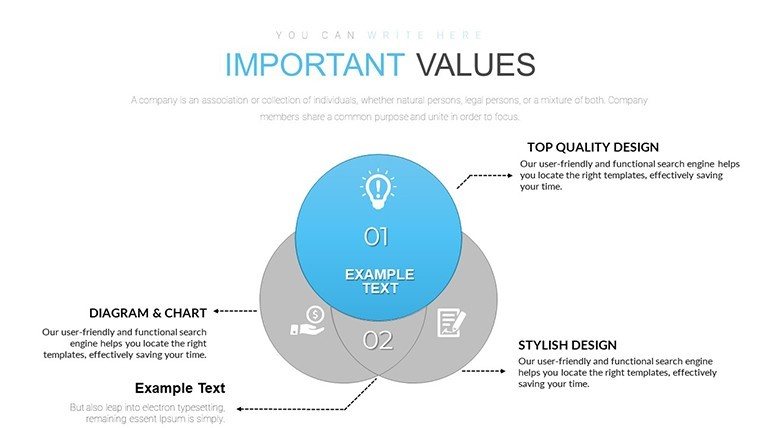
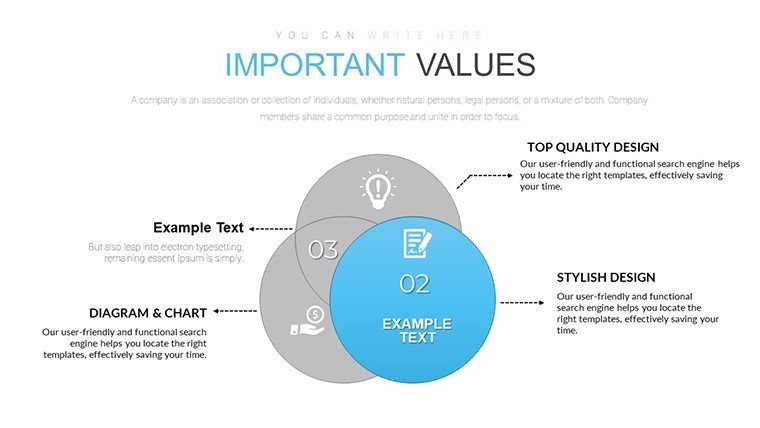
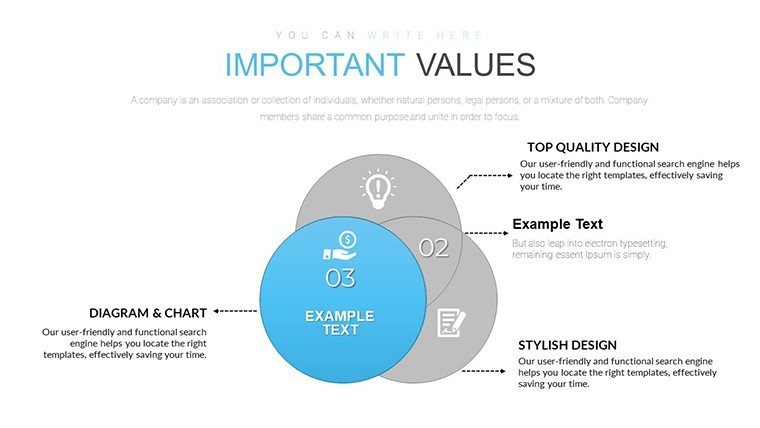
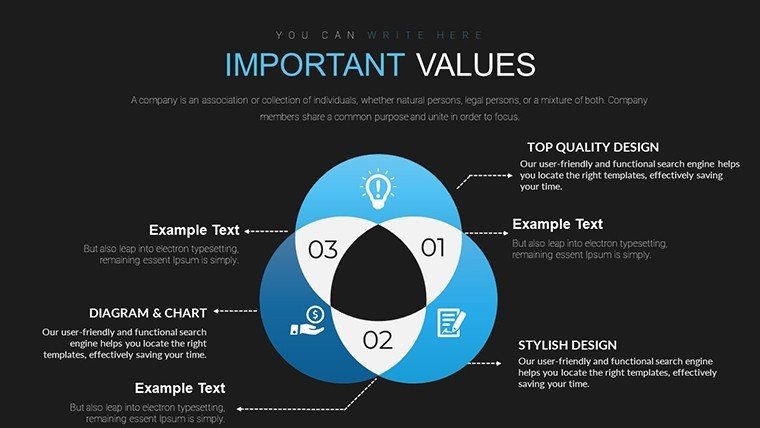
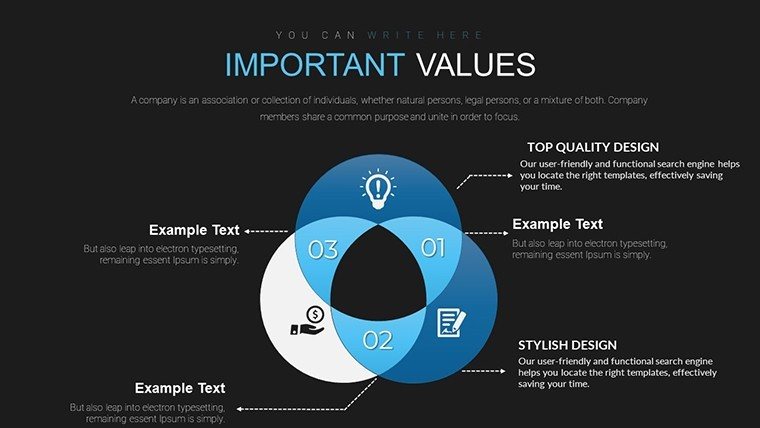
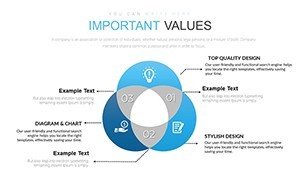
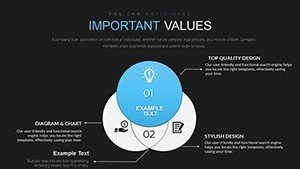
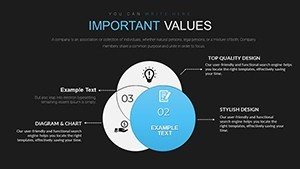
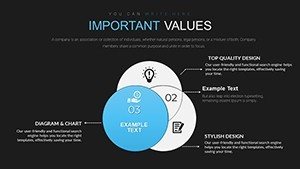
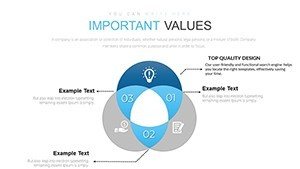
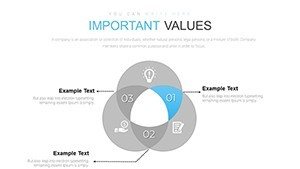
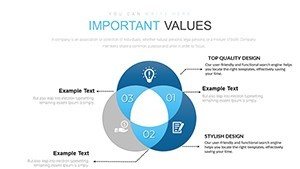
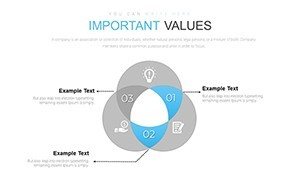
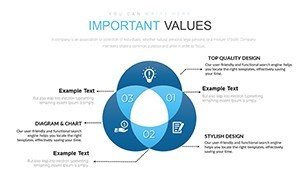
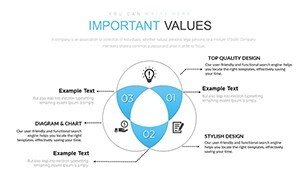
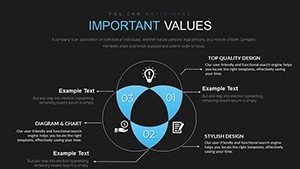
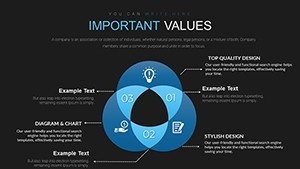
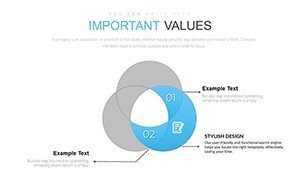
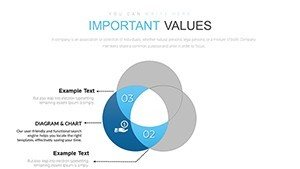
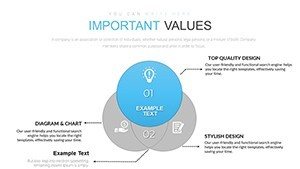
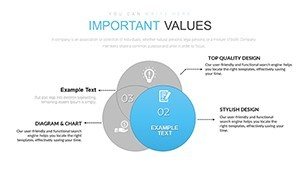
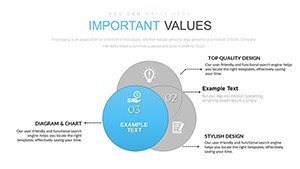
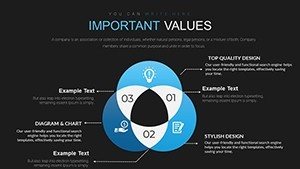
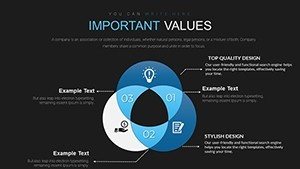
Venn diagrams aren't just for math class; in architecture, they shine as tools for mapping intersections. Our template offers two-set, three-set, and multi-set variations, perfect for dissecting how site constraints overlap with client requirements and regulatory demands. For instance, a two-circle Venn could highlight shared benefits between cost-effective materials and eco-friendly options, while a three-circle version might compare historical preservation, modern innovation, and community needs in renovation projects.
The designs boast sleek lines and gradient fills that evoke contemporary architecture, with easy-to-edit text placeholders for labeling overlaps like "Sustainable + Aesthetic = Award-Winning." Add interactivity with animations that build the diagram piece by piece, drawing your audience into the narrative. This approach not only clarifies but captivates, making your pitches more memorable than static slides.
Standout Features for Seamless Customization
- Layered Overlaps: Adjustable transparency and colors to emphasize key intersections without clutter.
- Icon Library: Built-in symbols for architecture themes, such as blueprints, compasses, and green leaves.
- Responsive Layouts: Scales perfectly for widescreen or standard formats, ideal for virtual or in-person meets.
- Data Linking: Connect to Excel for dynamic updates, ensuring your Venns reflect the latest project stats.
- Theme Consistency: Pre-set palettes that match professional standards, enhancing brand trust.
These elements ensure your diagrams aren't just informative but inspiring, encouraging creative problem-solving in design challenges.
Tailored Use Cases for Architectural Professionals
Envision using a Venn to compare competing bids in a tender process, overlapping criteria like timeline, cost, and quality to pinpoint the best fit. For educational workshops, illustrate how classical, modernist, and postmodern styles intersect in hybrid buildings. In strategic planning, map team roles' overlaps to optimize collaboration on large-scale projects like skyscrapers.
Unlike generic PowerPoint tools that require painstaking alignment, our template delivers precision out of the box. Draw from real-world examples, such as Zaha Hadid Architects employing similar visuals to blend form and function in their iconic structures. Integrate into your workflow: Sketch ideas in software like Rhino, export data, populate the Venn, and refine with feedback loops. Pro tips: Limit sets to three for clarity, use bold fonts for labels, and incorporate real photos in backgrounds for contextual depth.
Workflow Integration: From Concept to Presentation
- Import your data or concepts into the template's intuitive interface.
- Choose a Venn style and customize shapes to represent architectural elements.
- Label intersections with insightful phrases, like "Innovation Meets Regulation."
- Apply animations to reveal overlaps dynamically during your talk.
- Review for accessibility, ensuring color contrasts meet WCAG standards.
- Export and share, ready to impress at your next design charrette.
This method streamlines your process, letting you focus on architecture's artistry rather than slide mechanics.
Maximize Impact with Strategic Visual Storytelling
Our Venn template isn't merely slides; it's a catalyst for clearer thinking in architecture. With 28 options, cover everything from simple comparisons to complex multi-faceted analyses. Benefits include boosted engagement (diagrams increase understanding by 40%, studies show), time efficiency, and elevated in presentations. Naturally incorporate terms like comparative visuals, set intersections, and design synergies.
For AIA-compliant reports, use Venns to overlap ethical standards with project goals. Conclude with a master slide summarizing key insights, urging action like "Adopt this hybrid approach for superior outcomes." Transform how you communicate overlaps - grab this template and redefine your architectural narratives today.
Frequently Asked Questions
How many sets can I create in these Venn diagrams?
Up to four sets comfortably, with slides optimized for two to three for best clarity in architecture comparisons.
Does the template support animations?
Yes, built-in animations allow step-by-step reveals, perfect for building suspense in design presentations.
Can I add my own icons or images?
Certainly - easily insert custom elements to tailor to specific projects, like architectural sketches.
Is it suitable for team collaboration?
Absolutely, Google Slides compatibility enables real-time edits for group planning sessions.
What if my data changes frequently?
Link to external sources like Excel for automatic updates, keeping your Venns current.

