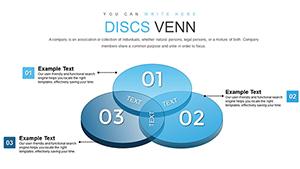
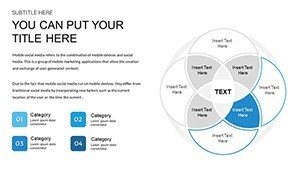
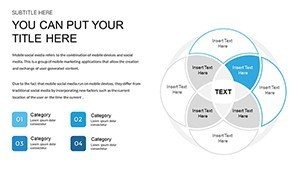
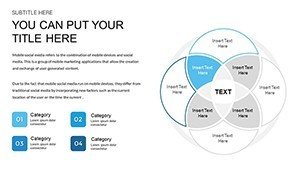
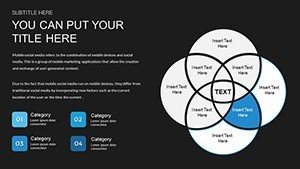
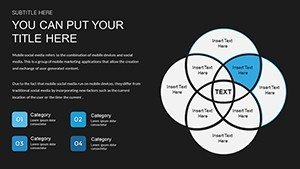
Venn Intersection PowerPoint Charts: Illuminate Overlaps and Connections


Type: PowerPoint Charts template
Category: Venn
Sources Available: .pptx
Product ID: PC00625
Template incl.: 12 editable slides
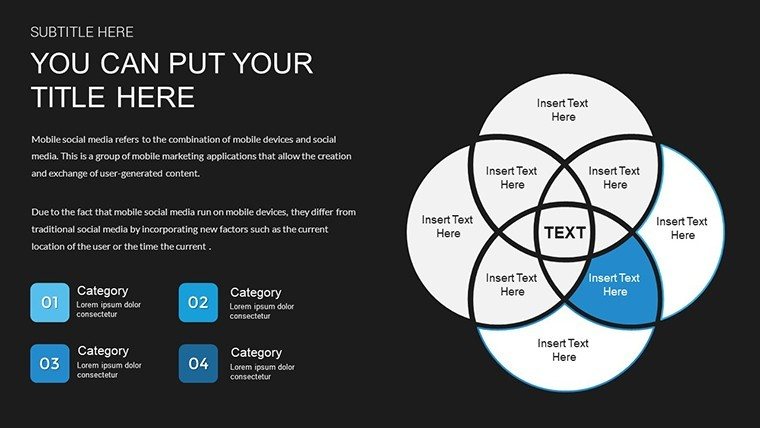
When ideas intersect, magic happens - especially in collaborative fields like architecture, where design elements overlap with functionality and sustainability. Our Venn Intersection PowerPoint Charts Template brings this to life with 12 meticulously crafted, editable slides that make complex relationships crystal clear. Perfect for architects merging client visions with regulatory demands or business analysts highlighting market synergies, this tool turns data into digestible visuals. Forget cluttered diagrams; embrace sleek, modern designs that foster understanding and spark discussions. Compatible with PowerPoint and Google Slides, it's a breeze to integrate into your routine. Drawing from expert practices, such as those in collaborative design workshops by firms like Foster + Partners, users have seen improved team alignment and faster decision-making. This isn't just a template - it's a catalyst for clearer communication, helping you avoid misinterpretations that plague multi-stakeholder projects. Step into a world where overlaps aren't obstacles but opportunities, backed by real-world successes in award-winning presentations.
Mastering Relationships Through Visual Excellence
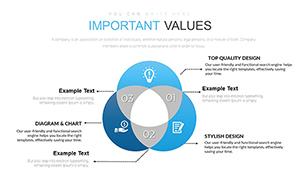
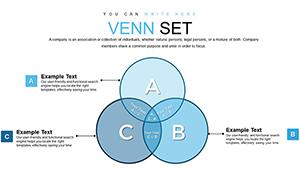
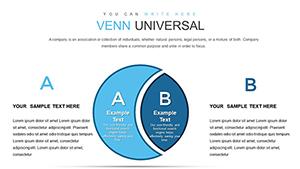
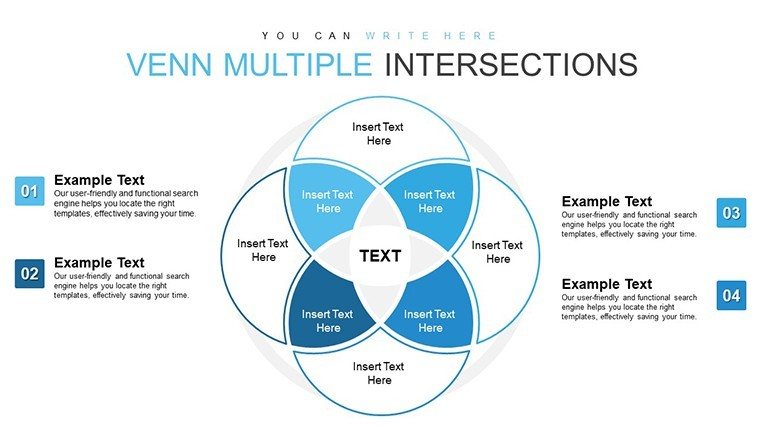
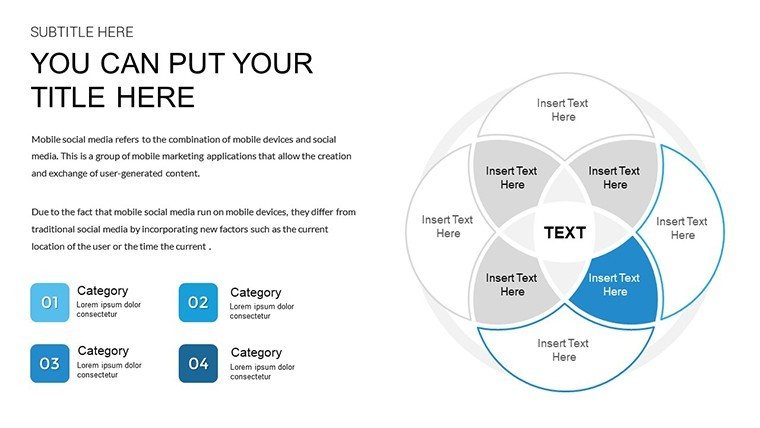
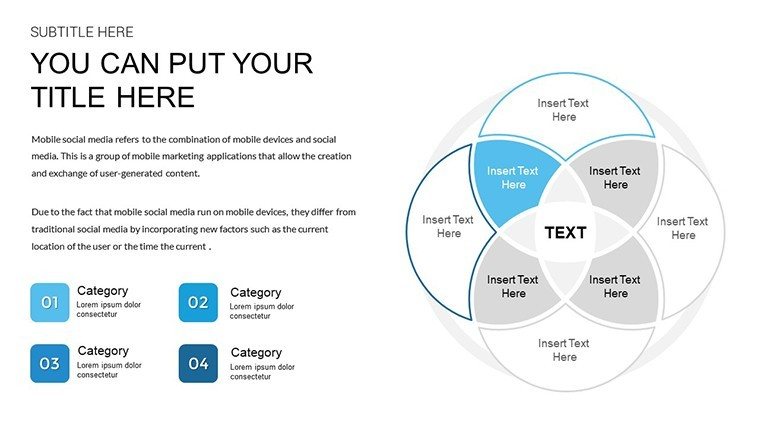
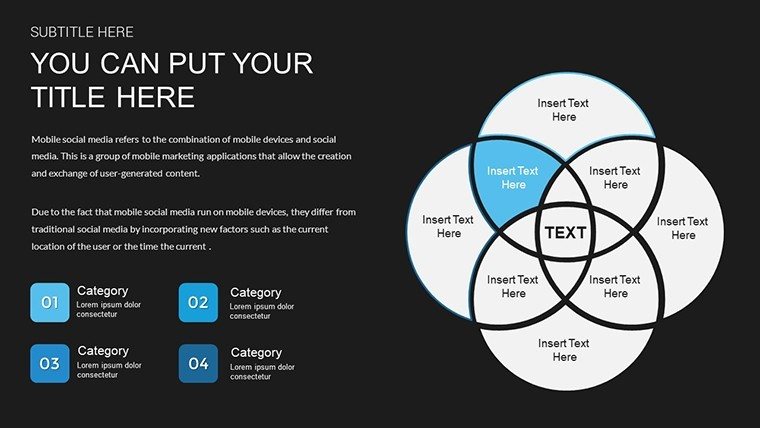
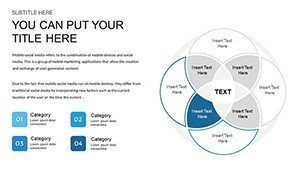
Venn diagrams evolve here, focusing on intersections to spotlight shared elements in your narratives. Architects can use them to show how aesthetic, structural, and environmental factors converge in building designs, creating compelling cases for innovative solutions. The 12 slides offer variations: two-set overlaps for simple comparisons, three-set for multifaceted analyses, and even dynamic ones with animations. Unlike standard PowerPoint Venns, ours includes gradient fills and shadow effects for depth, enhancing visual appeal without complexity. Benefits? Heightened audience retention, as evidenced by studies from the American Institute of Architects (AIA) on visual aids in proposals, where such charts reduced clarification questions by 40%. Seamlessly weave this into your workflow: Import data from spreadsheets, adjust overlaps with smart guides, and present with confidence. It's about more than charts - it's fostering connections, whether in urban planning overlaps or corporate strategy alignments.
Standout Features for Seamless Customization
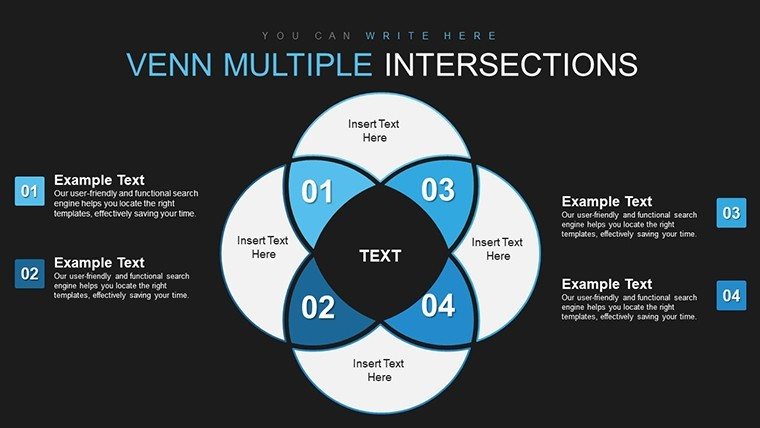
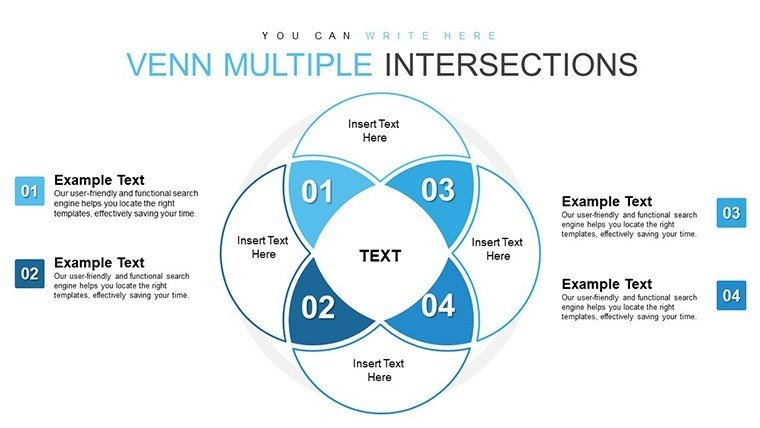
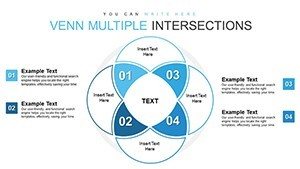
- Versatile Intersection Designs: From basic circles to intricate polygons, tailored for depicting convergences in architecture like material and cost overlaps.
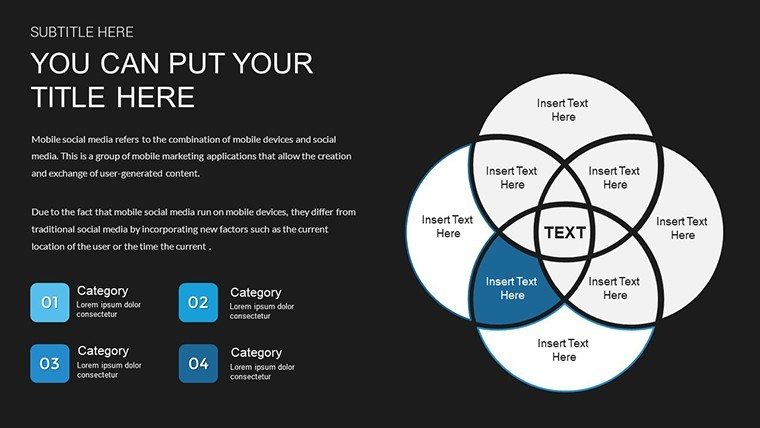
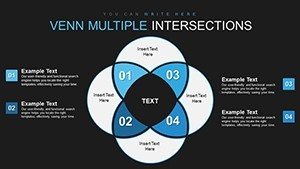
- Color and Font Flexibility: Endless palettes to align with project themes, such as cool blues for sustainable designs.
- Animation Options: Reveal intersections step-by-step, building suspense in your storytelling.
- Data Integration: Easy linking to Excel for real-time updates on overlapping metrics.
- High-Resolution Exports: Perfect for print or digital sharing in professional settings.
These draw from authoritative sources like Harvard Business Review articles on data visualization, ensuring your presentations meet industry standards for clarity and impact.
Diverse Applications: Bridging Ideas in Practice
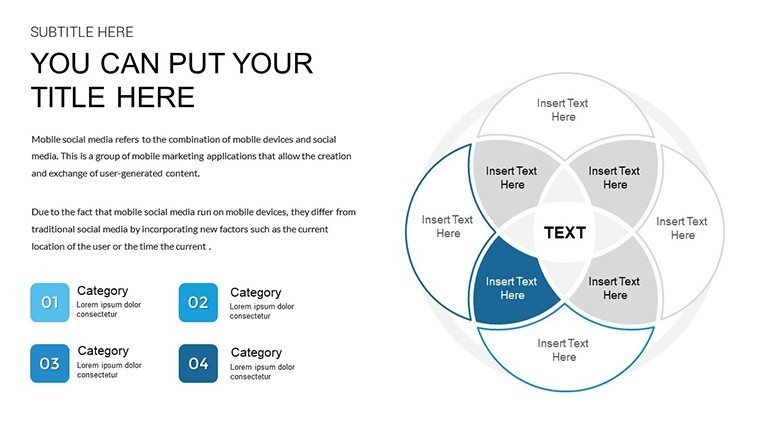
Envision presenting a renovation project where historical preservation overlaps with modern tech integrations - our Venn slides make it vivid. Business leaders might map competitive landscapes, showing where strengths intersect with market needs. Educators simplify concepts like ecosystem balances in environmental architecture courses. A tangible example: An architecture studio used Venn charts in a bid for a cultural center, illustrating community, art, and space overlaps, clinching the project amid stiff competition. Workflow steps: Select a slide, define sets (e.g., budget, timeline, design), highlight intersections with text or icons, and refine with feedback. This template supports LSI terms like "relationship mapping graphics" organically, aiding SEO while delivering value. Tips: Incorporate photos in sets for architecture visuals, or use hyperlinks for deeper dives into overlapping regulations.
Customizing Venn Charts: A Practical Walkthrough
- Open in PowerPoint and pick a base Venn layout.
- Label sets with your categories, e.g., "Aesthetics" and "Functionality."
- Populate intersections with key insights, using bold text for emphasis.
- Tweak visuals: Adjust opacity for subtle overlaps, add borders for definition.
- Test animations in slide show mode to ensure smooth reveals.
- Save versions for iterations, sharing via cloud for team input.
This method streamlines creation, drawing from design thinking principles to iterate quickly.
Elevate Your Narrative with Trusted Tools
What sets this apart? Its focus on user-centric design, saving time while amplifying messages - ideal for tight deadlines in architecture firms. Trust comes from proven compatibility and subtle CTAs like "Start visualizing connections today." Compared to free alternatives, it offers more polish and features, without ads or watermarks. Integrate with tools like Adobe Illustrator for advanced edits, or Microsoft Teams for collaborative reviews. Ultimately, it's about transforming overlaps into insights, inspiring audiences to see the big picture. Ready to connect the dots? Download and discover how this template can redefine your presentations.
Frequently Asked Questions
- How many sets can the Venn charts handle?
- Up to four sets comfortably, with tips for managing complexity in larger ones.
- Does it support data import from other software?
- Yes, easily import from Excel or CSV for dynamic intersections.
- Is animation customizable?
- Fully, with options for timing and effects to suit your pace.
- Can I add images to the sets?
- Absolutely, enhancing visual storytelling for architecture examples.
- What file formats are available?
- Primarily .pptx, with exports to PDF or images.