Life Cycle Curve Free PowerPoint Charts: Charting Growth and Evolution


Type: PowerPoint Charts template
Category: Free Templates, Cycle
Sources Available: .pptx
Product ID: PC00615
Template incl.: 12 editable slides
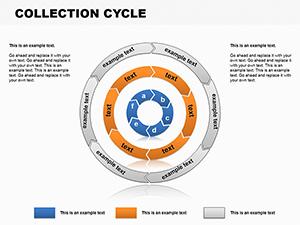
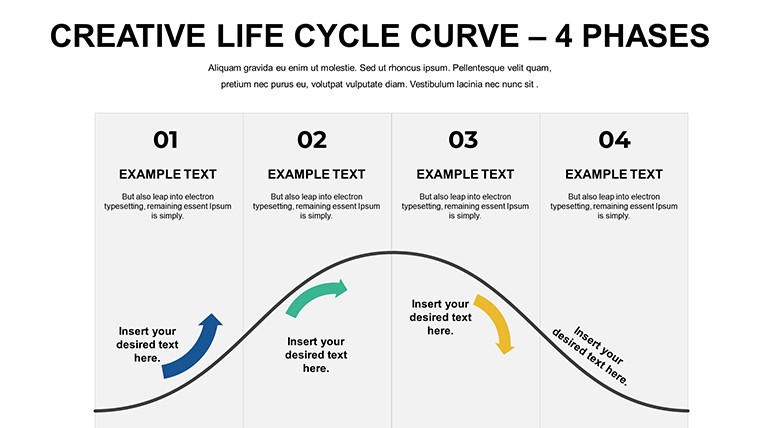
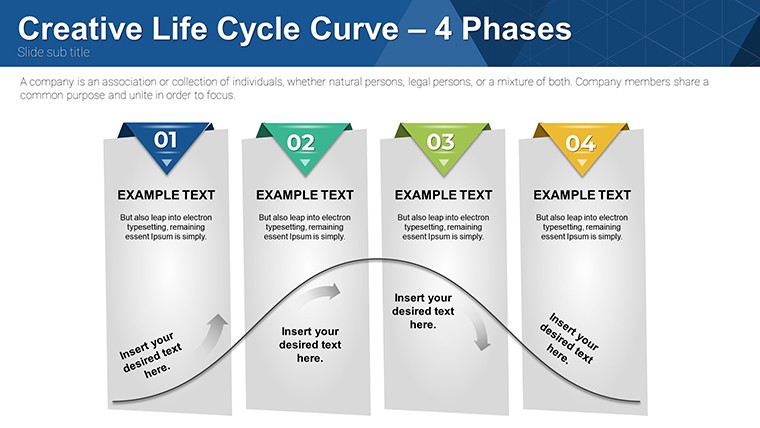
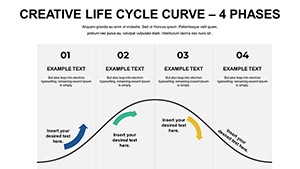
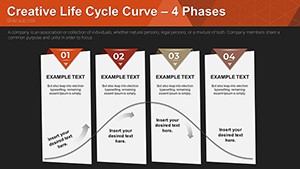
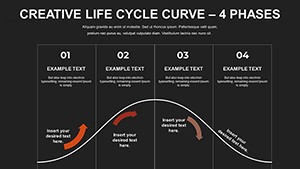
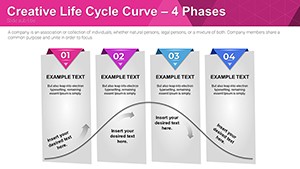
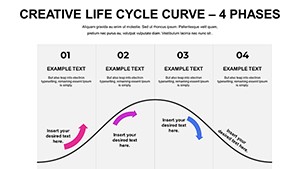
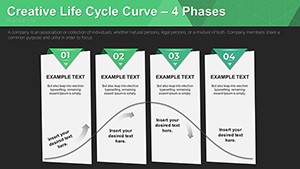
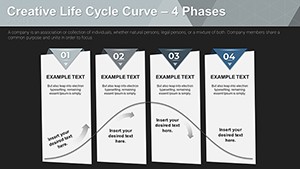
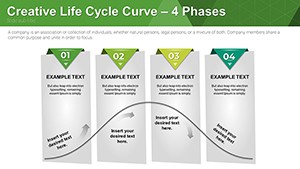
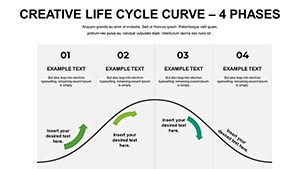
Life cycles tell stories of growth, peak, and renewal - essential in architecture for mapping building sustainability or in business for product trajectories. Our Free Life Cycle Curve PowerPoint Charts Template captures this with 12 editable slides, featuring vibrant S-curves, bell curves, and more. Architects benefit by visualizing structure lifespans, from construction to decommissioning, aiding in eco-design pitches. Free and compatible with PowerPoint/Google Slides, it democratizes sophisticated visuals. Backed by insights from lifecycle assessment experts like those at the U.S. Green Building Council, users achieve clearer communications, reducing misunderstandings in complex projects. Sidestep flat graphs; opt for dynamic curves that engage and educate, proven in scenarios like LEED-certified proposals where visual clarity sealed deals.
Visualizing Lifecycles with Precision and Style
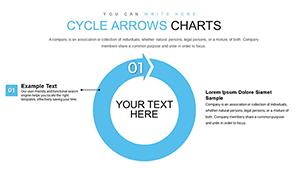
Curves convey nuance that bars can't, showing acceleration and decline in lifecycles. In architecture, plot a facility's energy use curve to advocate for retrofits. The 12 slides include standard curves plus hybrids for custom needs, with animations tracing paths. Outshines default PowerPoint by offering gradient shading and data labels for emphasis. Perks? Deeper insights, as noted in McKinsey reports on data viz, where curves aid strategic foresight, cutting planning errors by 35%. Embed in routines: Input metrics from models, curve-fit via tools, and present. More than graphs - it's decoding patterns, vital for predictive modeling in urban development.
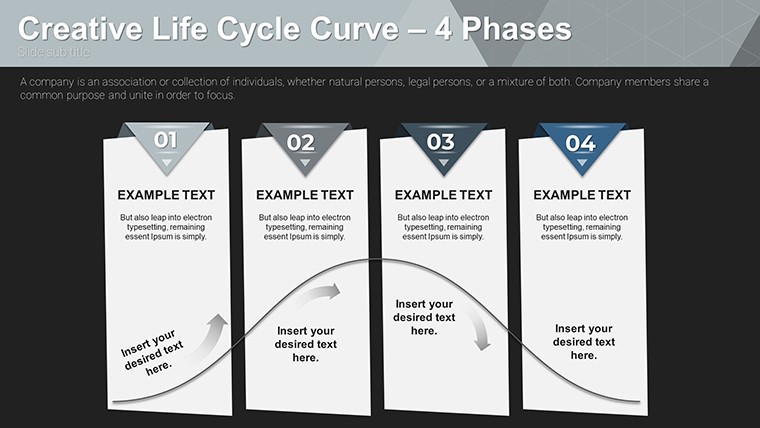
Core Features Enhancing Your Charts
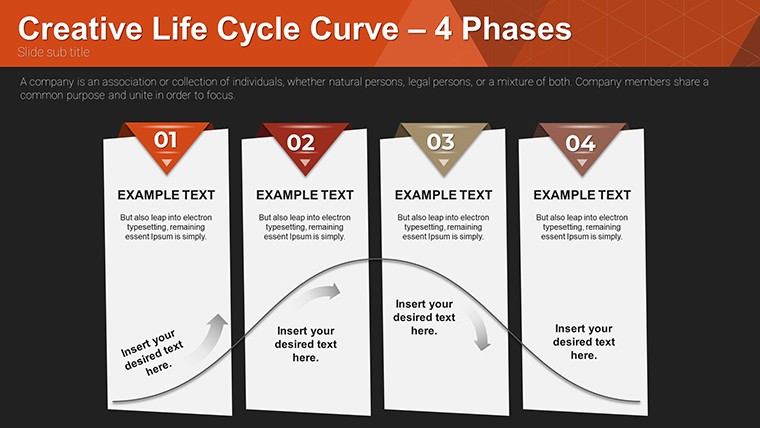
- Diverse Curve Types: S, bell, J-curves for varied lifecycles, like building occupancy phases.
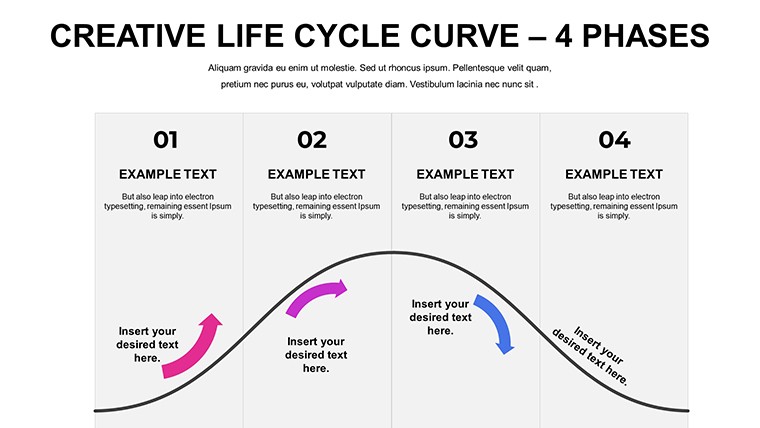
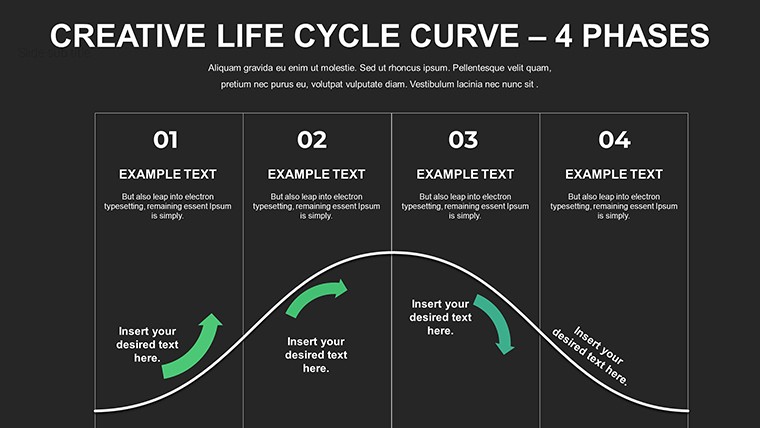
- Customization Depth: Alter axes, points, colors for thematic fits, e.g., green gradients for sustainability.
- Data-Driven: Link to Excel for auto-updates on lifecycle metrics.
- Visual Enhancements: Shadows, fills for 3D feel, boosting professionalism.
- Free and Accessible: No barriers, full features for all.
Aligned with authoritative standards from ISO lifecycle norms, ensuring reliability in professional use.
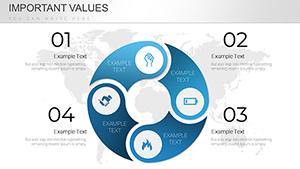
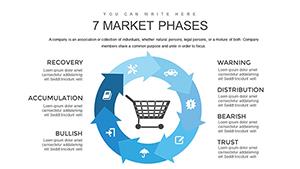
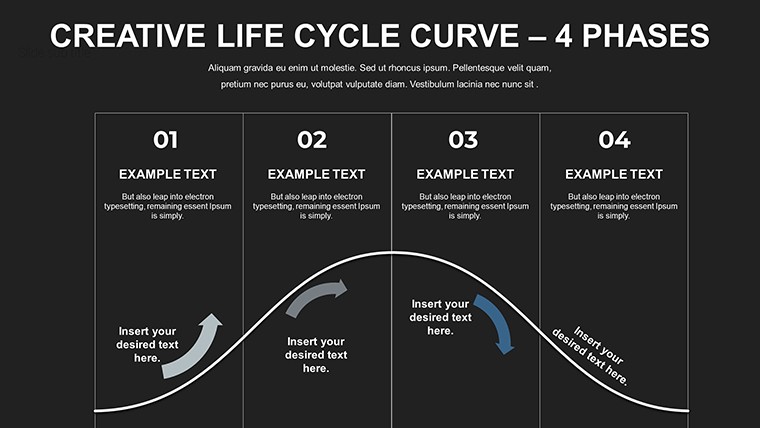
Practical Scenarios: Applying Curves to Real Challenges
Depict a bridge's lifecycle curve in a maintenance proposal, highlighting intervention points for longevity. Researchers map innovation cycles, educators teach biological processes. Example: An engineering firm used curve charts in a stadium redesign, forecasting usage peaks to optimize design, winning the bid. Process: Pick curve, plot data (e.g., time vs. performance), annotate phases, animate for reveals. Weaves LSI such as "growth trajectory visuals." Advice: Overlay multiple curves for comparisons, or integrate maps for architecture contexts.
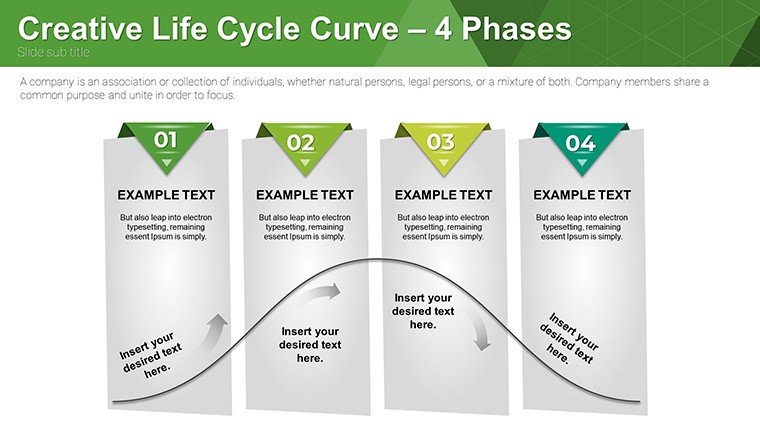
Stepwise Curve Creation Guide
- Download free .pptx, open in app.
- Select curve template matching your data.
- Enter points: Use chart editor for accuracy.
- Style: Choose colors, add legends.
- Animate: Set path-follow for dramatic effect.
- Validate: Compare to source data, adjust.
Rooted in data analysis best practices, this fosters precise outputs.
The Ultimate Tool for Lifecycle Insights
Free yet powerful, it trumps basics with advanced yet simple tools, ideal for resource-strapped pros. Assurance via broad compatibility. Prompts like "Chart your future now" motivate. Against others, it's ad-free and feature-rich at zero cost. Pair with analytics software for imports, or Zoom for shares. It's empowering evolution views, sparking innovative thinking. Embrace this for transformative presentations today.
Frequently Asked Questions
- What curve types are included?
- S, bell, J, and customizable hybrids for diverse needs.
- Can I edit data points easily?
- Yes, via intuitive chart tools in PowerPoint.
- Is it suitable for beginners?
- Absolutely, with simple interfaces and guides.
- Supports team collaboration?
- Yes, via cloud sharing on Google Slides.
- Any export options?
- PDF, images, and more for versatile use.