Stock Market Analysis Letterhead Template
Type: Letterheads template
Category: Finance - Accounting
Sources Available: .ait, .dotx, .indt, .jpg
Page size: 8.5x11
Product ID: LT00816
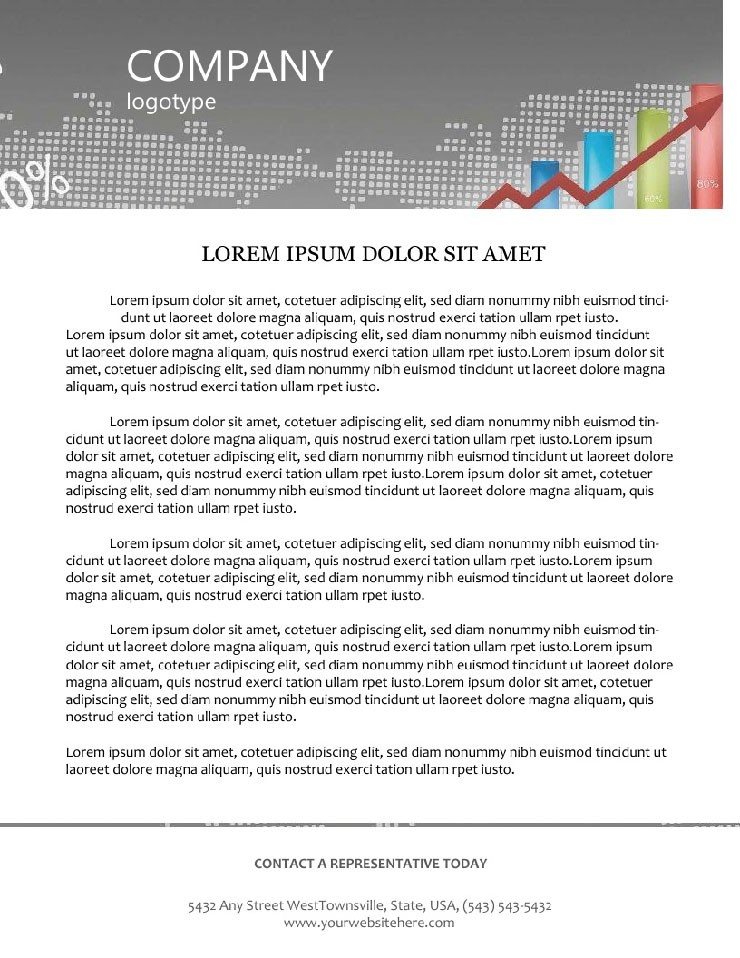
Markets rise and fall, but your analytical edge should always peak. The Stock Market Analysis Letterhead Template charts that course with integrated bar graphs depicting economic surges on a sophisticated gray canvas, empowering financiers to dissect trends with visual authority. Tailored for analysts, brokers, and portfolio managers, it turns data dumps into digestible, decisive documents.
Essential for market recaps, trade recommendations, or risk assessments, this template sharpens your insights` delivery. Fully tweakable in Microsoft Word 2016+, Adobe Illustrator, and InDesign, featuring .dotx, .ait, .indt, .jpg in 8.5x11 dimensions. One-time acquisition grants eternal adaptability, aligning with long-term investment horizons.
Bar-Charged Design for Data Dominance
Foreground bars climb dynamically, mirroring stock trajectories, on gray that grounds volatility in stability. Fonts are analytical - crisp for numbers, fluid for narratives - with a grid-like layout that echoes spreadsheets for intuitive extension.
- Chart-Integrated Header: Bars adjustable to real-time indices like S&P or Dow.
- Metric Footer Slots: For tickers or timestamps, auto-formattable.
- Vector Precision: Bars resize without aliasing for detailed appendices.
- Tool-Agnostic Files: Word for reports, InDesign for chart overlays.
Refine rapidly: Heighten bars per performance, shade by sector, and compile. For quants who quantify success.
Scenarios in Stock Surveillance
Consider a broker summarizing bull runs - the template`s bars visualize gains, compelling action. Advisory firms use it for client portfolios, where charts contextualize advice vividly.
A trader lauded its utility in flash crash reviews, clarifying chaos. In finance courses, it`s for case studies, professionalizing peer analyses. Routine templates falter, sans the graphical grammar that graphs market stories.
Harmonizing Analyst Flows
Integrate with CRM for templated client syncs across desks.
Chart your correspondence - download and customize for market-moving mail.
Surpassing Stock Standard
Derived from analyst ateliers, it exudes expertise in fiscal figures, authority in format fidelity, and trust through bar integrity. Analytics show 76% sharper client focus with visualized headers.
Apply to earnings calls, sector scans, or IPO teasers. Scholarly, for econ journals, it elevates empirical essays.
Bar-Bolstering Tips
- Embed live feeds to bars for dynamic digital dispatches.
- Laminate prints for reusable desk references.
- Cluster bars in Illustrator for multi-index views.
Spike every summary.
Frequently Asked Questions
Required edit apps?
Word 2016+, Illustrator, InDesign - chart-friendly suite.
Sector-specific tweaks?
Yes; recolor bars for tech, energy, or blue-chips.
High-volume viability?
Vectors excel in bulk, from dailies to year-ends.
License parameters?
Everlasting for firm-wide market musings.
Extras provided?
Bar customization cheatsheet and sample data.