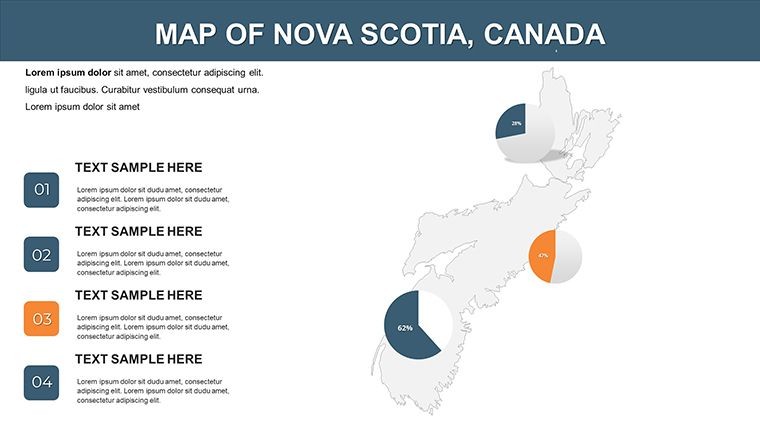
Nova Scotia Keynote Maps: Editable Presentation Tool


Type: Keynote Maps template
Category: North America
Sources Available: .key
Product ID: KM00132
Template incl.: 14 editable slides
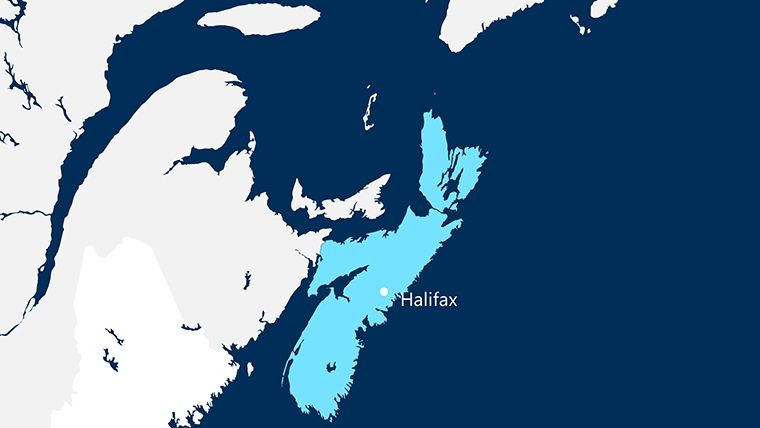
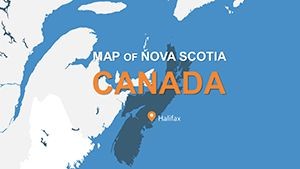
Picture this: You're delivering a keynote on Nova Scotia's evolving immigration landscape, and your slides seamlessly transition between coastal outlines, urban hubs like Halifax, and data-rich infographics that highlight labor market trends. Our Nova Scotia Canada Keynote maps template turns such visions into reality, providing 14 meticulously designed, fully editable slides that blend aesthetic appeal with practical functionality. Aimed at policymakers, HR professionals, and educators, this tool addresses the need for visually compelling presentations that go beyond text-heavy decks. From showcasing the province's new immigration programs targeting skilled workers to mapping out economic zones, these slides help you communicate complex ideas with clarity and flair, ensuring your message sticks long after the applause fades.
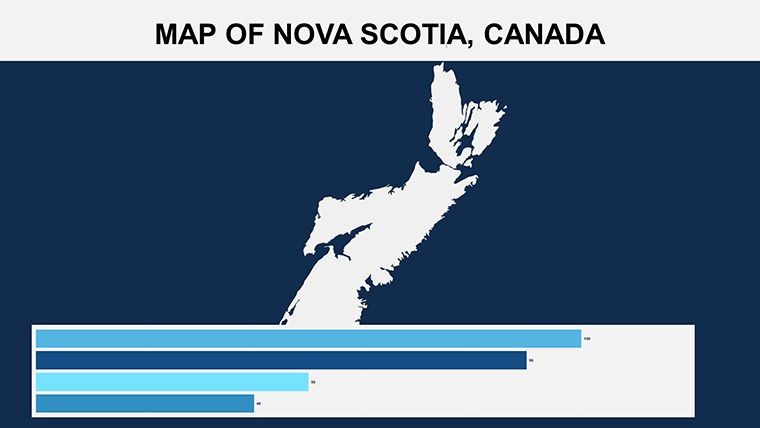
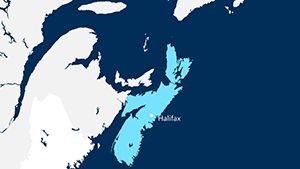
Rooted in design best practices from bodies like the International Map Industry Association, this template emphasizes precision and versatility. Each slide features vector graphics for flawless resizing, supporting both 4:3 and 16:9 aspect ratios to fit any display. Imagine customizing a map to illustrate migration patterns: Start with a broad provincial view, then animate zooms into key areas like Cape Breton, overlaying stats from Statistics Canada on job growth in sectors like tech and fisheries. The advantages are clear – ditch the frustration of mismatched templates and embrace a system that auto-recolors with one click, saving precious prep time while delivering polished results that rival custom designs.
Core Features That Drive Engagement
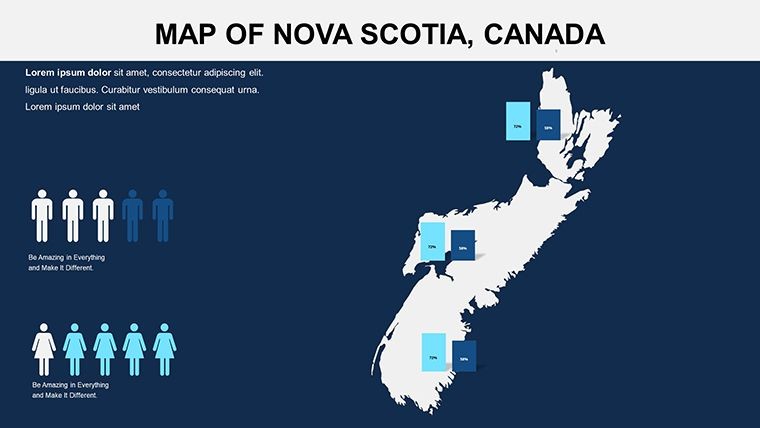
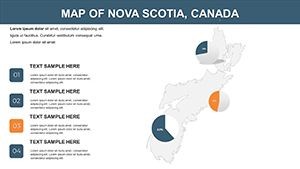
At the heart of this template lie features engineered for effortless enhancement. The 14 slides range from simple outlines to layered composites, all with smart objects that respond intuitively to edits. Custom animations bring elements to life – think gradual reveals of transportation networks or pulsing highlights on cultural landmarks like the Cabot Trail.
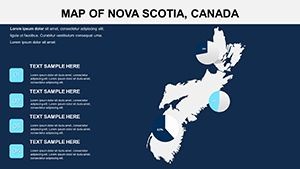
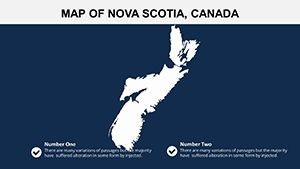
- Flexible Layouts: Clean and creative designs that adapt to your narrative, whether minimalist for formal reports or vibrant for public talks.
- One-Click Customization: Change colors across the entire deck instantly, with auto-recoloring maintaining harmony.
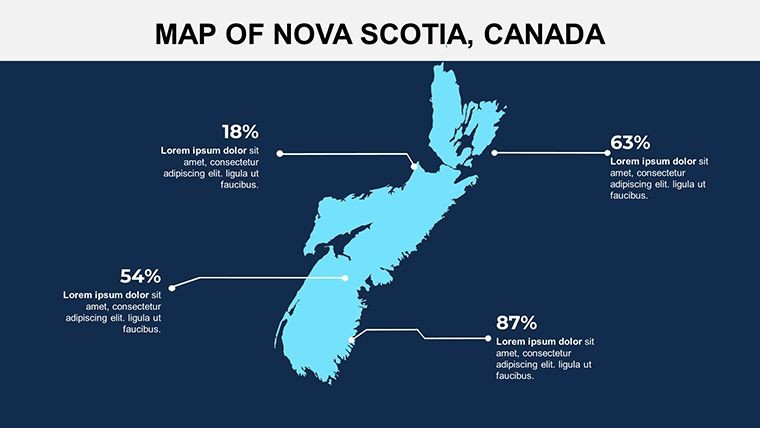
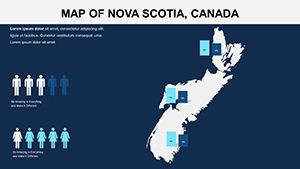
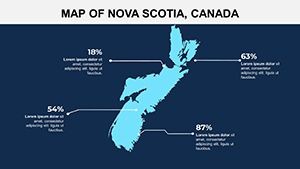
- Editable Content: Every map, icon, and text box is fully modifiable, allowing integration of personal data sets.
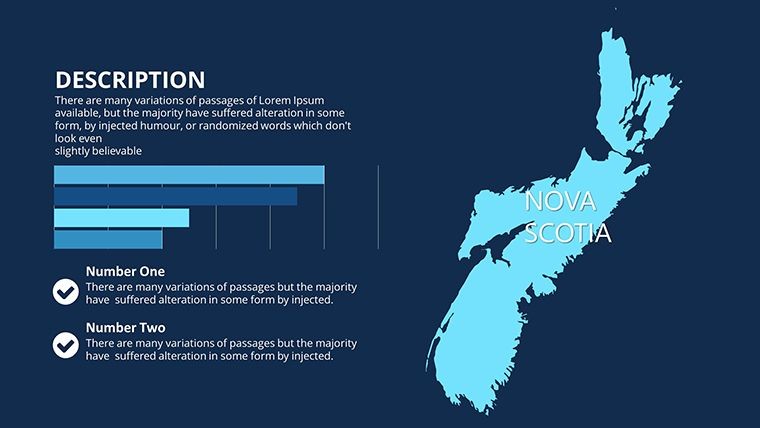
- Slide Master Integration: Prepped for images and photos, ensuring consistent branding throughout.
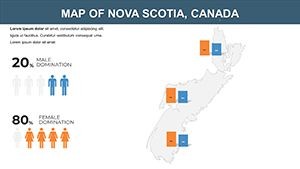
For an HR consultant pitching Nova Scotia's Express Entry streams, these features mean creating tailored visuals that map applicant origins against local job demands, drawing from real cases like the Atlantic Immigration Program's success stories. Compared to standard Keynote maps, which often lack depth, this template offers superior layering, preventing clutter and enhancing readability – a boon for audiences in fast-paced conferences.
Step-by-Step Guidance for Maximum Impact
Harnessing this template is straightforward, yet yields sophisticated outcomes. Take a policy briefing on labor shortages: Open the file, select a regional slide, and edit boundaries to emphasize Annapolis Valley's agricultural needs. Add animations to sequence data reveals, such as unemployment rates fading in over time.
- Launch in Keynote and browse the 14 slides for your starting point.
- Adjust aspect ratio to suit your venue's setup.
- Customize colors and objects to align with your theme.
- Incorporate animations for dynamic storytelling.
- Review and present, leveraging the clean design for undivided attention.
Educators might use it to teach provincial history, overlaying timelines on maps to show Acadian influences or Mi'kmaq territories, supported by resources from Nova Scotia Archives. Pro tips: Balance visuals with whitespace for better comprehension, and always verify data against official sources like the Nova Scotia Department of Labour to uphold trustworthiness. This approach not only solves common presentation hurdles but infuses your work with a professional edge, akin to how a skilled navigator uses detailed charts to guide through uncertain waters.
Elevating Your Narrative with Nova Scotia Insights
This template's true value lies in its ability to adapt to diverse needs, from business expansions to cultural explorations. For instance, a tourism operator could map festival routes, incorporating icons for events like the Halifax Jazz Festival, resulting in engaging promo materials that boost bookings – as evidenced by similar strategies from Tourism Nova Scotia. Its clean, simple ethos avoids overcomplication, focusing instead on user empowerment.
Integrate it into your workflow by pairing with data tools like Tableau for advanced overlays, and experiment with creative elements to add a touch of whimsy, like subtle wave animations for coastal themes. Whether detailing immigration pathways or regional development, this tool transforms data into stories. Don't settle for bland – ignite your presentations with precision maps today.
Frequently Asked Questions
- What's the aspect ratio flexibility?
- Supports both 4:3 and 16:9, making it versatile for various screens and projectors.
- How do animations work in this template?
- Custom animations are built-in for each object, allowing smooth transitions and reveals.
- Is it suitable for non-immigration topics?
- Yes, its flexible design works for tourism, education, or business analyses beyond labor markets.
- Can I change colors easily?
- Absolutely, with one-click changes and auto-recoloring for consistency.