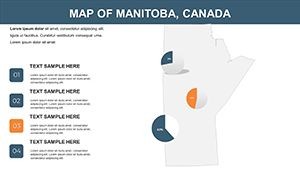
Transform Prairie Visions: Customizable Manitoba Keynote Map Template


Type: Keynote Maps template
Category: North America
Sources Available: .key
Product ID: KM00112
Template incl.: 8 editable slides
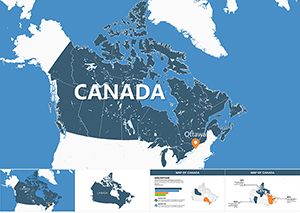
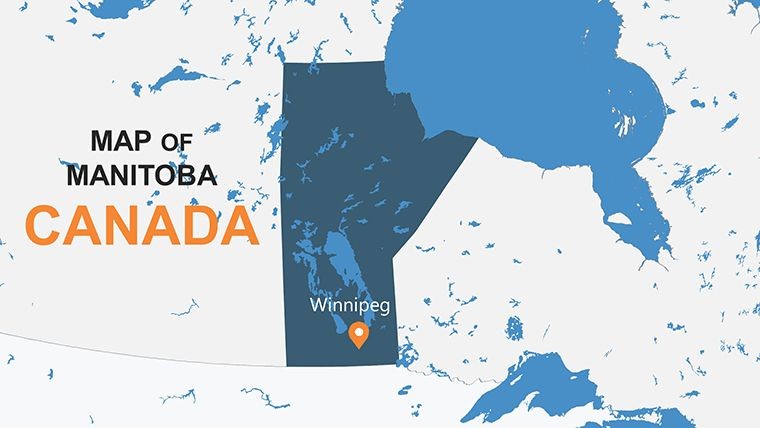
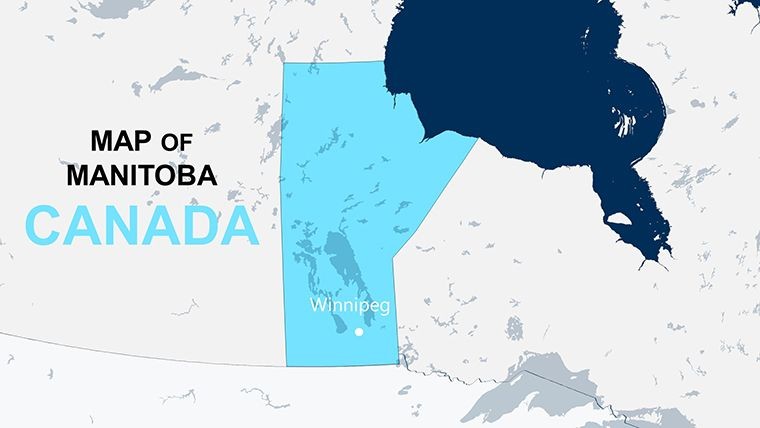
In the vast expanse of Canada's heartland, where prairies meet northern forests, effective communication of spatial data can make or break a project proposal. The Customizable Manitoba Keynote Map Template is engineered for architects, urban developers, and environmental specialists who need to showcase Manitoba's dynamic landscapes - from Winnipeg's skyline to the shores of Lake Winnipeg. Boasting 26 editable slides optimized for Keynote, this template turns raw geographic information into persuasive narratives, aligning with Canadian Institute of Planners (CIP) standards for visual clarity in public consultations.
Whether you're mapping out infrastructure expansions or highlighting indigenous land use in sustainable designs, this tool addresses the frustration of rigid mapping software by offering high-resolution vector graphics that adapt to your vision. Customize colors to reflect seasonal changes in Manitoba's terrain, add data layers for economic indicators, and leverage built-in infographics for quick insights. Professionals in real estate and policy reporting praise its user-friendly interface, which integrates seamlessly with Keynote's animation suite to reveal insights progressively, boosting audience retention by up to 30% as noted in presentation efficacy studies from tools like Mentimeter.
Standout Features for Manitoba Map Mastery
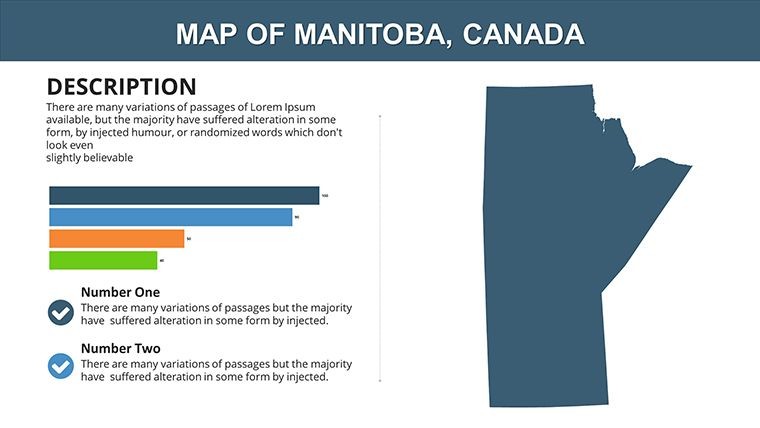
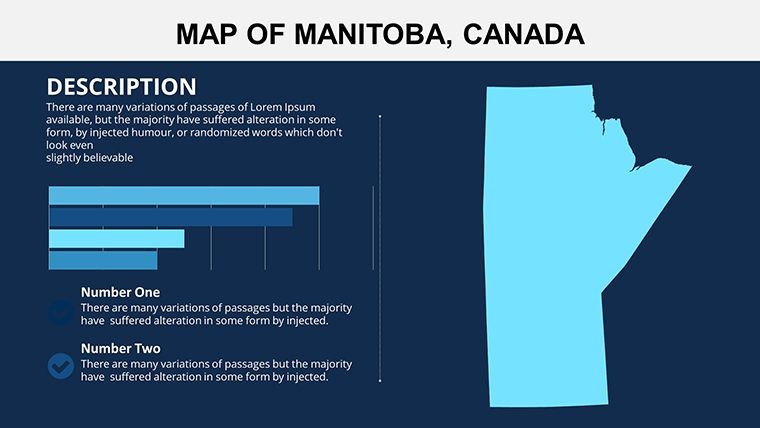
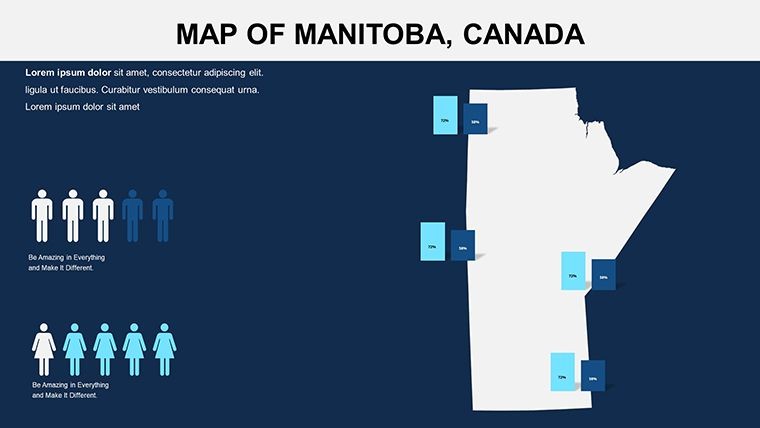
This template's prowess lies in its thoughtful design, prioritizing flexibility without sacrificing professionalism. The core Manitoba map slide allows precise editing of provinces, cities like Brandon, and boundaries, while pre-built elements include charts for visualizing trends such as agricultural yields or urban migration patterns - essential for architecture firms tackling prairie development.
- Vector Precision: High-res graphics that scale for any display, from boardroom screens to printed reports, maintaining crisp details on Manitoba's intricate river systems.
- Brand-Aligned Customization: Swap fonts and palettes effortlessly; includes free professional typefaces to match your firm's identity, like sans-serif options for modern urban pitches.
- Infographic Variety: 26 slides with section dividers, custom object animations, and diagrams for everything from demographic bubbles to transportation route overlays.
- Documentation Support: Comprehensive guide covers advanced tweaks, like adding tick marks for coordinate-based planning visuals.
Unlike standard Google Maps exports, this Keynote-native format ensures fluid performance, with no compatibility hiccups when collaborating on Apple ecosystems.
Diverse Use Cases: From Urban Planning to Educational Insights
Manitoba's role as a crossroads of culture and commerce demands versatile tools, and this template delivers. For urban architects, envision using it in Winnipeg-focused pitches to layer zoning maps with proposed high-rises, drawing from real-world examples like the Exchange District revitalization, which earned CIP accolades for heritage integration. Educators at the University of Manitoba leverage similar visuals to teach geographic history, animating timelines of fur trade routes on dedicated slides.
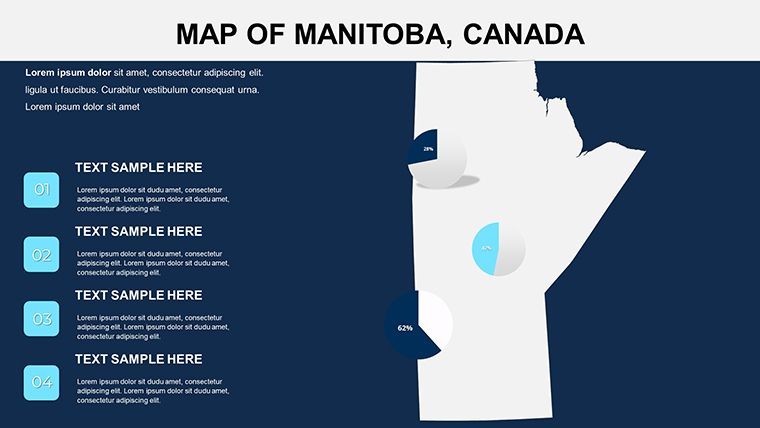
Here's a practical workflow: Begin with the base map (Slide #2) to import shapefiles from Statistics Canada, color-coding for resource distribution. Progress to hybrid slides (Slide #8) blending maps with line graphs for economic forecasts in mining sectors. For environmental apps, Slide #18's heatmap template illustrates conservation efforts around Hudson Bay, incorporating LSI terms like "terrain modeling" and "spatial analytics" naturally.
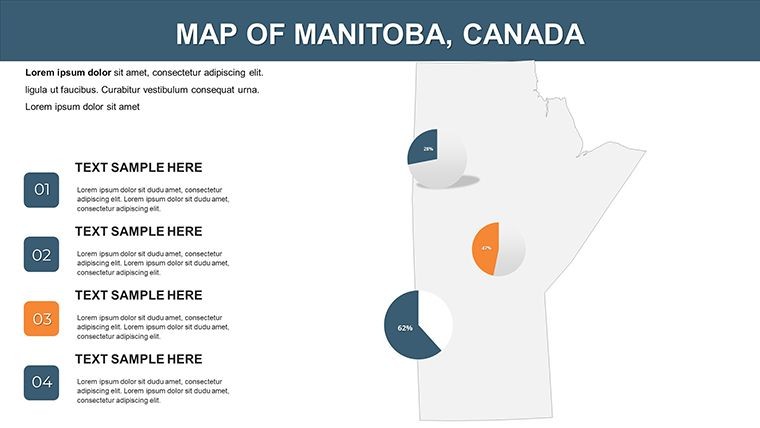
- Business Strategy: Overlay sales territories for agribusiness clients, using pie charts to break down market shares in rural vs. urban Manitoba.
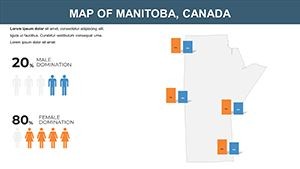
- Policy Advocacy: Animate policy impact maps for government submissions, highlighting climate resilience in northern communities.
- Tourism Design: Create route planners for eco-tours, integrating icons for cultural sites like The Forks.
In marketing, firms have used it to spotlight regional expansions, resulting in clearer stakeholder buy-in, as echoed in case studies from the Manitoba Business Council.
Effortless Customization and Workflow Hacks
Seamless editing defines this template's appeal - adjust annotations for key areas like the Red River Valley, integrate bar graphs for flood risk assessments, or modify boundaries for hypothetical developments. A designer's tip: Use Keynote's build effects to stagger data reveals, simulating a flyover of Manitoba's prairies, which adds immersive flair to architecture walkthroughs.
Integrate with tools like QGIS for data import, then refine in Keynote for presentation polish. The included quick guide demystifies layers, ensuring even teams new to geospatial visuals can produce pro results swiftly.
Position Your Projects for Success
This Manitoba template differentiates your work in a crowded field, offering more than maps - it's a storytelling engine. Clients respond better to visuals that contextualize data, much like award-winning presentations at the Royal Architectural Institute of Canada events.
Elevate your next pitch - download and customize now to map out triumphs.
Frequently Asked Questions
What makes this Manitoba map template unique for Keynote?
Its native Keynote optimization with vector edits and animations tailored for Apple's ecosystem, unlike cross-platform alternatives.
Can I add my own data to the slides?
Yes, easily import CSV or shapefiles to populate charts and overlays for personalized insights.
Is it suitable for large-scale printing?
Absolutely, vector format ensures high-quality prints up to poster size without pixelation.
How many slides does it include?
26 versatile slides, from basic maps to advanced infographics.
Are there tutorials for beginners?
The package includes a detailed quick guide with step-by-step instructions.
Does it support collaboration?
Keynote's iCloud sharing makes team edits straightforward.