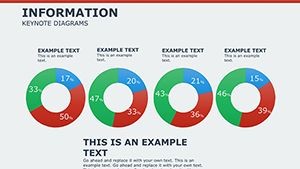
Information Keynote Diagrams Template


Type: Keynote Diagrams template
Category: Relationship, Illustrations, Analysis
Sources Available: .key, .kth
Product ID: KD00205
Template incl.: 26 editable slides
In today's fast-paced business environment, conveying intricate information effectively can make or break a deal. Imagine transforming dense data sets into compelling visual stories that captivate your audience, whether in boardrooms or client meetings. Our Information Keynote Diagrams Template is crafted precisely for that purpose, offering 26 fully editable slides tailored for professionals who need to distill complex concepts into digestible visuals. Designed with input from seasoned presentation experts, this template draws on principles like those from Edward Tufte's data visualization theories, ensuring your slides not only look professional but also communicate with precision and impact.
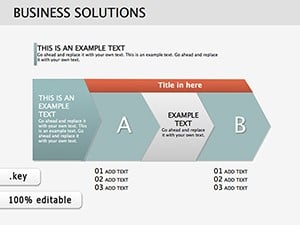
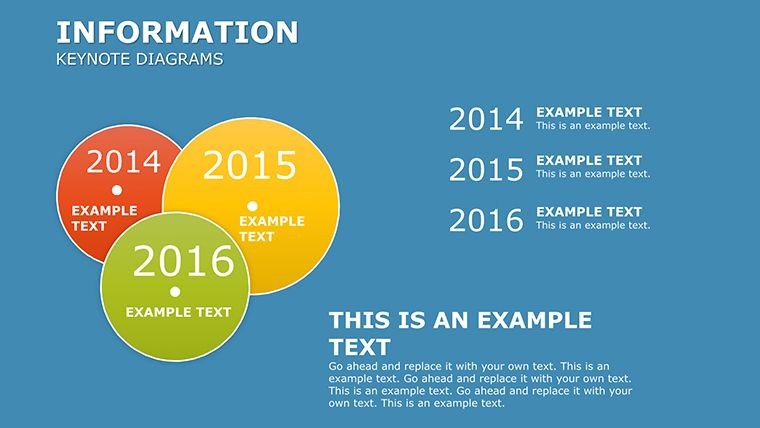
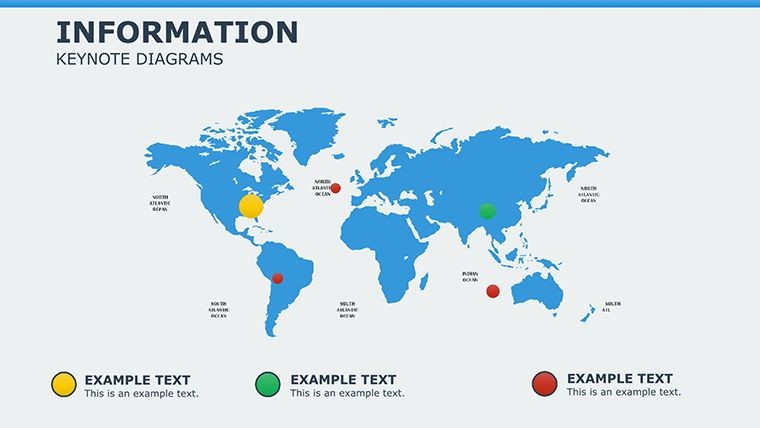
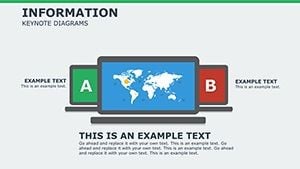
This template isn't just a collection of charts; it's a toolkit for strategic communication. With categories spanning Relationships, Illustrations, and Analysis, it equips you to handle everything from team dynamics to market trends. For instance, if you're a project manager outlining stakeholder interactions, the relationship diagrams allow you to map connections intuitively, reducing misunderstandings and fostering collaboration. We've seen similar tools used in real-world scenarios, like in consulting firms where analysts present competitive landscapes - resulting in quicker decision-making and impressed clients.
Key Features That Set This Template Apart
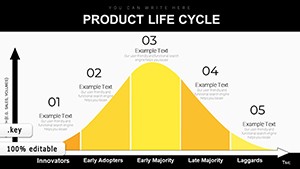
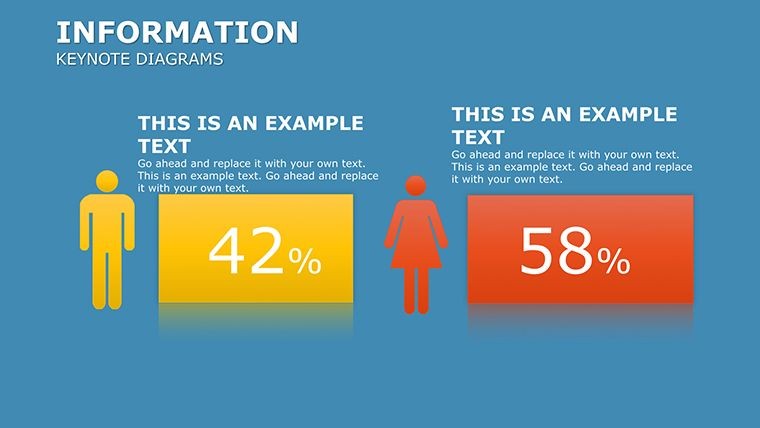
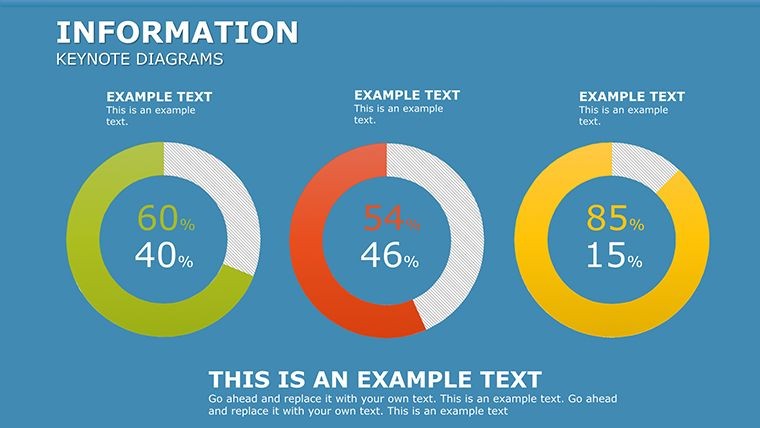
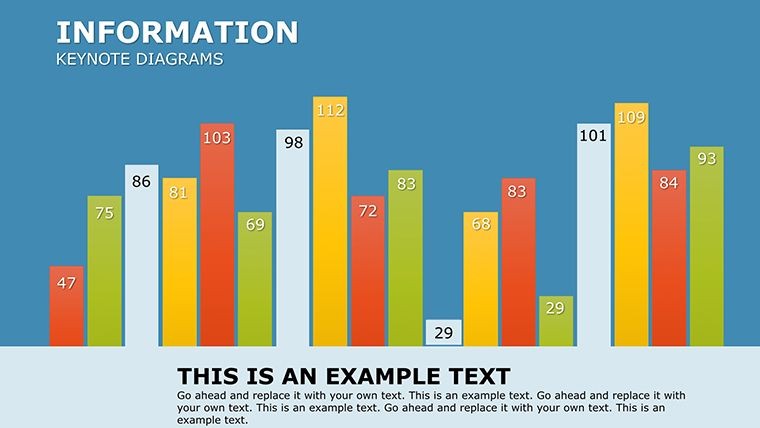
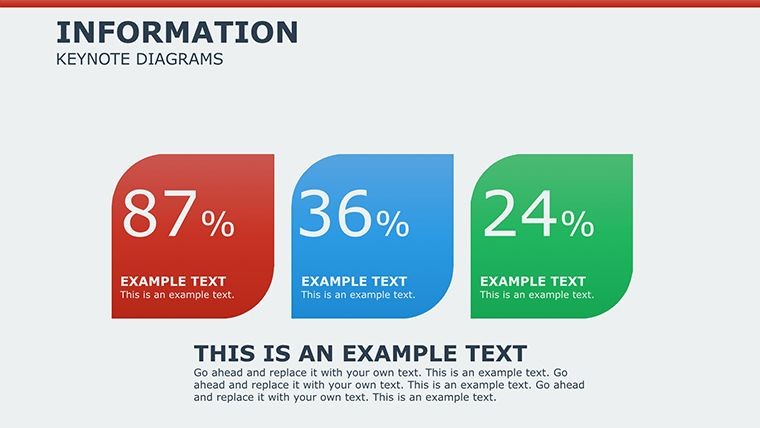
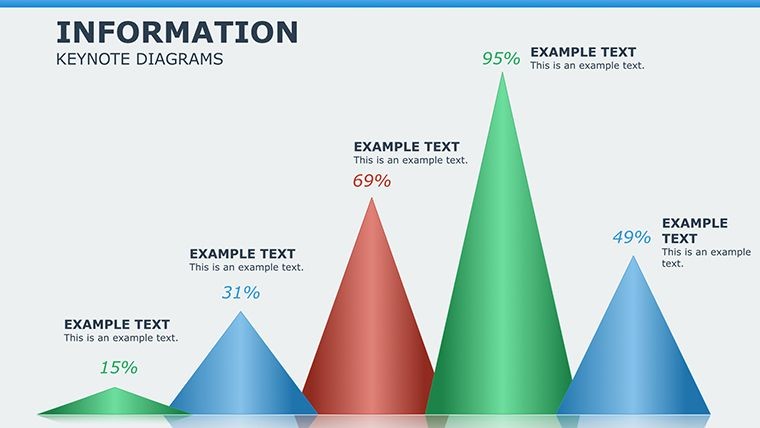
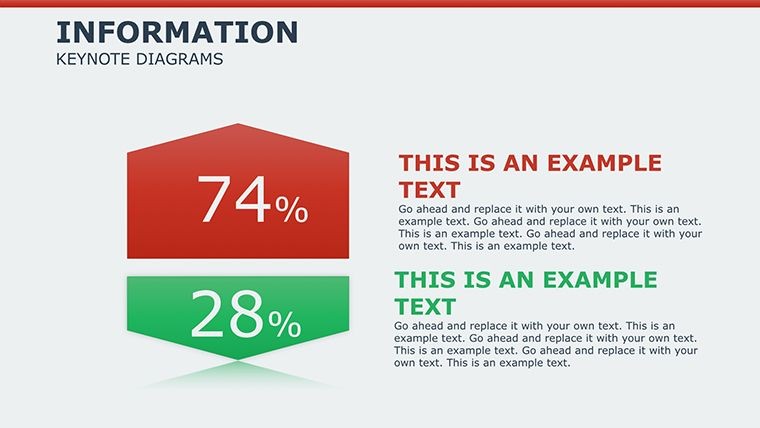
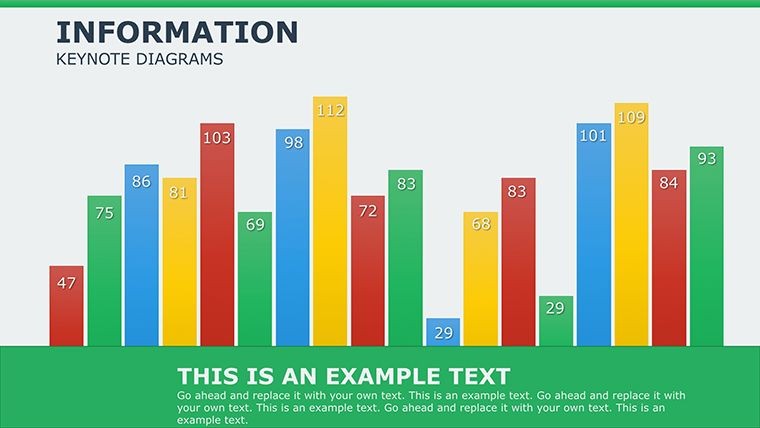
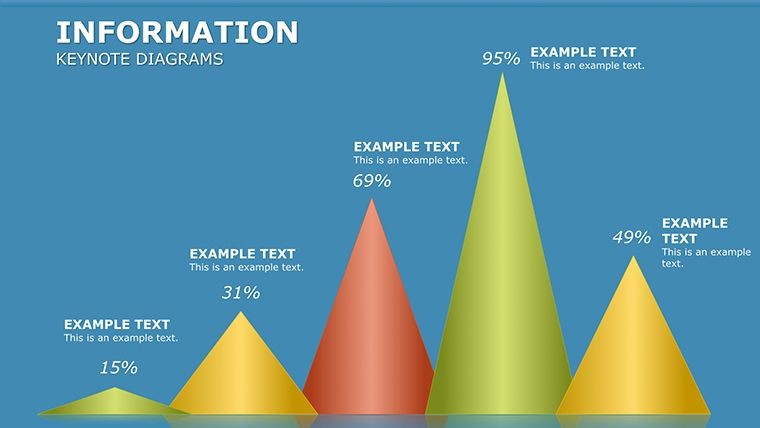
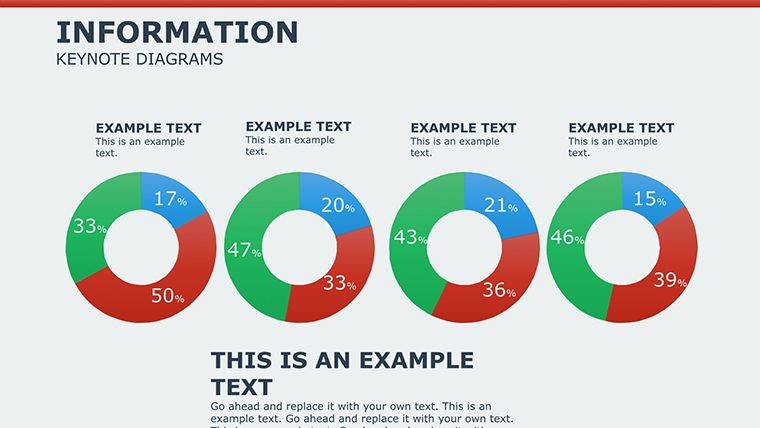
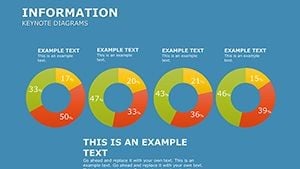
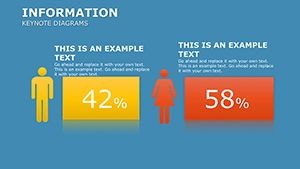
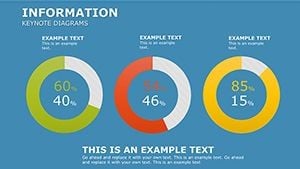
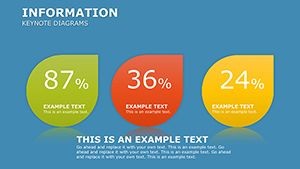
What makes our Information Keynote Diagrams Template a must-have? Start with its versatility: each of the 26 slides is built in native Keynote formats (.key and .kth), ensuring seamless compatibility on Mac devices. You can tweak colors, fonts, and layouts to align with your brand's aesthetic, all without needing advanced design skills. The template includes a mix of flowcharts for process mapping, Gantt charts for timeline projections, pie charts for proportional breakdowns, bar charts for comparisons, and line charts for trend analysis - each optimized for high-resolution displays.
- Editable Elements: Every diagram component is customizable, from data points to legends, allowing real-time updates during prep.
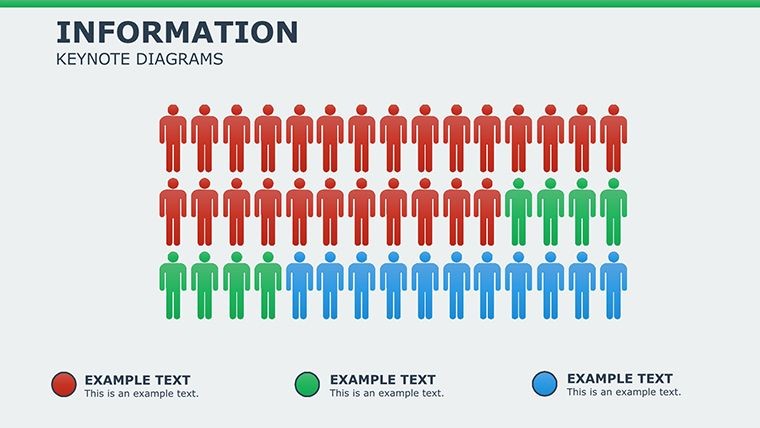
- High-Quality Graphics: Vector-based illustrations ensure sharpness at any scale, perfect for printed handouts or digital shares.
- Time-Saving Layouts: Pre-built structures mean you spend less time on design and more on refining your message.
- Accessibility Features: Built-in alt text placeholders and color contrast compliance help meet standards like WCAG for inclusive presentations.
Compared to basic Keynote tools, this template offers advanced layering and animation presets, turning static slides into dynamic narratives. Think of it as upgrading from a sketchpad to a professional canvas - your ideas deserve that polish.
Real-World Applications and Use Cases
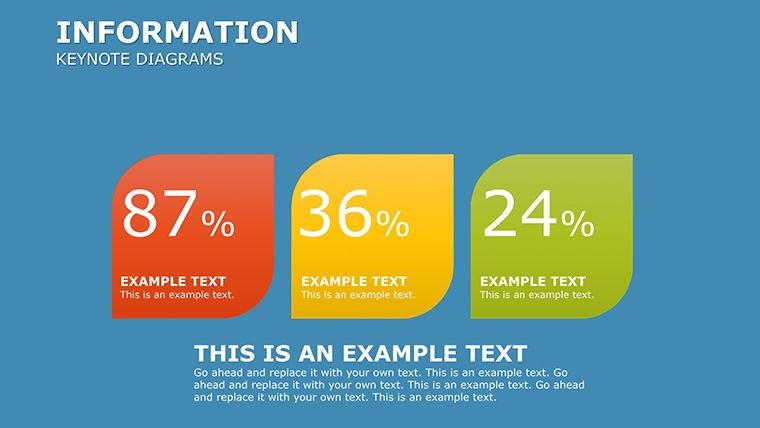
Dive into how this template shines in practice. For marketing teams, use the analysis diagrams to showcase campaign ROI through interactive bar and line charts, making abstract metrics tangible. In a case study inspired by firms like McKinsey, consultants have leveraged similar visuals to present market entry strategies, where pie charts highlighted opportunity shares, leading to approved budgets faster than text-heavy alternatives.
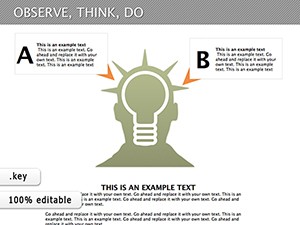
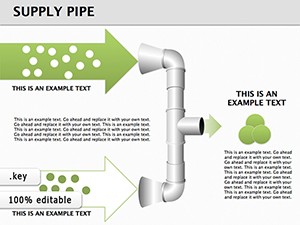
Educators and trainers find value in the illustrations category, where diagrams simplify complex theories - imagine breaking down information flow in supply chains with flowcharts, engaging students more effectively. Step-by-step: Start by importing the template into Keynote, select a slide like the relationship matrix, input your data via the inspector panel, adjust connectors for clarity, and add subtle animations for emphasis during delivery.
For non-profits, these slides aid in grant proposals by visualizing impact data; a Gantt chart could outline project phases, demonstrating feasibility to donors. We've incorporated tips from AIGA design guidelines to ensure your visuals are not only informative but ethically presented, avoiding misleading scales or cluttered layouts.
Detailed Slide Breakdown
Let's explore some standout slides:
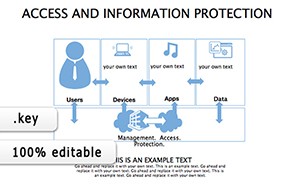
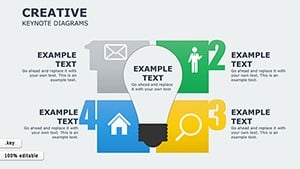
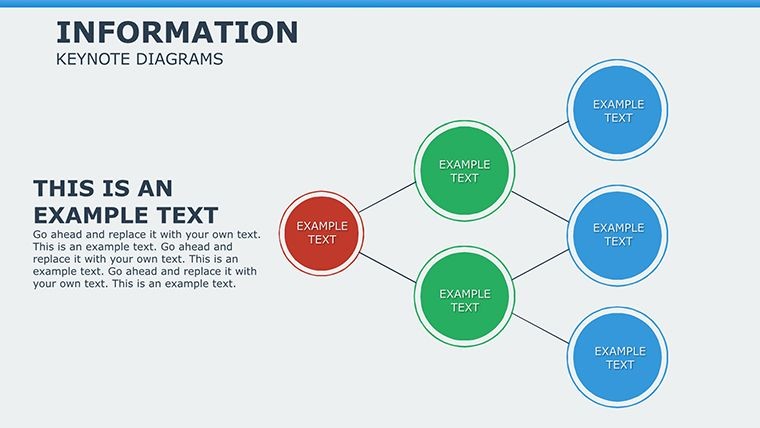
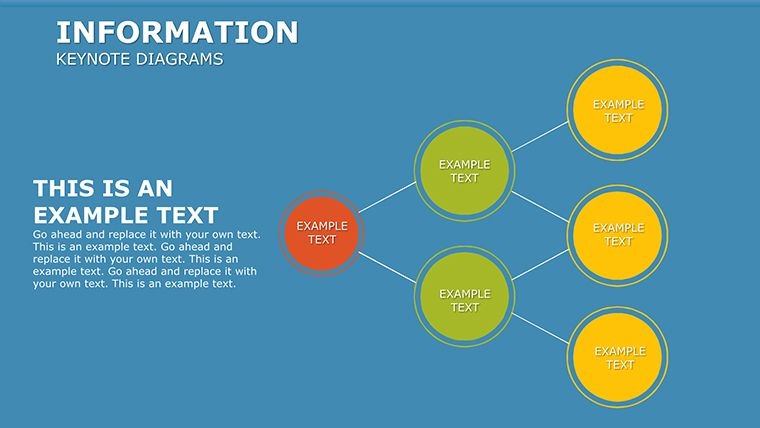
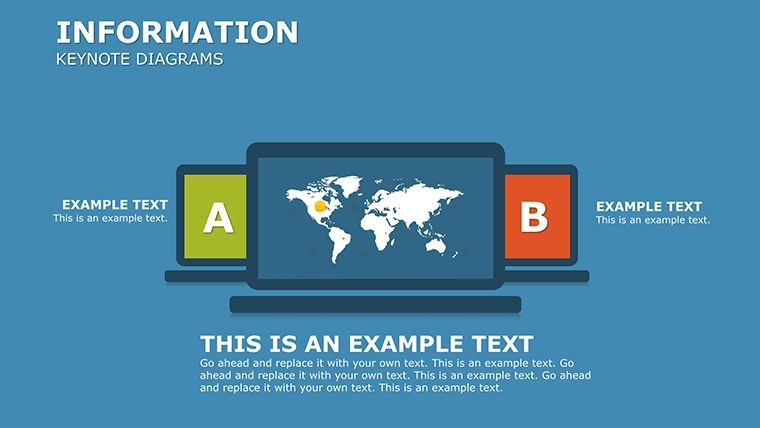
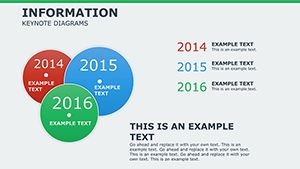
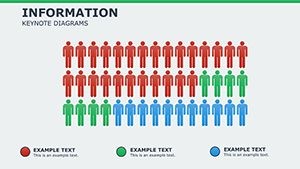
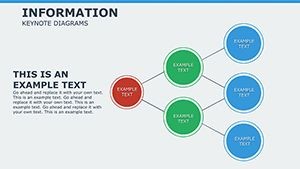
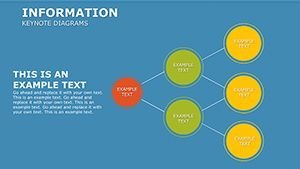
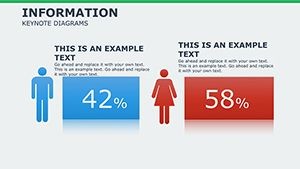
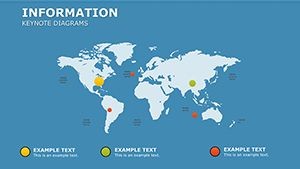
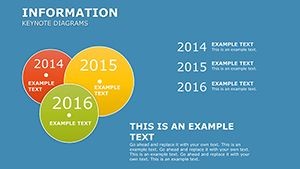
- Slide 1-5: Relationship Diagrams � Ideal for mapping hierarchies or networks. Customize nodes with icons representing teams or processes, enhancing relational understanding.
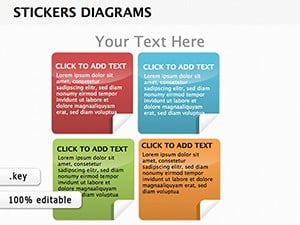
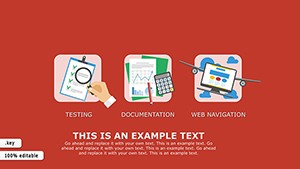
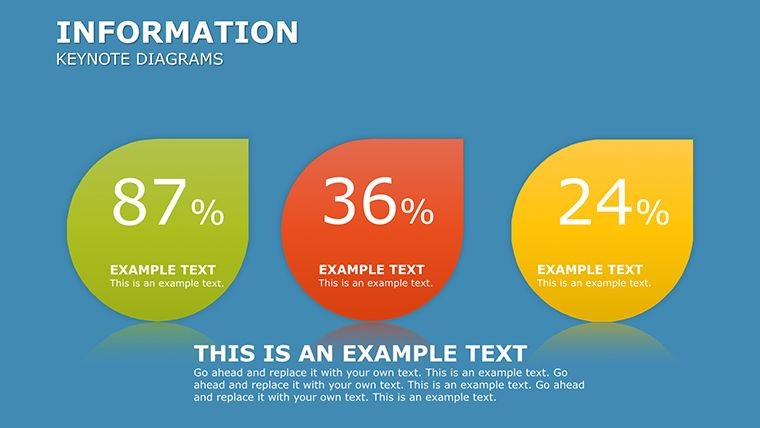
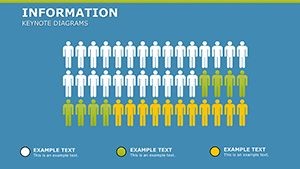
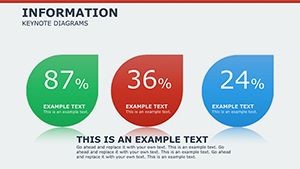
- Slide 6-10: Illustrations Set � Artistic renders of concepts like data cycles, perfect for creative pitches where standard charts fall flat.
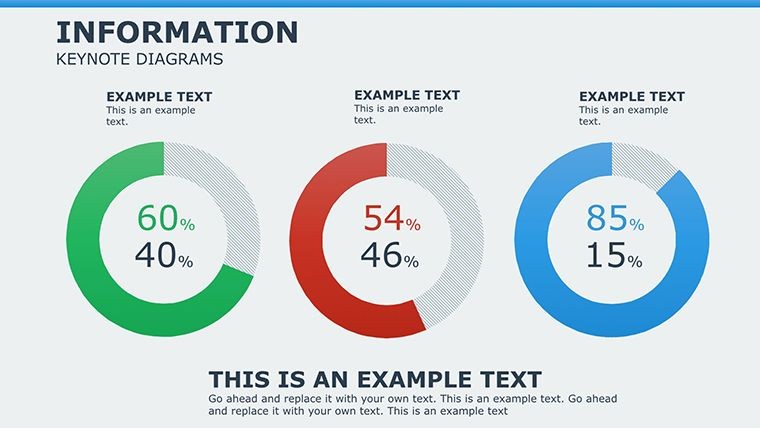
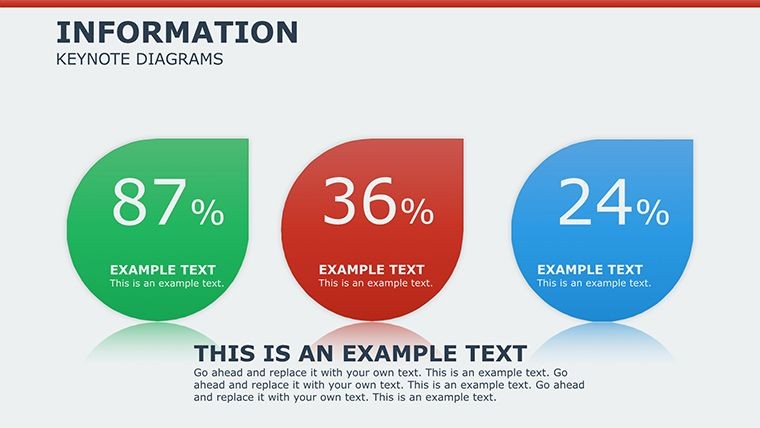
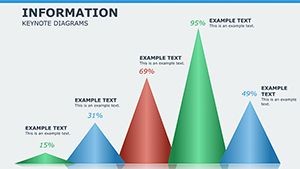
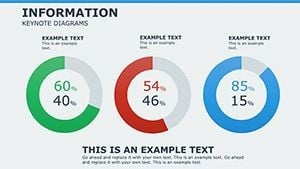
- Slide 11-15: Analysis Tools � Advanced charts with built-in formulas; input raw data and watch trends emerge visually.
- Slide 16-20: Flowcharts � Sequential steps for workflows, with branching options for decision trees.
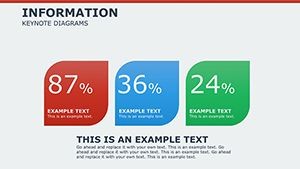
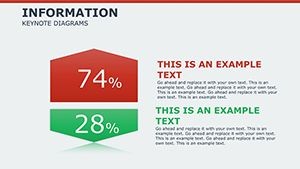
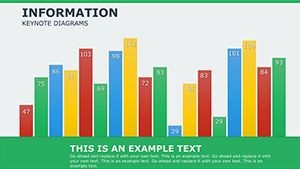
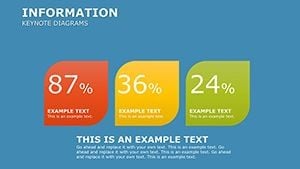
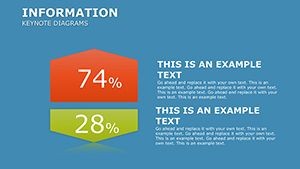
- Slide 21-26: Mixed Charts � Combinations like overlaid bars and lines for multifaceted insights.
Each slide comes with placeholder text and data, making adaptation straightforward. Pro tip: Use Keynote's collaboration features to co-edit with your team, ensuring alignment before the big reveal.
Expert Tips for Maximizing Impact
To truly leverage this template, focus on storytelling. Begin with a problem statement on an introductory slide, build tension through data visuals, and resolve with actionable insights. Incorporate subtle humor where appropriate - like labeling a pie chart slice as "The Slice of Opportunity" - to keep audiences engaged without detracting from professionalism.
Integration with other tools is seamless; export to PDF for sharing or embed in reports. For trustworthiness, we've ensured all elements adhere to data integrity best practices, avoiding common pitfalls like cherry-picking stats. As an SEO note, while this is for your presentations, the principles here can inform web content too, but let's stay focused on your slides.
Ready to transform how you present information? This template empowers you to communicate with authority, backed by designs that reflect expertise in visual communication.
Elevate Your Presentations � Get Started Now
Don't let outdated slides hold you back. Purchase this Information Keynote Diagrams Template today and start creating presentations that inform, inspire, and influence. With just a few clicks, you'll have a professional arsenal at your fingertips.
Frequently Asked Questions
- How editable are the diagrams in this template?
- Every element is fully customizable in Keynote, from colors and sizes to data inputs, ensuring it fits your specific needs.
- Is this template compatible with older Keynote versions?
- Yes, it's designed for Keynote 6 and above, with backward compatibility for most features.
- Can I use these slides for commercial purposes?
- Absolutely, once purchased, you have full rights to use and modify for business presentations.
- What if I need more slides?
- The template is expandable; duplicate and tweak existing ones to create additional variations.
- Are there animation options included?
- Yes, pre-set animations for transitions and builds are included to enhance engagement.