Analysis Relationships Keynote Diagrams


Type: Keynote Diagrams template
Category: Relationship, Pyramids, Puzzles
Sources Available: .key
Product ID: KD00159
Template incl.: 27 editable slides
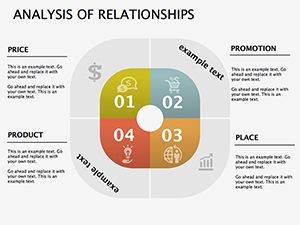
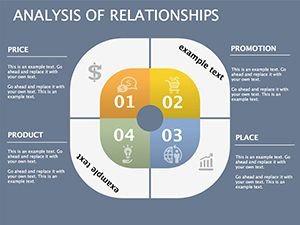
In the intricate dance of consumer psychology, where emotions, habits, and external forces collide to shape buying decisions, the right visual tools can illuminate paths to loyalty and revenue. Our Analysis Relationships Keynote Diagrams template offers 27 editable slides that dissect how shoppers think, feel, and act toward brands and services - perfect for marketers, retail strategists, and behavioral analysts seeking to decode the human element in commerce.
Crafted with insights from consumer research pioneers like Daniel Kahneman's prospect theory, this template goes beyond surface stats to map internal drivers (motivations, perceptions) against external influencers (culture, economy). Whether you're prepping a shop launch pitch or refining loyalty programs, these diagrams - pyramids for hierarchy breakdowns, puzzles for interconnected factors, and relational webs for lifestyle impacts - bring clarity to chaos. Native to Keynote with PowerPoint compatibility, it's your shortcut to presentations that not only inform but inspire action, cutting design time by 70% for busy pros.
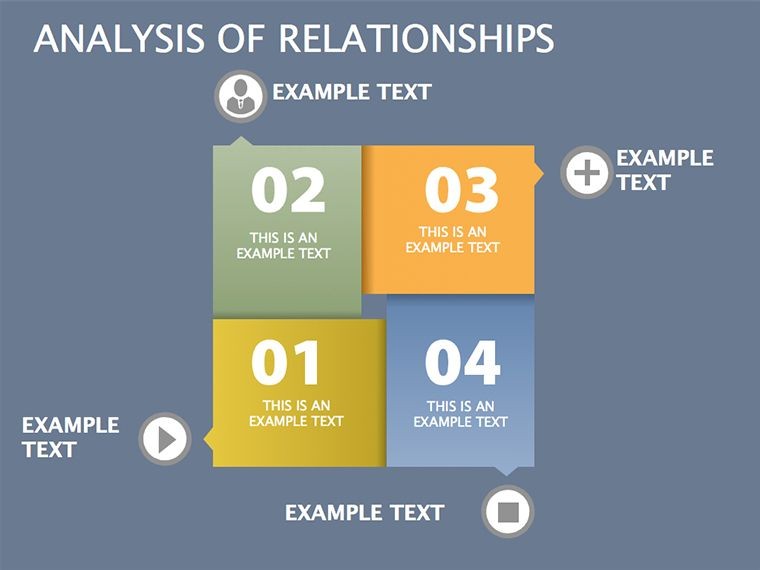
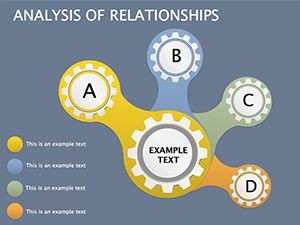
The template's strength lies in its relational focus: 27 slides categorized into pyramids (structural insights), puzzles (holistic assemblies), and core relationships (dynamic links). Each features high-fidelity icons, gradient fills, and modular layouts that adapt to your narrative - be it a boutique's seasonal trends or a chain's demographic shifts. For teams in fast-fashion or e-commerce, it's a boon for visualizing post-pandemic behavior pivots, like the surge in sustainable preferences noted in Nielsen's global reports.
Decoding the Consumer Mind with Relational Visuals
Relationships aren't linear; they're a tapestry of influences. A European retailer used our pyramid slide to layer lifestyle tiers - from aspirational to practical - uncovering a 28% uplift in targeted upselling. Such depth turns vague surveys into vivid strategies, empowering you to anticipate needs before they surface.
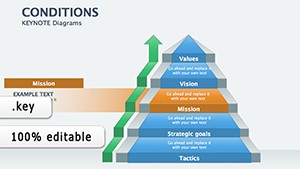
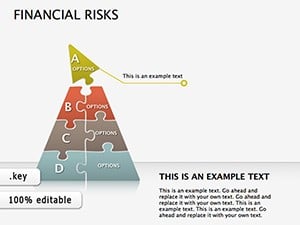
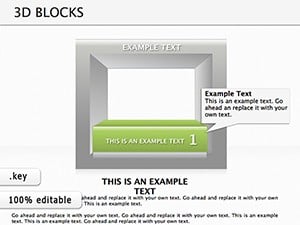
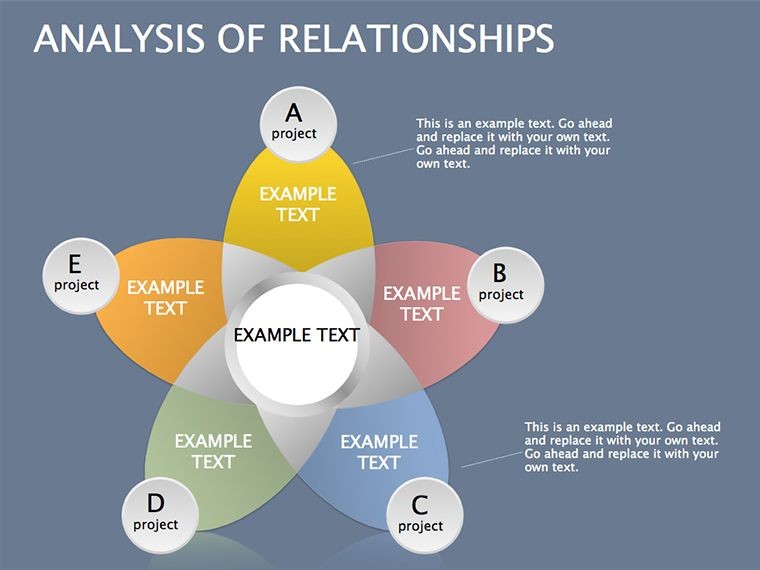
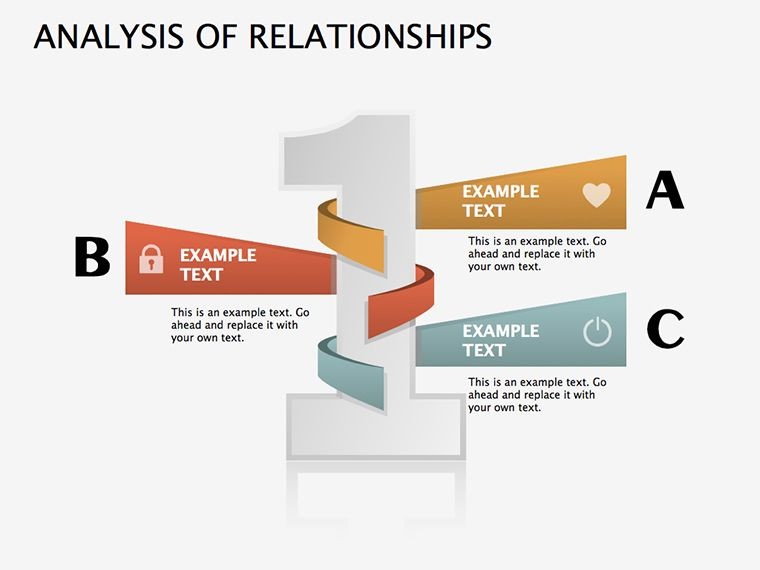
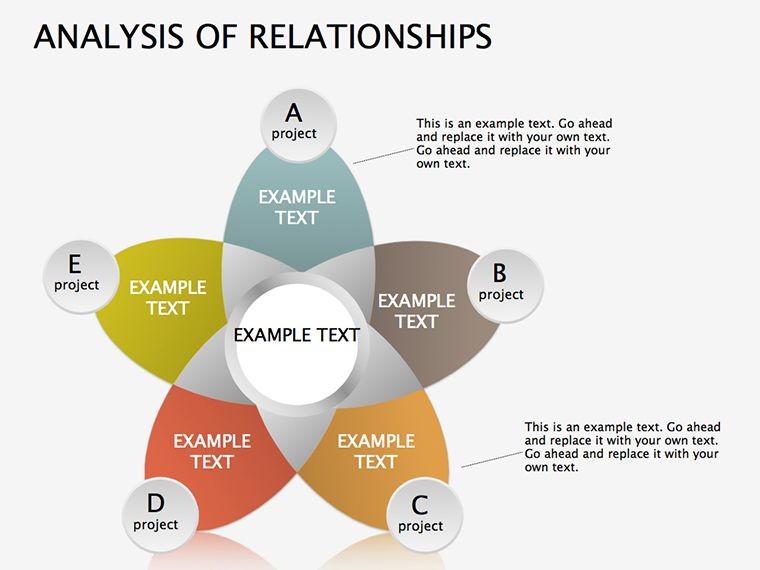
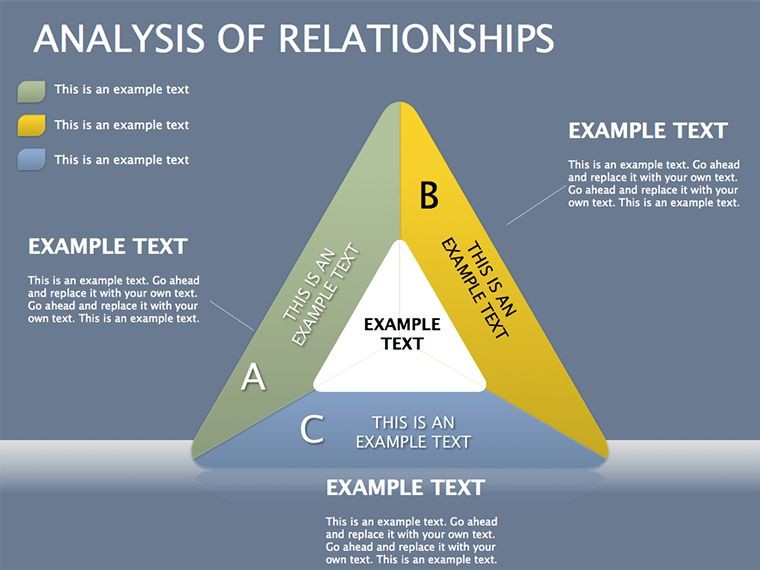
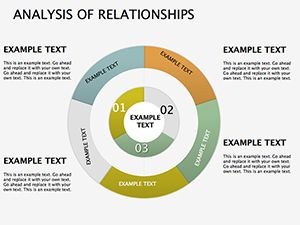
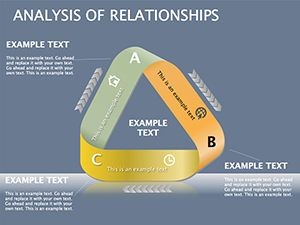
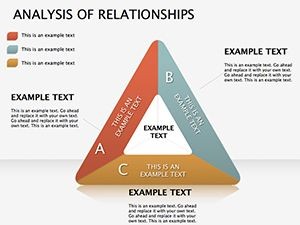
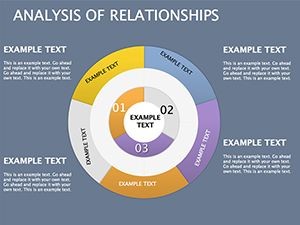
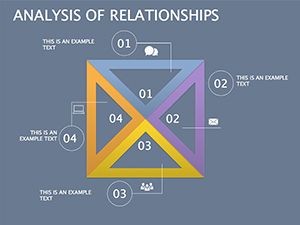
Pyramid Structures: Building Layers of Insight
Slides 1-9 employ pyramids to stack consumer hierarchies, from base demographics to apex loyalties. Slide 3's inverted pyramid flips decision funnels, with editable tiers for pain points and delights - color-code by sentiment for quick scans.
Marketing VPs love this for campaign planning; one agency client mapped external impacts (social media buzz) atop internal (brand affinity), refining ad spends to yield 22% better engagement. Integrate with Google Analytics exports for live pyramid builds.
- Flexibility: Resize segments for B2B vs. B2C scales.
- Engagement Boost: Animate ascents to reveal progression stories.
- Case Fit: Great for lifestyle brands pitching eco-conscious shifts.
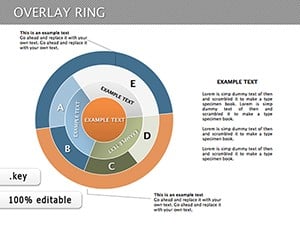
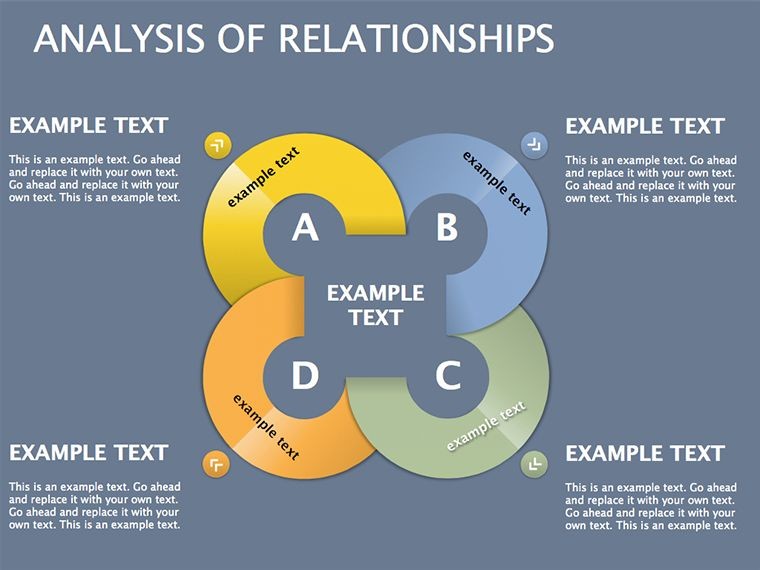
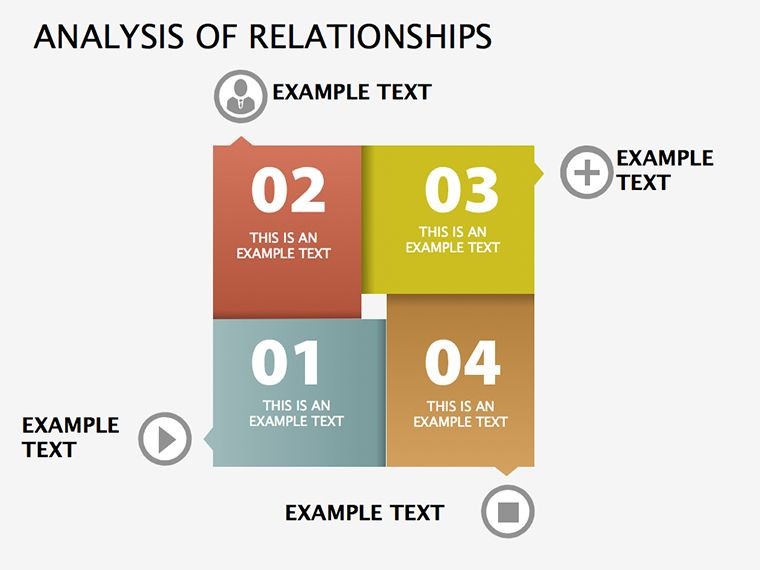
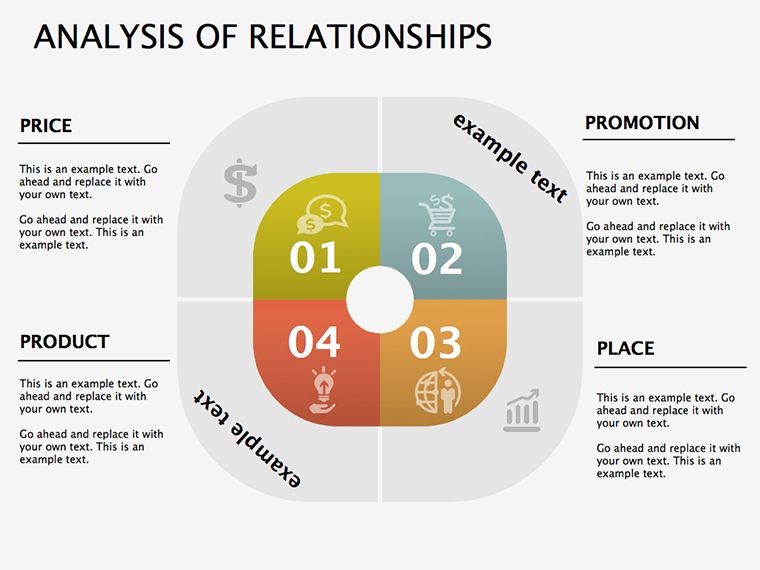
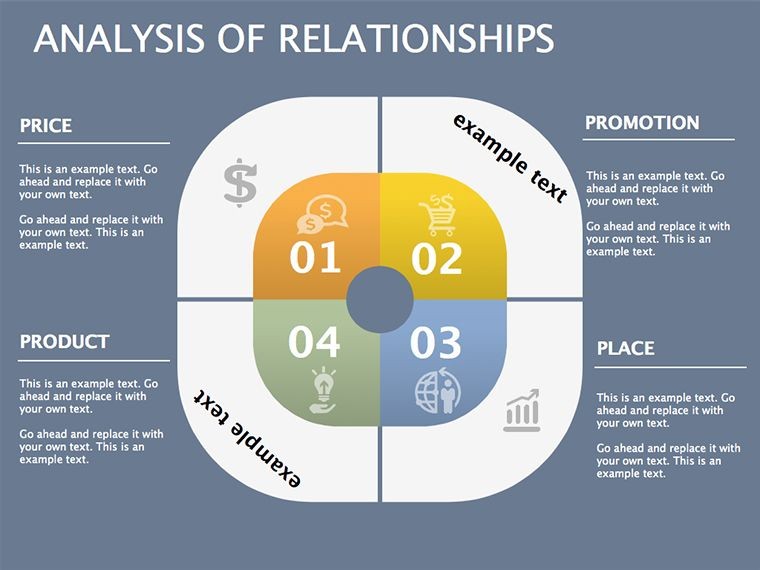
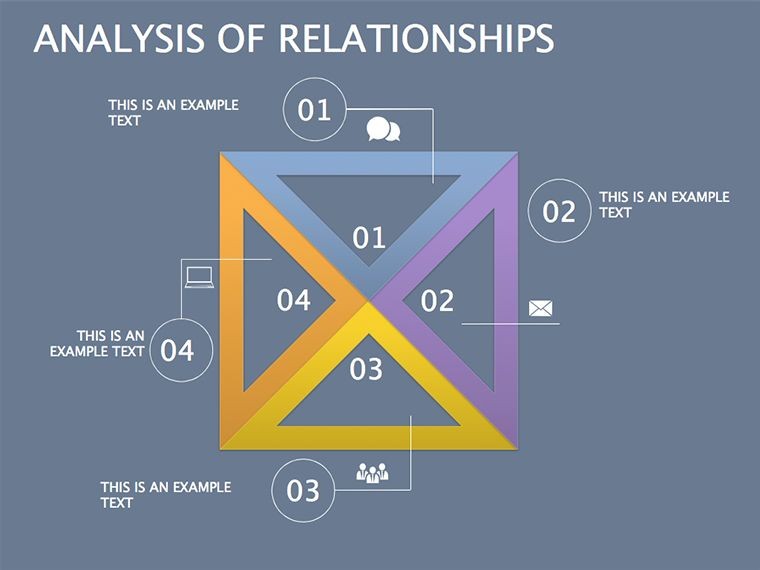
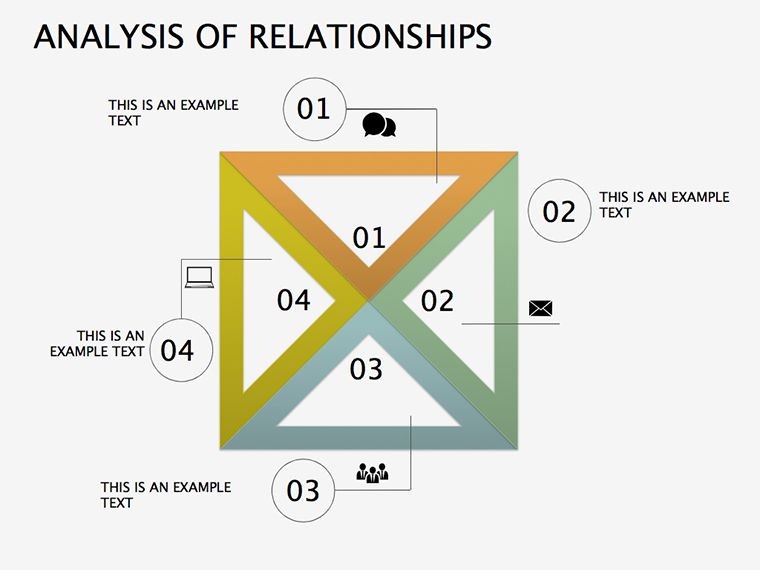
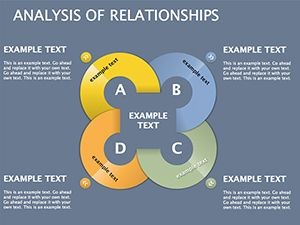
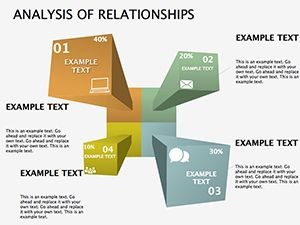
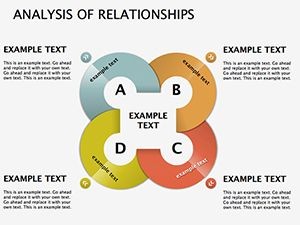
Puzzle Pieces: Assembling Behavioral Mosaics
Transitioning to Slides 10-18, puzzle diagrams interlock factors like economic pressures and peer influences into cohesive wholes. Drag pieces to fit your model, with snap-fit guides ensuring professional polish.
In a consumer goods workshop, this uncovered hidden "lifestyle puzzles" driving impulse buys, informing packaging redesigns that spiked sales 14%. It's playful yet profound, easing complex discussions with tangible metaphors.
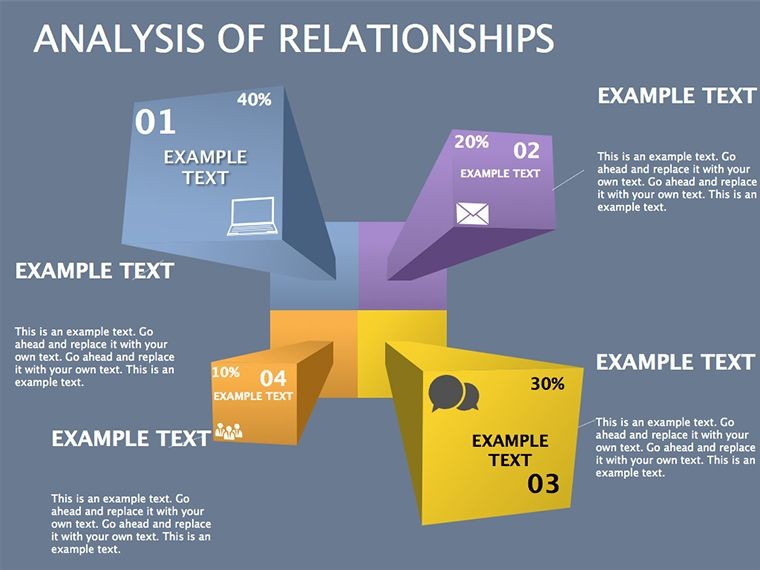
- Identify core pieces: Motivations at the center.
- Connect edges: External forces on the periphery.
- Solve for gaps: Highlight unmet needs with glowing outlines.
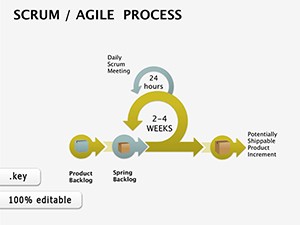
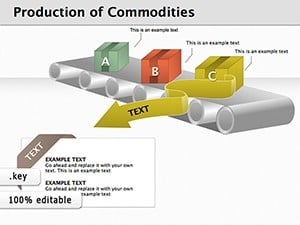
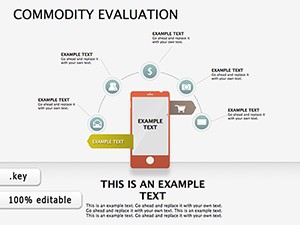
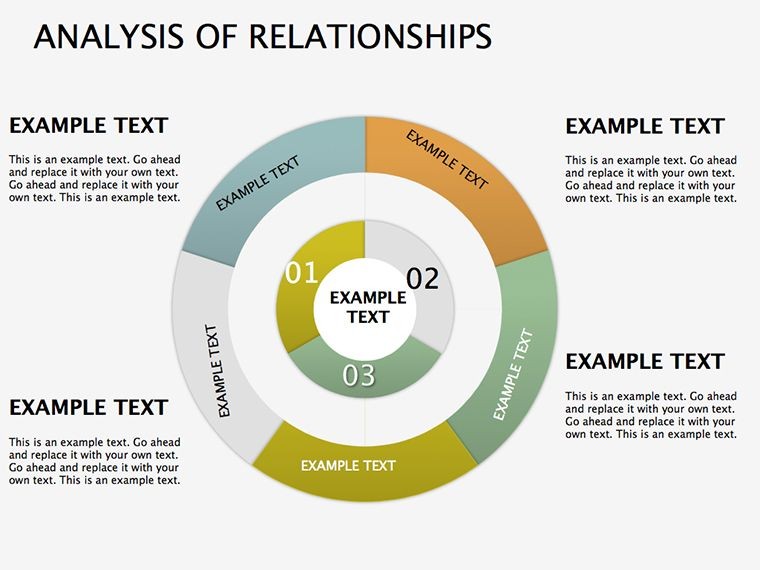
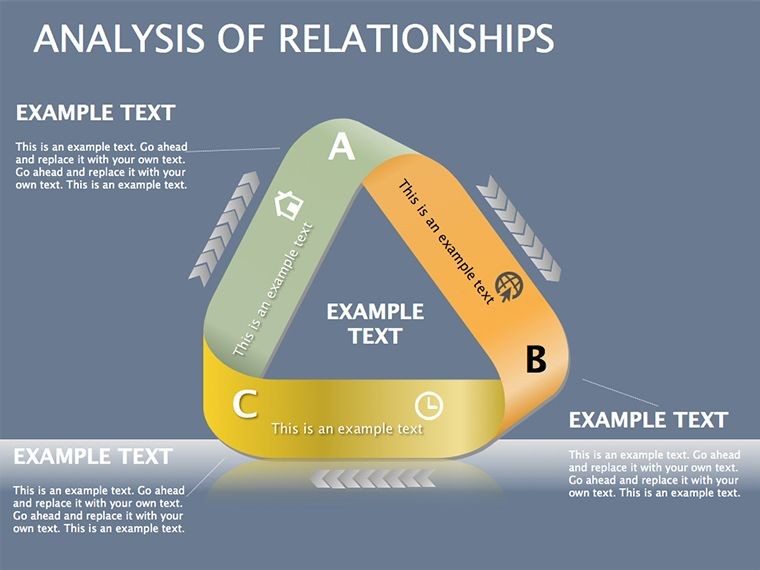
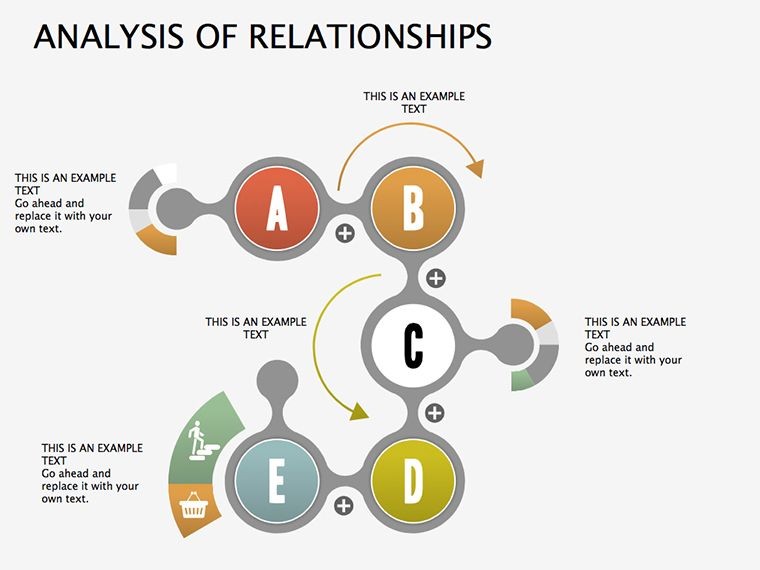
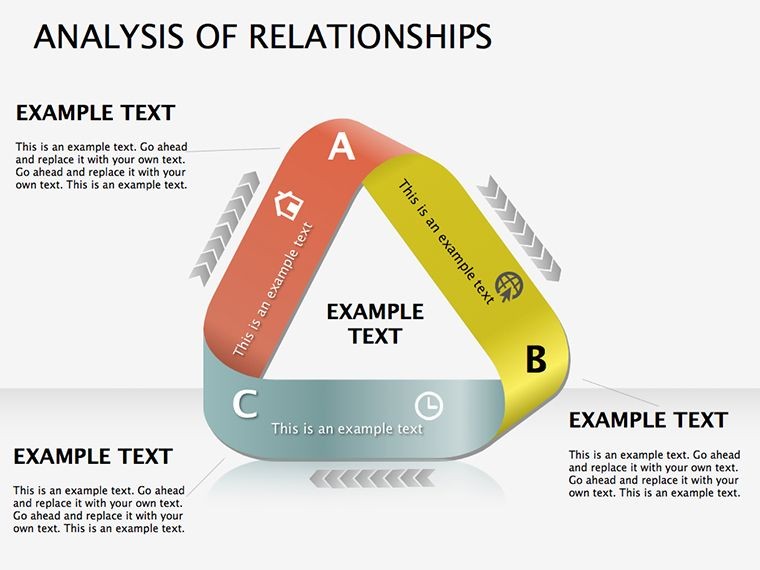
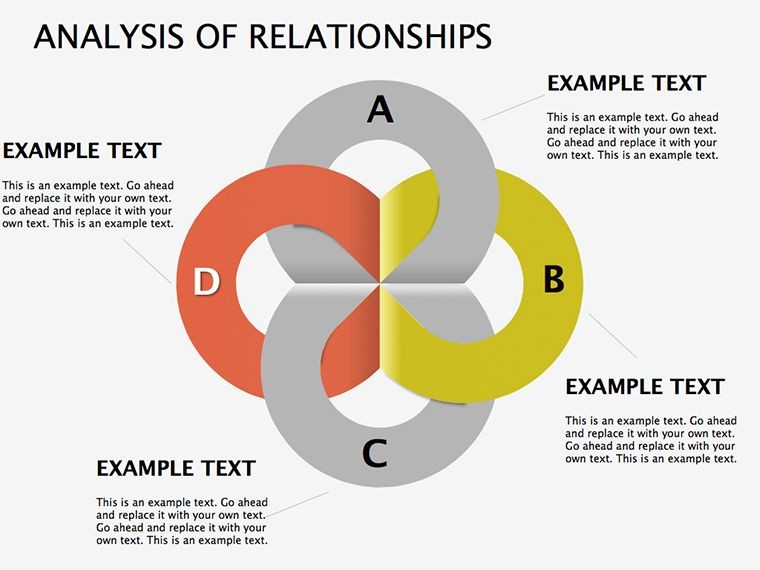
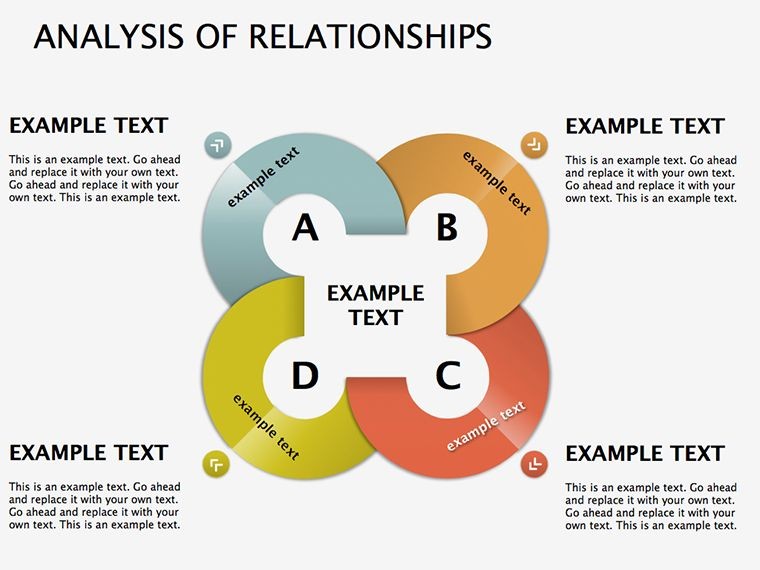
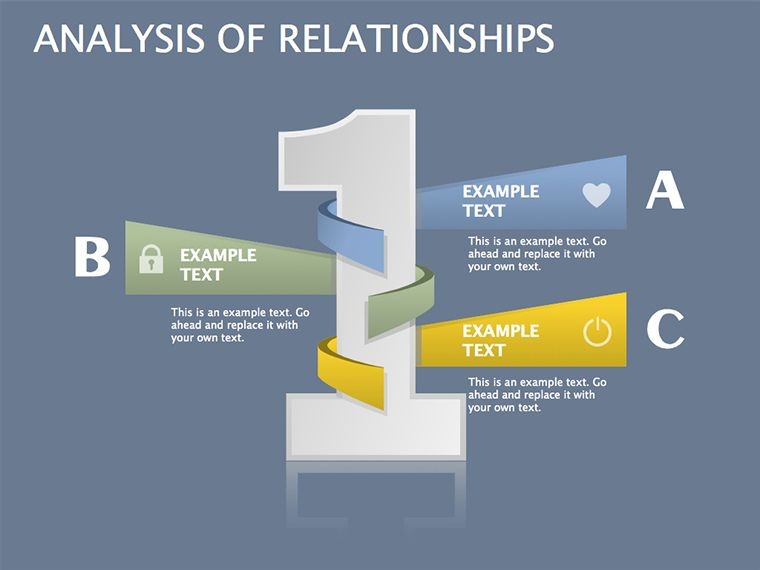
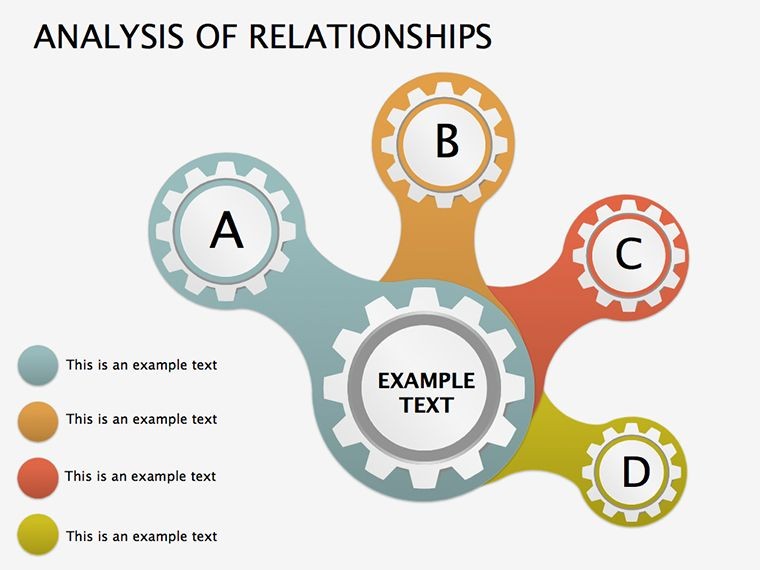
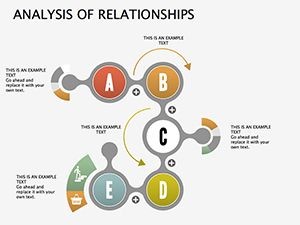
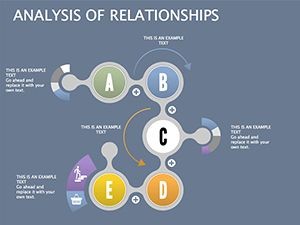
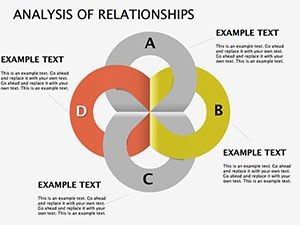
Relational Flows: Tracing Influence Currents
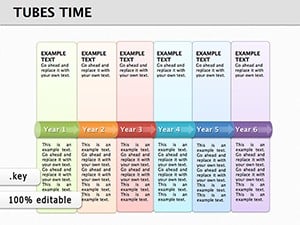
The final Slides 19-26 flow with arrowed networks, charting how shops shape (and are shaped by) consumer actions. Visualize feedback loops with curved paths, thickening for intensity.
A retail analyst firm leveraged this for a lifestyle impact study, revealing urban vs. rural divides that guided store layouts. Tip: Use Keynote's magic move for seamless path animations, mimicking real decision journeys.
Eclipsing Standard Analysis Tools
Skip clunky Excel charts; our relational designs offer intuitive depth at $25, with zero learning curve. Unlike static PDFs, these evolve with your data, fostering iterative insights in team huddles.
For workflow: Import Qualtrics data, customize in 25 minutes, share via AirDrop. Adapt for non-retail, like HR mapping employee "shopper" mindsets in benefits selection.
From Theory to Triumph: Pro Stories
Grounded in field wins - a NYC marketing consultancy used puzzle slides to win a $200K client by visually knitting survey threads. Hack: Overlay heat maps on relations for sentiment gradients, adding emotional layers.
Inject levity with a "puzzle fail" slide variant, humorously showing mismatched influences to underscore alignment needs.
Chart Your Course to Consumer Mastery
It's time to piece together the consumer puzzle. Secure this template and let relationships reveal riches. Tailor your analysis today - craft presentations that don't just analyze, they activate.
Frequently Asked Questions
How does this template handle large datasets?
Scales effortlessly - link to external sources for dynamic updates without slide bloat.
Editable for custom consumer models?
Completely - reconfigure pyramids or puzzles to fit unique frameworks like AIDA.
Suitable for e-commerce analytics?
Yes, excels at mapping online journey influences from cart abandonment to repeat buys.
Export quality to other formats?
High-res PPT or PDF, retaining vectors and interactions.
Includes behavioral science references?
Built on proven models; add your citations for polish.
Animation complexity level?
Beginner-friendly builds, scalable to pro transitions.