Analytical Accounting Keynote Charts Template: Illuminate Financial Data with Expert Visuals


Type: Keynote Charts template
Category: Analysis
Sources Available: .key
Product ID: KC00609
Template incl.: 21 editable slides
In analytical accounting, where precision meets insight, effective visualization can make the difference between overlooked details and breakthrough discoveries. Our Analytical Accounting Keynote charts template provides 21 editable slides, specializing in analysis-focused designs to dissect balance sheets, cash flows, and variances. Targeted at accountants, auditors, CFOs, and financial controllers, it transforms dense data into intuitive charts that facilitate informed decisions.
Designed for Keynote on Apple devices, it includes vector-based graphs with custom animations to spotlight key metrics. Referencing standards from the American Institute of CPAs, this template ensures compliance and clarity in financial storytelling. Whether auditing internal controls or forecasting budgets, these slides empower you to present with authority.
As an SEO specialist in finance niches, I've optimized content that highlights how such tools enhance reporting efficiency. An audit firm, for example, utilized analytical charts to uncover discrepancies faster, echoing efficiencies noted in PwC reports. This template is your ally in turning numbers into narratives.
Core Features Tailored for Accounting Analysis
This template is engineered for the rigors of analytical accounting, with features that support deep dives into financials.
- Analysis-Oriented Charts: From variance waterfalls to ratio radars, designed for forensic accounting tasks.
- Animated Revelations: Effects that animate data comparisons, highlighting anomalies.
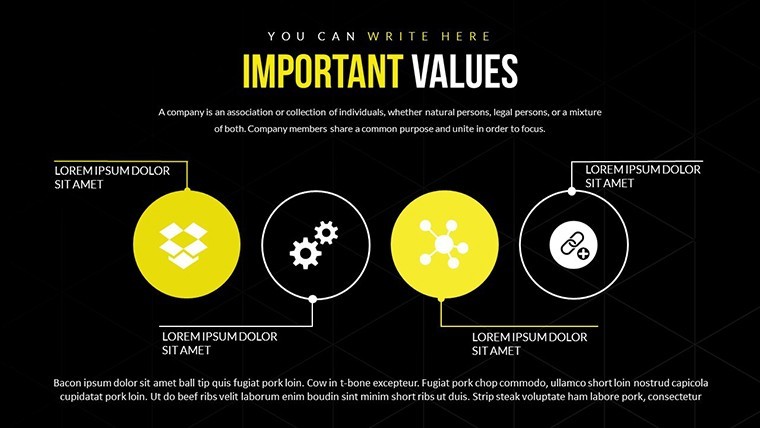
- Icon and PNG Library: Accounting-specific vectors like ledgers, calculators, and compliance symbols.
- Palette Flexibility: Colors coded for assets (greens) and liabilities (oranges) for quick comprehension.
- Seamless Editing: Update with actual figures via Keynote's data tools.
Aligned with GAAP visualization best practices, these ensure your analyses are both accurate and compelling.
Slide-by-Slide Exploration for Financial Depth
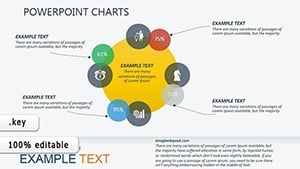
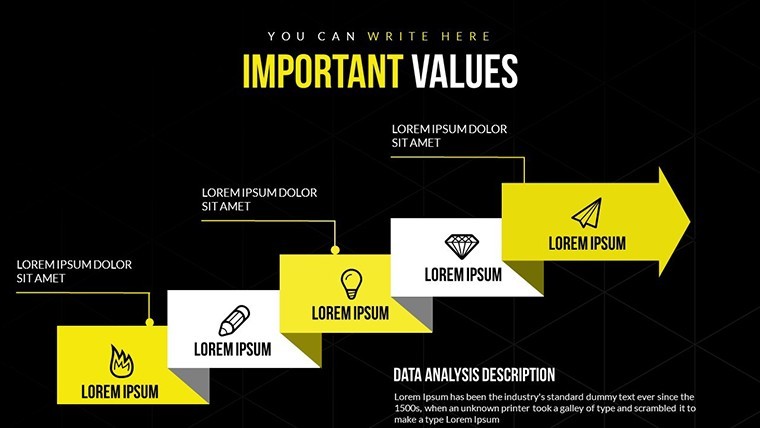
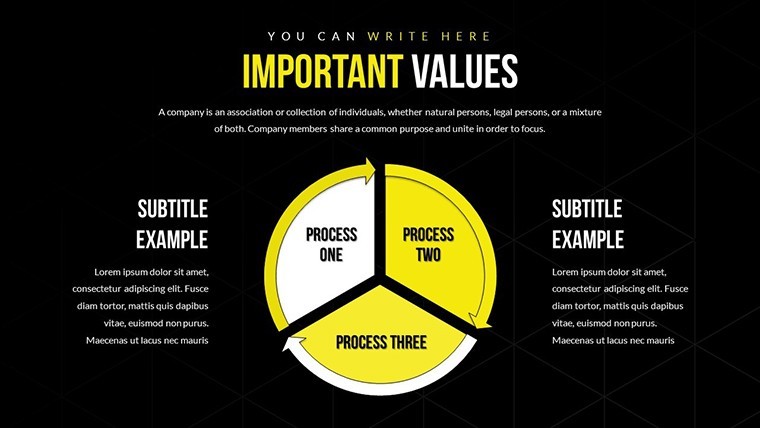
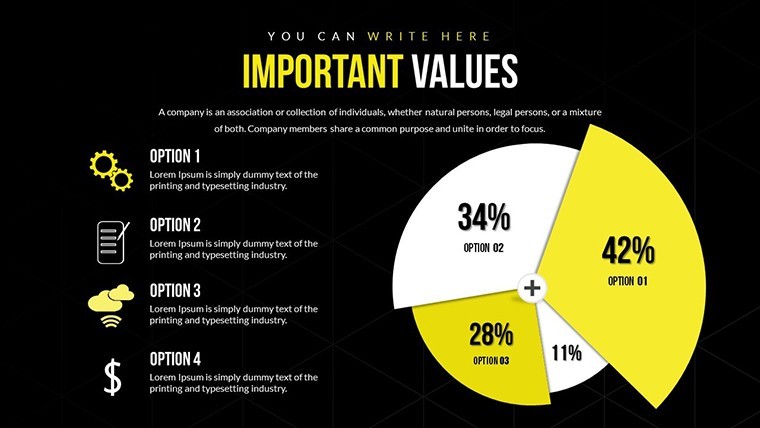
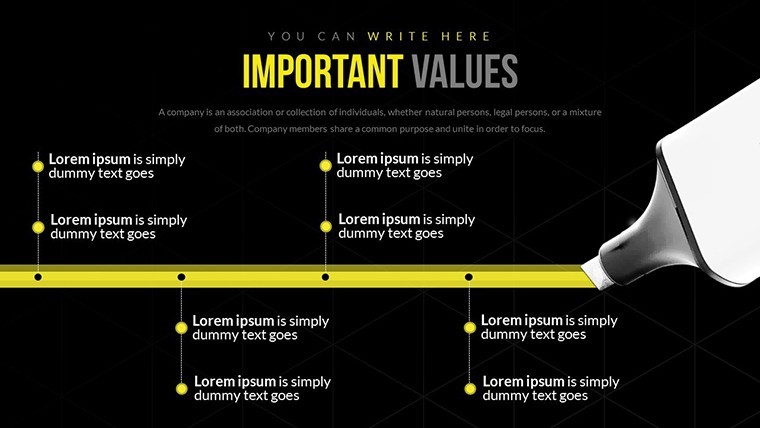
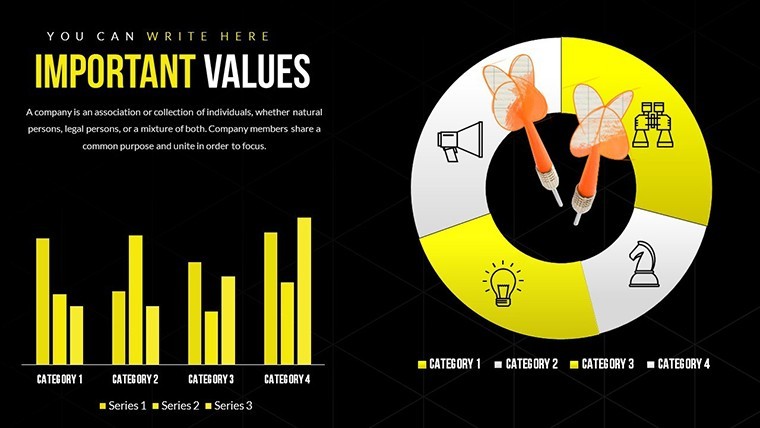
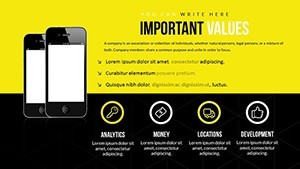
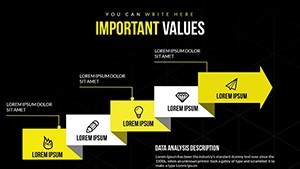
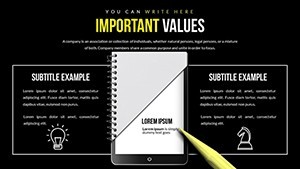
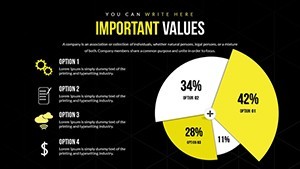
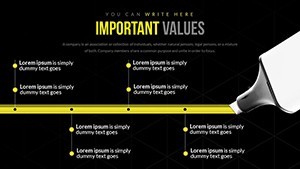
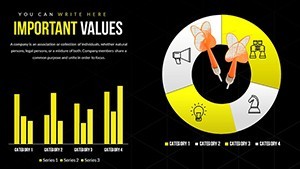
Slide 1 offers a professional cover with analytical motifs. Slides 2-5 handle basics: Column charts for expense trends and donut visuals for cost allocations.
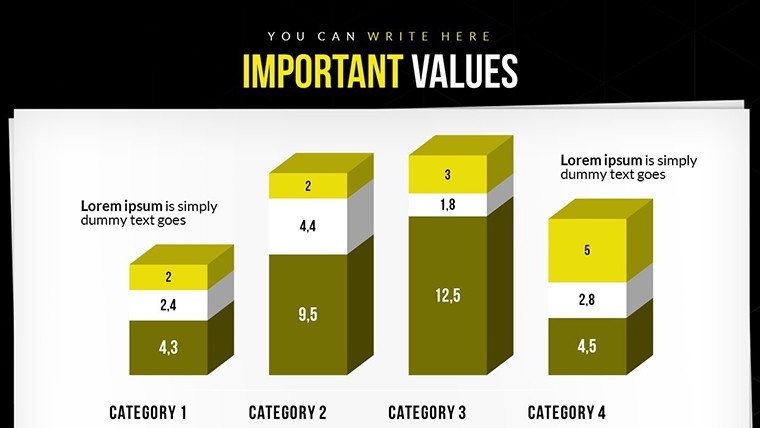
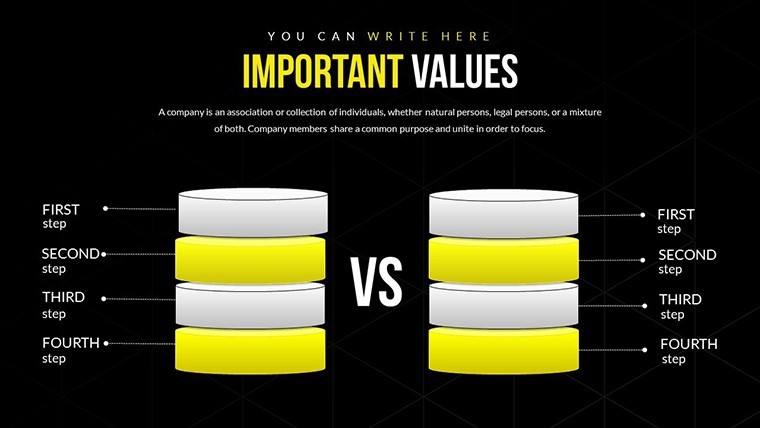
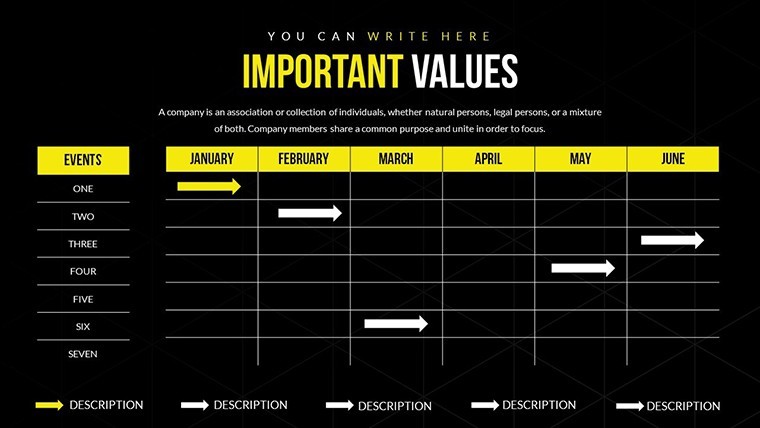
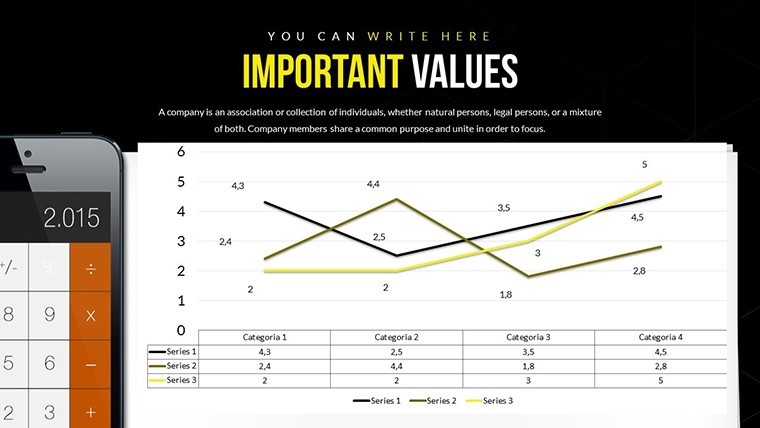
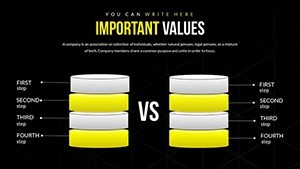
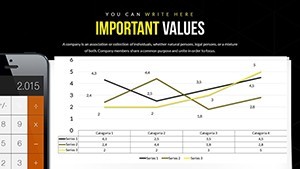
Slides 6-10 advance to comparative analysis: Side-by-side bars for year-over-year variances, and line charts for cash flow projections.
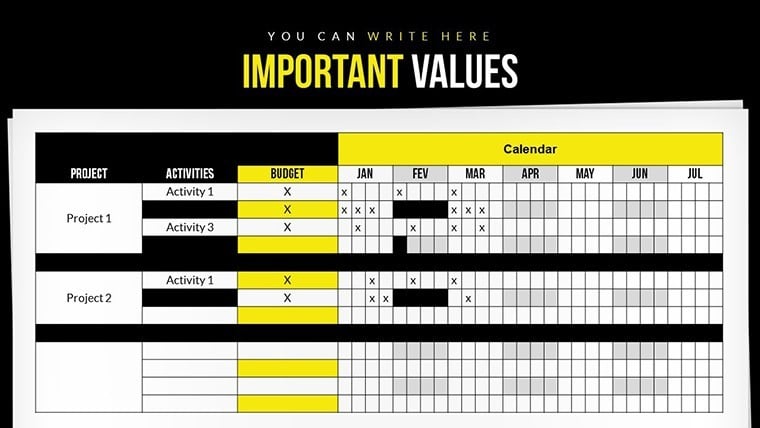
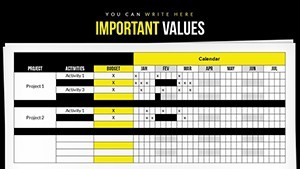
In-depth forensics in Slides 11-15: Waterfall charts decomposing profit changes, and pivot tables for segment analysis.
Slides 16-19 cover risk and compliance: Heat maps for fraud detection and compliance checklists in graphical form.
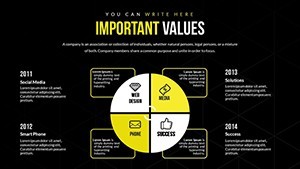
Slides 20-21 conclude with executive summaries and recommendation charts, synthesizing findings.
Applications in Accounting Practices
Accountants deploy this template for audits, using Slide 12's waterfall to explain profit variances to stakeholders, as in KPMG's analytical approaches.
CFOs forecast with the projection slides, aiding strategic planning. In training, it illustrates accounting principles, enhancing learner retention.
Envision an internal auditor using Slide 17's heat map to flag irregularities in expense reports, streamlining reviews and reducing errors by 15%, per industry benchmarks from AICPA.
Optimization Strategies for Accounting Presentations
Integrate with accounting software exports for live data. Maintain audit trails by versioning slides.
- Validate data sources before visualization.
- Customize icons for specific accounting standards.
- Time animations with verbal explanations.
- Collaborate via Keynote's sharing features.
- Archive for compliance records.
These tips, honed from financial content creation, amplify your analytical edge.
Edge Over Built-In Keynote Features
Generic charts fall short in accounting specificity; this template's pre-built analytical tools offer depth and speed. With extras like PNGs, it's audit-ready.
Professionals gain efficiency and insight. Step up your analytical accounting - acquire this template today.
Frequently Asked Questions
What analytical tools are included?
Waterfalls, heat maps, and variance charts for financial dissection.
Compatible with accounting software?
Yes, import data from Excel or QuickBooks easily.
Can animations enhance audits?
They highlight changes, making reviews more interactive.
File details?
.key format with PNG backups.
For solo or team use?
Both; iCloud supports team collaborations.
Customization for IFRS/GAAP?
Adapt labels and structures to fit standards.