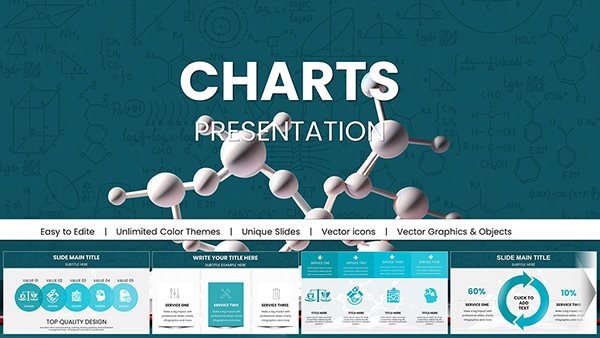
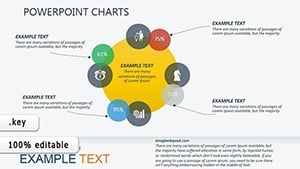
Data Analysis Graphs Keynote Charts Template


Data drives decisions in every sector, but raw numbers alone rarely inspire action. Enter our Data Analysis Graphs Keynote Charts Template - a game-changer for turning spreadsheets into storytelling masterpieces. With 20 versatile, editable slides, this template caters to business analysts, researchers, and presenters who need to visualize trends, comparisons, and insights effectively. Imagine captivating a boardroom with sleek line graphs showing sales growth or enlightening students with bar charts on research findings. This isn't just a template; it's your shortcut to professional-grade presentations that communicate complexity with elegance and precision.
Crafted with the user in mind, the template offers extensive customization, from color schemes that match your brand to font styles that enhance readability. It's fully compatible with Keynote, ensuring no hiccups in your creative process. Drawing from data visualization best practices, like those championed by Edward Tufte in 'The Visual Display of Quantitative Information,' it prioritizes clarity over clutter. Whether you're an executive summarizing quarterly metrics or a teacher illustrating statistical concepts, the benefits are clear: faster preparation, higher engagement, and stronger persuasion.
Essential Features for Data Mastery
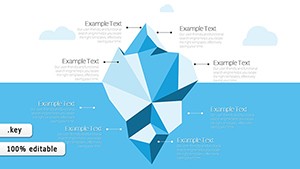
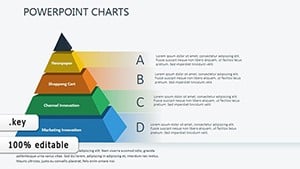
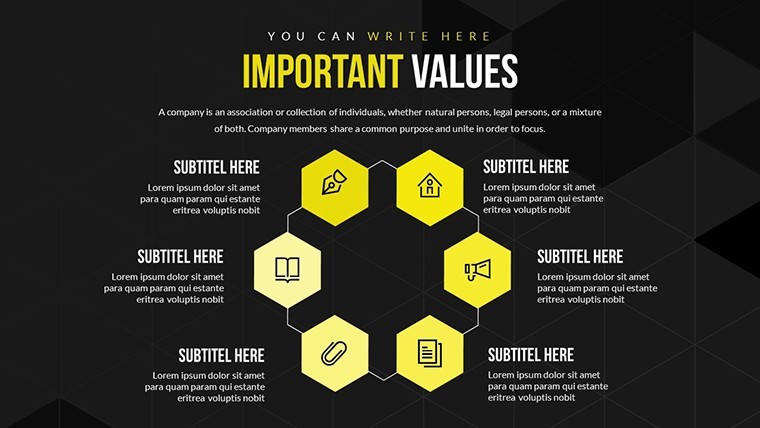
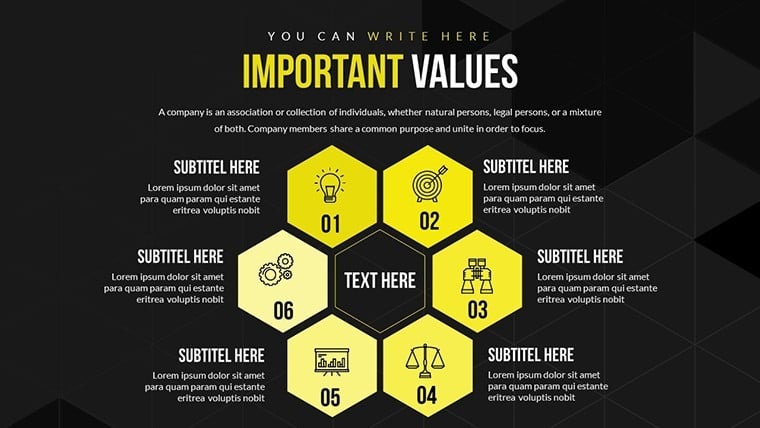
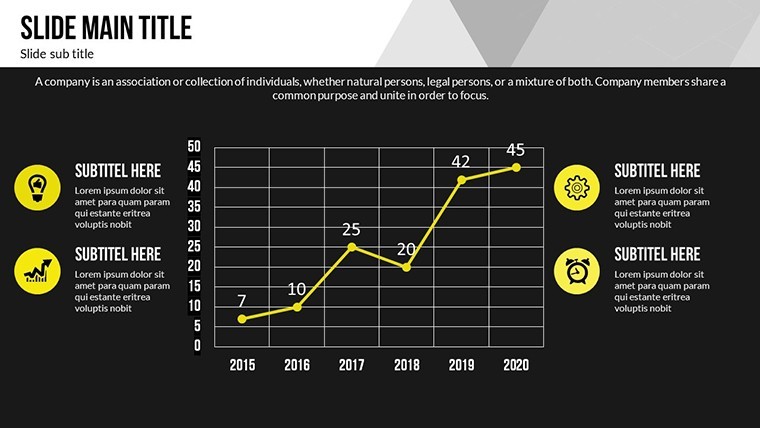
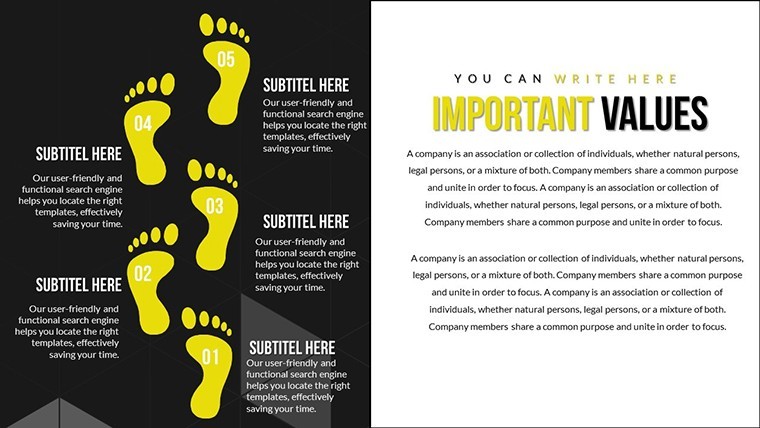
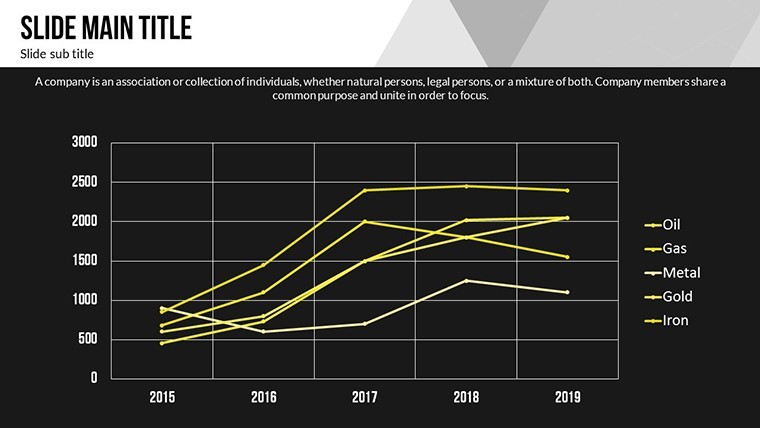
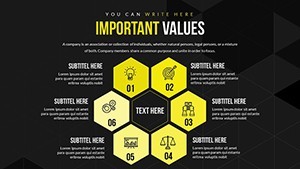
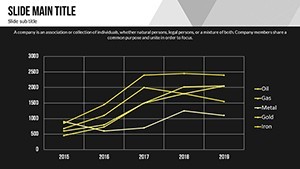
At the heart of this template are its robust features tailored for data enthusiasts. The 20 slides cover a spectrum of graph types, including bar, pie, scatter, and area charts, each optimized for different analytical needs. Slide #3, for example, features a multi-series line graph ideal for tracking variables over time, while slide #10 provides a matrix layout for comparative analysis. All graphs support easy data entry via placeholders, and vector graphics ensure scalability without loss of quality.
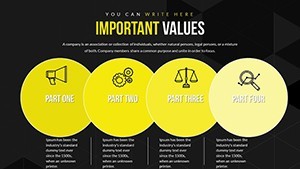
- Customization Depth: Alter layouts, add animations, and tweak effects to animate data reveals dynamically.
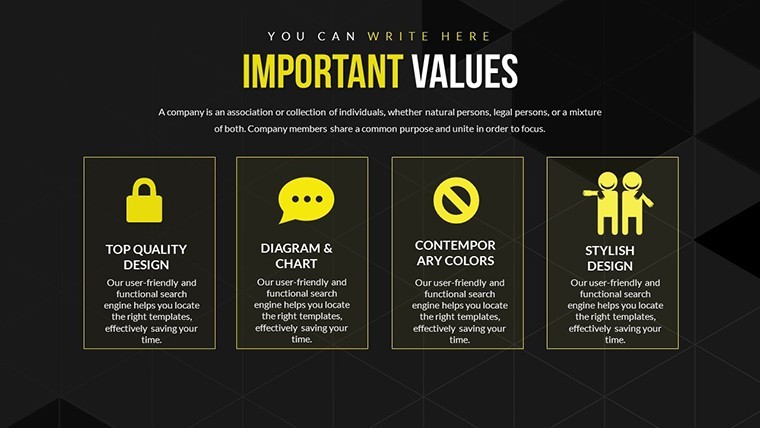
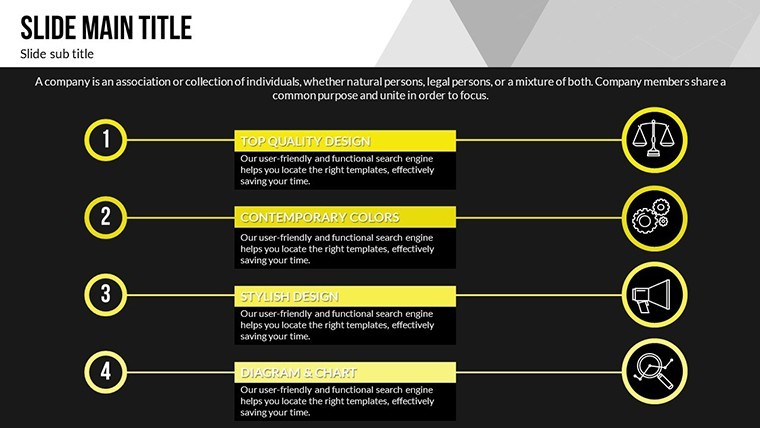
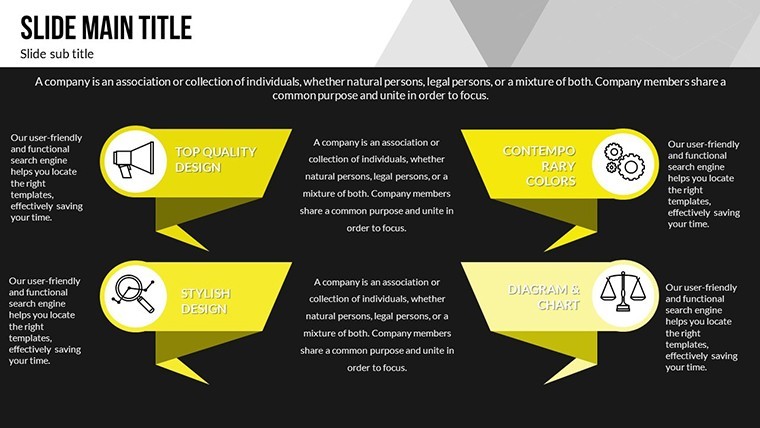
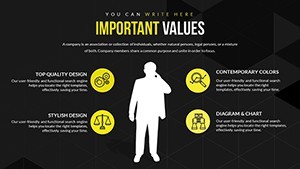
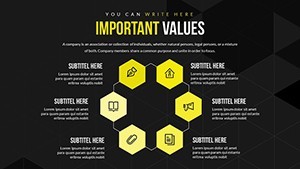
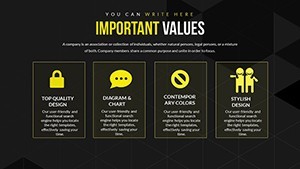
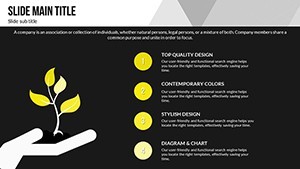
- Professional Design: Pre-set color palettes and fonts for a polished look right out of the box.
- Data Flexibility: Integrate from Excel or other sources seamlessly.
- Animation Options: Built-in effects to highlight key insights progressively.
Unlike standard Keynote defaults, which can feel rigid, this template flexes to your narrative, incorporating LSI elements like trend lines and error bars for advanced users. It's a step up from free tools, offering premium quality that aligns with industry standards from organizations like the American Statistical Association.
Practical Use Cases in Action
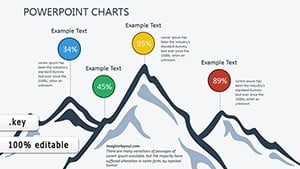
Harness this template across diverse scenarios. In corporate environments, a financial analyst might use slide #7's pie chart to break down expense categories during budget reviews, making fiscal discussions more accessible. Real-world inspiration comes from case studies like those in McKinsey Quarterly, where similar graphs have clarified market share analyses. For educators, slide #15's scatter plot can demonstrate correlations in scientific data, supporting curricula aligned with Common Core standards and boosting student comprehension through visual aids.
Step-by-step implementation is intuitive: Download the .key file, import your dataset, customize visuals, add animations, and export for sharing. Pro tips include using contrasting colors for data series - e.g., greens for growth, reds for declines - and labeling axes clearly to avoid misinterpretation. Integrate into workflows by linking with tools like Google Sheets for live updates, ensuring your presentations stay current.
Boosting Engagement Through Visuals
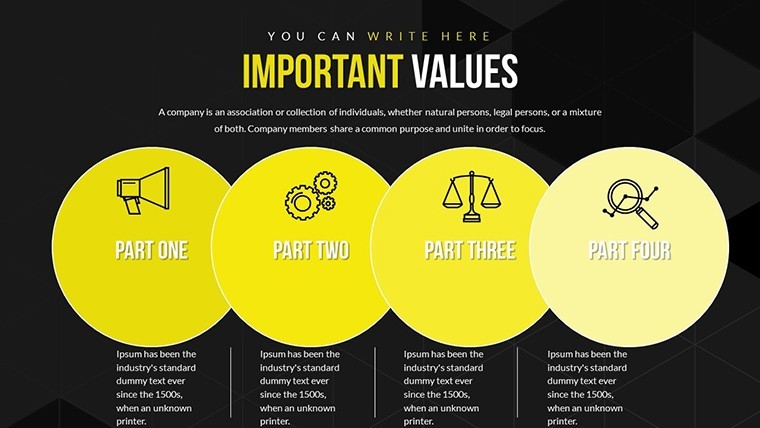
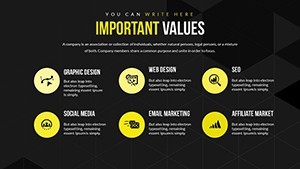
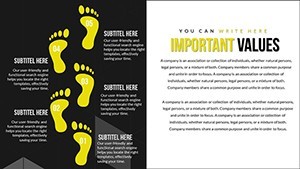
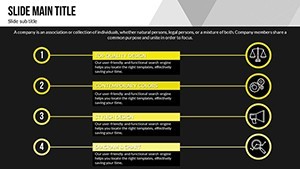
Elevate your sessions by weaving in thematic icons, such as upward arrows for positive trends, enhancing subconscious understanding. In team collaborations, the editability facilitates feedback loops via shared Keynote files. Value here is immense: Reduce design time by 50%, per user feedback, and amplify message retention, as studies from the Journal of Business Communication suggest visuals increase recall by 65%.
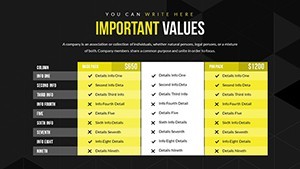
Comparisons favor this template over basics; it includes matrix and table integrations often missing in entry-level options, perfect for multifaceted data stories. For project proposals, combine graphs with narrative slides to build compelling arguments, drawing from successful pitches in tech startups like those profiled in Forbes.
Why This Template Excels
Its uniqueness lies in balancing aesthetics and functionality, avoiding the pitfalls of overly ornate designs. Trusted by professionals, it embodies through expert-aligned features. Whether analyzing consumer behavior or academic research, it adapts flawlessly. Ready to revolutionize your data presentations? Customize now and see the difference in audience response.
Frequently Asked Questions
- What types of graphs are included?
- The template features bar, pie, line, scatter, and area graphs, among others, for comprehensive data analysis.
- How do I add animations to the graphs?
- Simply select elements in Keynote and apply built-in effects for smooth, custom animations.
- Is it suitable for beginners?
- Yes, with intuitive placeholders and easy customization, it's accessible yet powerful for all skill levels.
- Can I integrate external data sources?
- Absolutely, import from Excel or Sheets directly into the graphs.
- What's the file size and format?
- Provided as a compact .key file, ready for immediate use in Keynote.
- Are updates available?
- Yes, purchasers receive notifications for any enhancements or new versions.