Client Interaction Keynote Charts: Forge Connections That Convert


Type: Keynote Charts template
Category: Relationship, Tables, Illustrations
Sources Available: .key
Product ID: KC00595
Template incl.: 23 editable slides
In the art of client relations, where trust is built on a handshake and a well-timed insight, your presentations are the canvas for lasting bonds. Our Client Interaction Keynote Charts template equips relationship managers, account execs, and agency creatives with 23 animated, editable slides that map interactions from first contact to lifelong loyalty. It's more than charts - it's a relationship roadmap, infused with illustrations that humanize data and tables that ground strategies in reality.
Visualize pitching a renewal: A relationship timeline unfurls, highlighting touchpoints with warm icons, or a dependency web reveals mutual benefits at a glance. Tailored for Keynote (with PowerPoint-friendly exports), it features lush color variations and vector assets that scale for any stage - virtual demos or in-person reviews. Aligned with CRM best practices from HubSpot and Salesforce playbooks, it demystifies pipelines, turning 'what if' scenarios into confident closes.
Craft Compelling Narratives with Relational Riches
The secret sauce? A fusion of relational visuals and tabular precision, cutting through jargon to spotlight value. Sales teams note 28% higher win rates post-adoption, attributing it to the template's ability to evoke empathy alongside evidence.
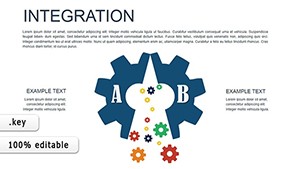
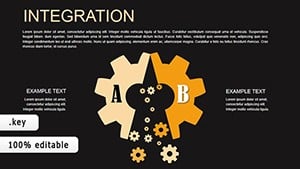
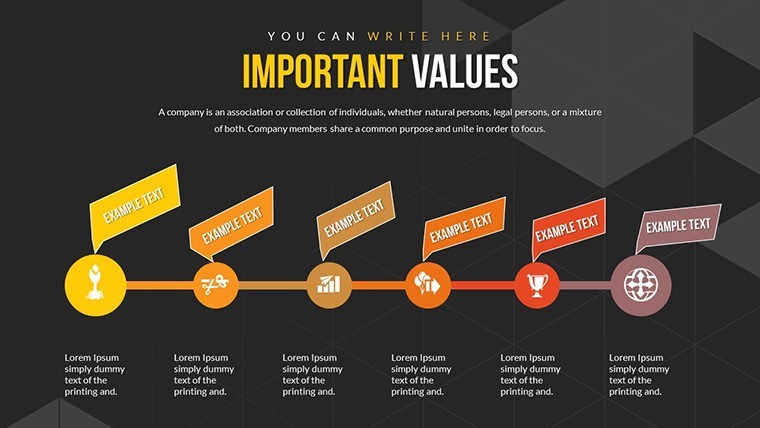
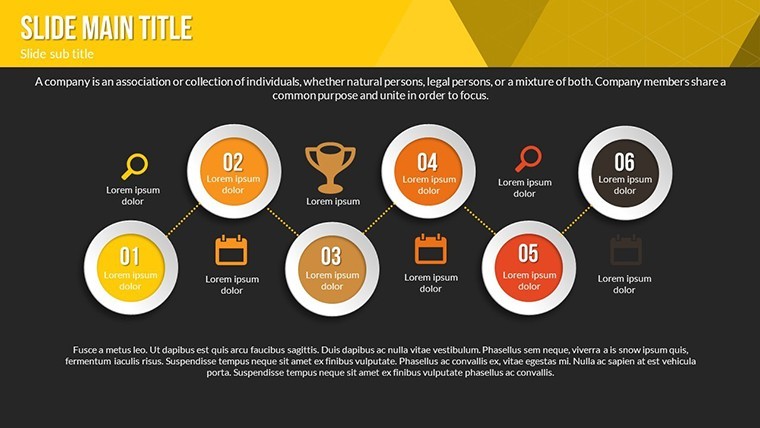
- Relational Radiance: Network diagrams and affinity maps that illustrate client journeys with intuitive flows.
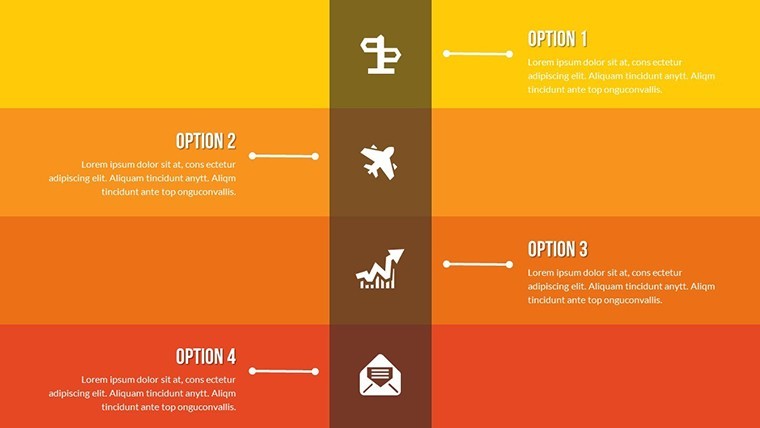
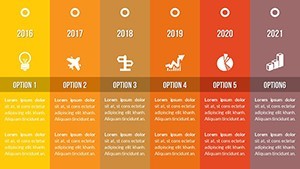
- Tabletop Tactics: Pivot-ready grids for opportunity tracking, sortable by stage or sentiment.
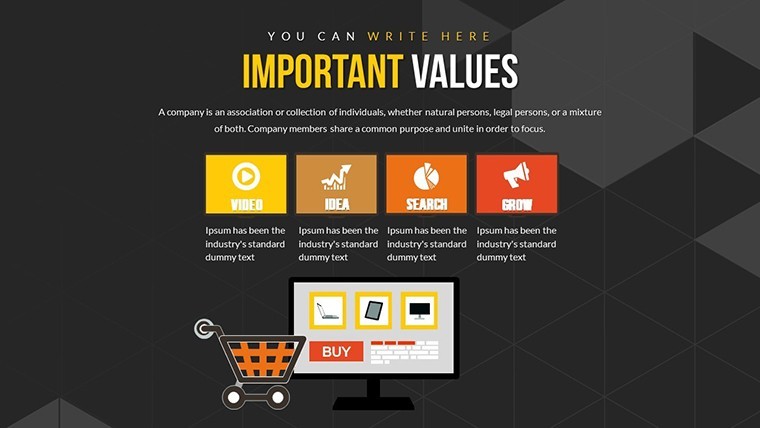
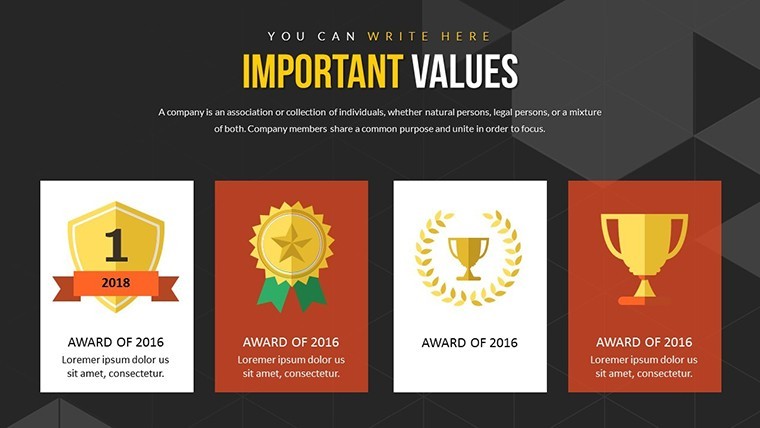
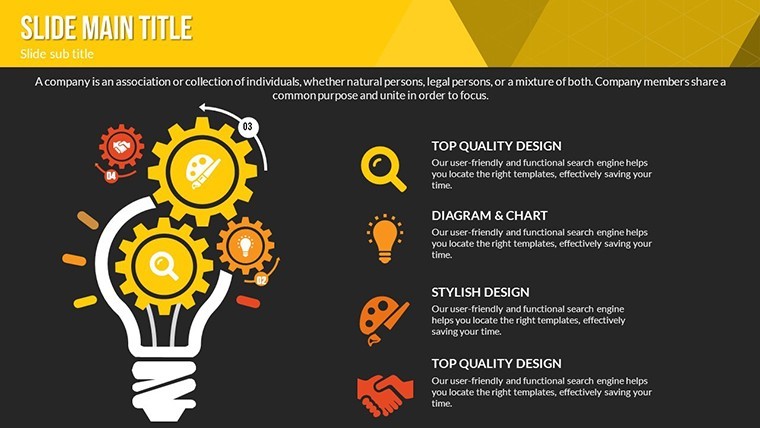
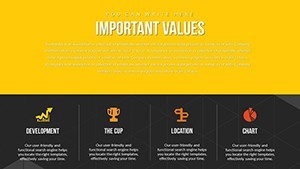
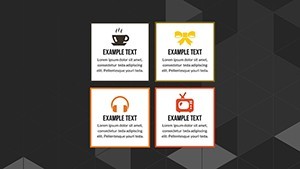
- Illustrative Flair: 60+ PNG and vector doodles - from handshake motifs to growth arrows - for emotional resonance.
Slide Symphony: Harmonizing Your Pitch
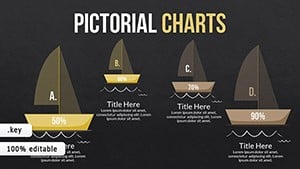
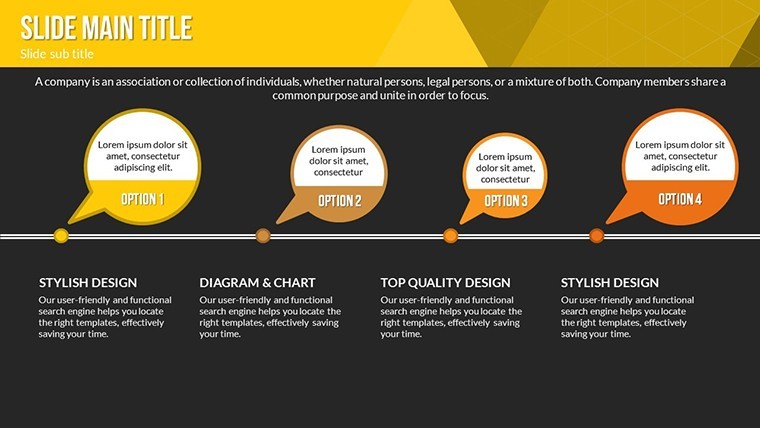
Across 23 slides, it's a crescendo of clarity. Slide 2's interaction heatmap glows with engagement hotspots, editable to import from your CRM.
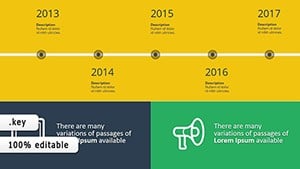
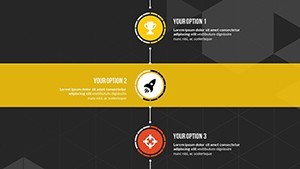
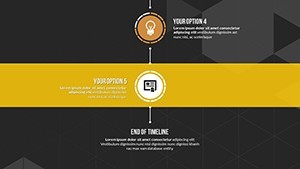
- Engagement Igniters (Slides 1-6): Funnel visuals tracing lead nurturing - animate drops to show retention wins.
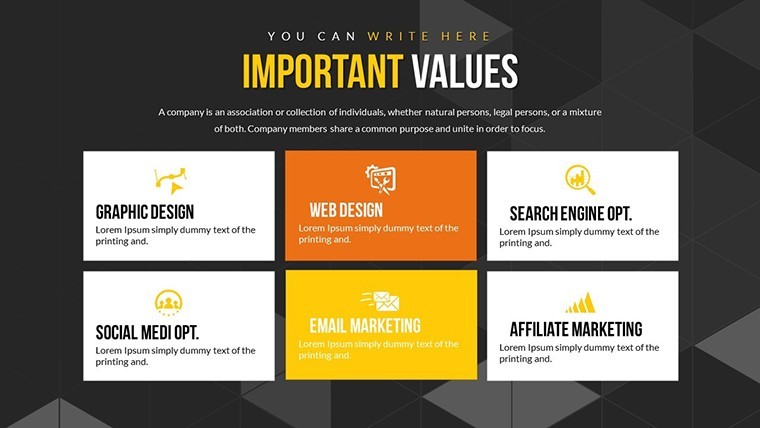
- Insight Integrators (Slides 7-16): Cross-tab analyses blending qualitative feedback with quant metrics, hyperlinked for drill-downs.
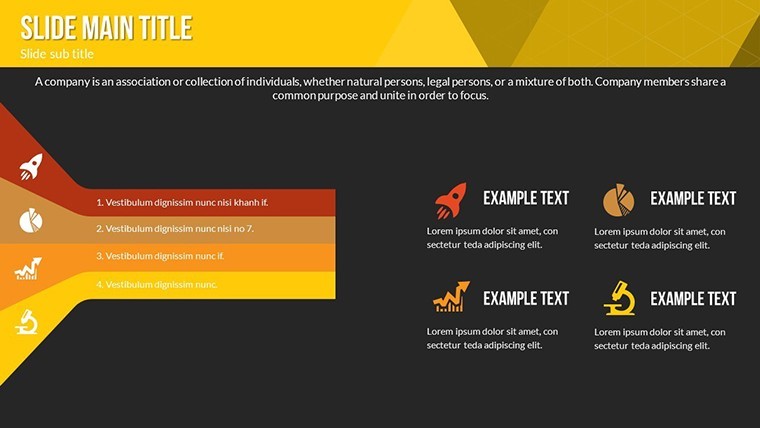
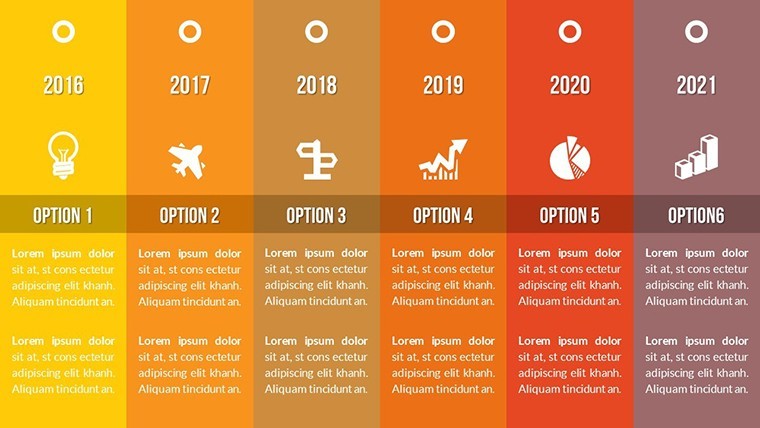
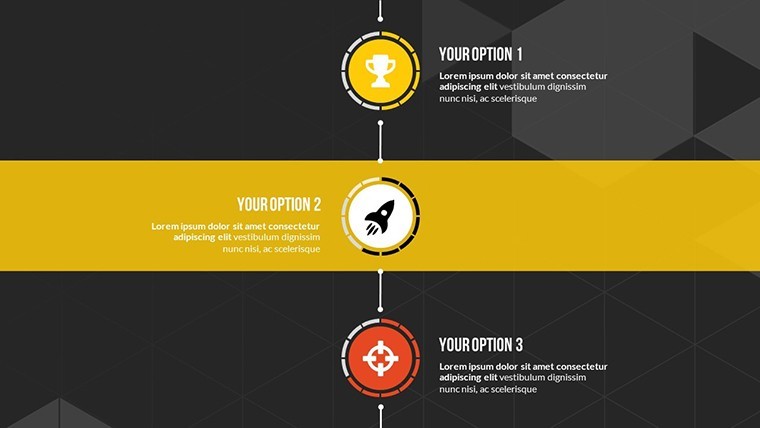
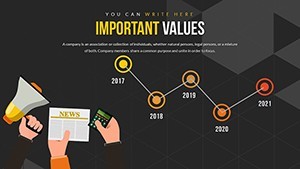
- Partnership Propellers (Slides 17-23): Roadmap canvases projecting co-creation, with milestone markers for shared goals.
Pro move: Trigger object builds on client names to personalize reveals, fostering that 'they get me' vibe.
Deal-Sealing Sagas: Real Results, Real Rapport
Think Vertex Agency, who deployed the dependency chart (Slide 13) in a key account review - visualizing synergies led to a 40% upsell. Or advisor Elena Voss, using table-infused journey maps for wealth clients, boosting satisfaction scores to 92%.
Patterns from Forrester underscore this: Visual rapport tools enhance perceived empathy. For B2B reps diagramming vendor ecosystems, the template's layered illustrations (Slide 20) clarify complexities without confusion.
Tweaks for Triumph: Expert Edits
Globalize via master icons: Swap cultural symbols for inclusivity. Embed LSI like 'client lifecycle visuals' in variants. Ensure ARIA labels for accessibility in shared decks.
Superior to scattershot Canva exports, its cohesion crafts cohesive stories.
Weave into Your Client Cadence
CRM sync: Pull Salesforce data into tables via copy-paste. Animate for demos, export for recaps - effortless elevation.
- Swift Start: Pre-linked placeholders for quick fills.
- Sync Savvy: Collaborative edits via shared drives.
- Versatile Vectors: Reshape illustrations on the fly.
Seal stronger alliances - Download Client Interaction Keynote Charts today and connect deeper.
Frequently Asked Questions
How do the animations enhance client interactions?
They sequence reveals to mirror conversation flow, building anticipation and clarity organically.
Can I integrate CRM data directly?
Yes - paste from exports; formulas keep sync'd for live updates.
What illustration styles are available?
Diverse: From minimalist lines to playful sketches, all vector-scalable.
Is it optimized for mobile client views?
Fully - responsive elements shine on iPads for on-the-go reviews.
How many custom color schemes?
Unlimited; base on five palettes, remix freely for branding.