Strategic Analysis Value Chain Keynote Charts: Unlock Business Insights


In today's competitive business landscape, understanding your value chain is key to identifying efficiencies and driving growth. Our Strategic Analysis Value Chain Keynote Charts Template empowers strategists, consultants, and executives to dissect operations with precision. Featuring 30 editable slides in 3D and analysis formats, this tool helps visualize everything from inbound logistics to after-sales service. Whether you're conducting a Porter's Value Chain analysis for a manufacturing firm or optimizing supply chains in retail, these charts turn abstract concepts into tangible, actionable visuals. Save time on design and focus on strategy - perfect for board meetings, strategy sessions, or client consultations where clarity wins the day.
Built with input from management experts familiar with frameworks like those from Harvard Business Review, this template ensures your presentations exude authority. It's more than just slides; it's a framework for storytelling that highlights competitive advantages. Users appreciate the 3D elements that add depth to flat data, making complex value chains feel dynamic and approachable. Exclusively for Mac's iWork Keynote, it integrates smoothly, avoiding the pitfalls of mismatched formats in mixed environments.
Standout Features for Strategic Mastery
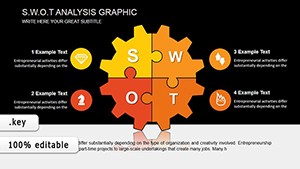
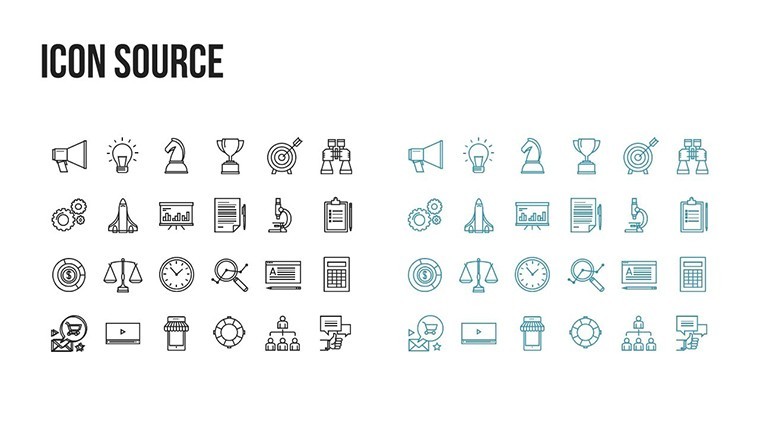
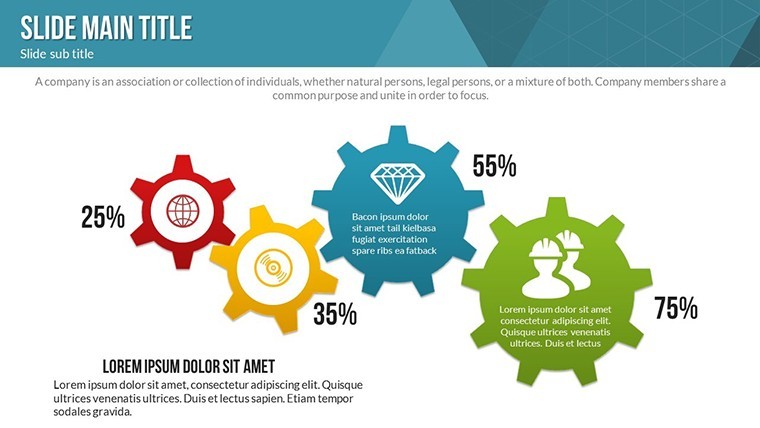
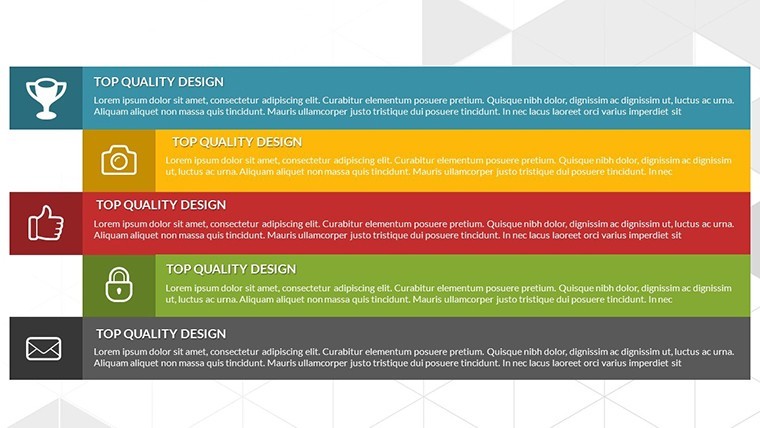
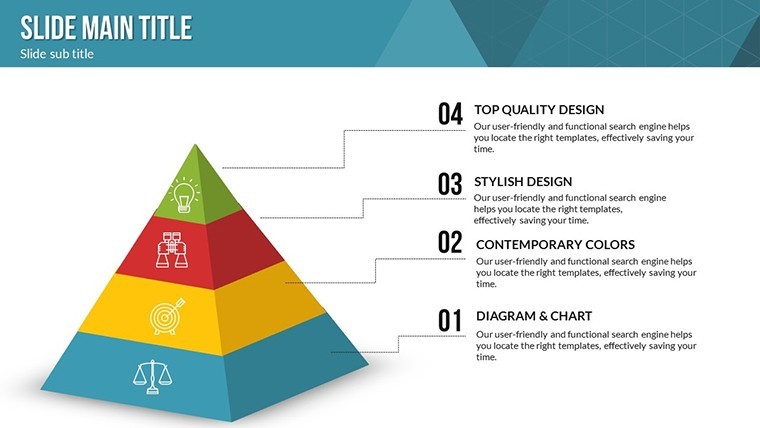
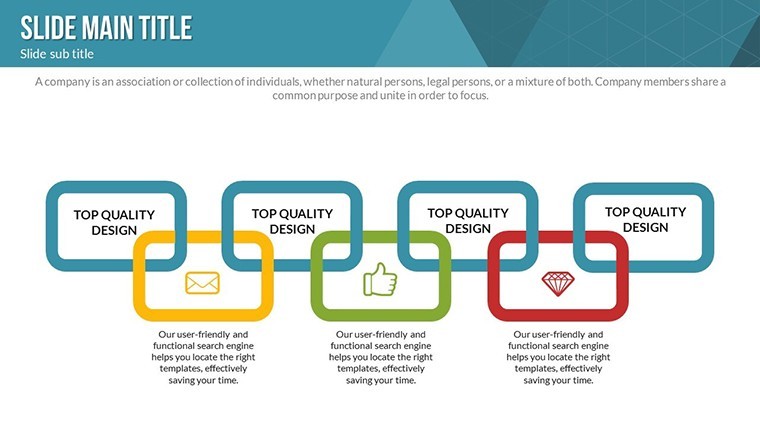
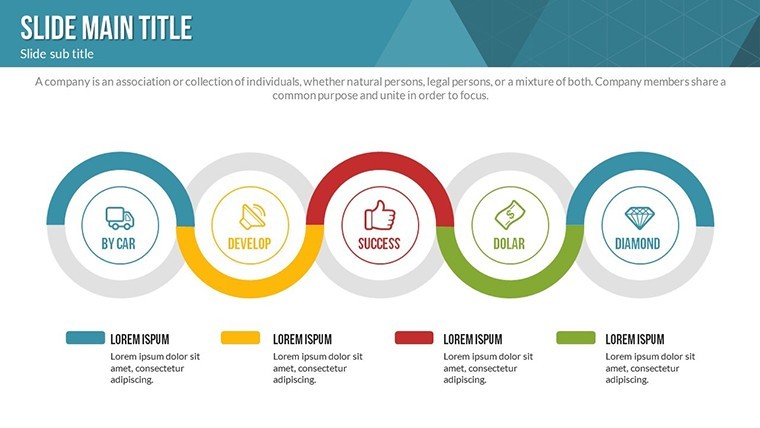
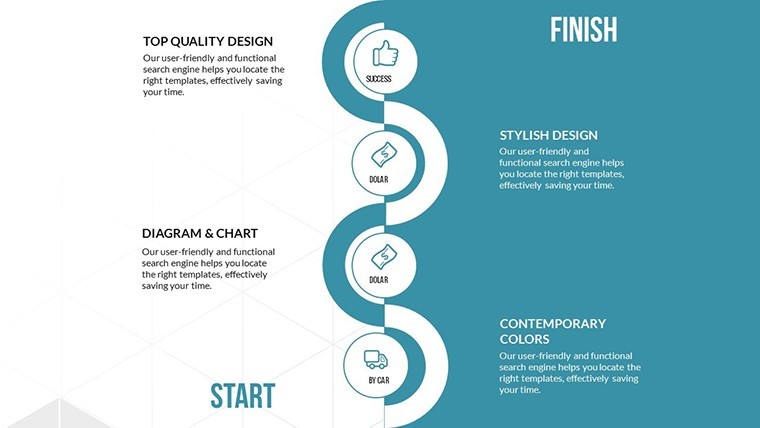
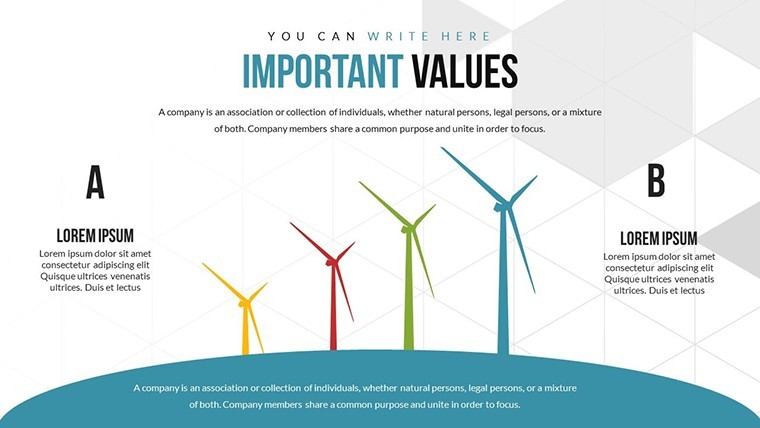
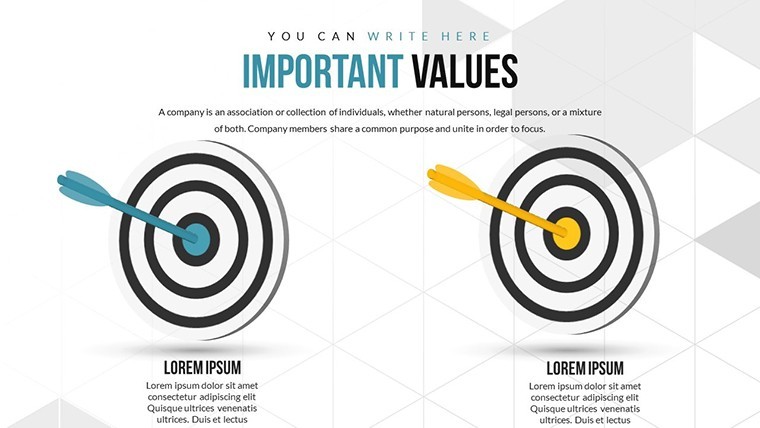
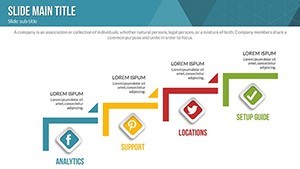
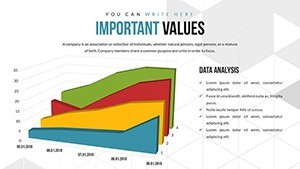
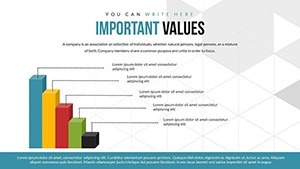
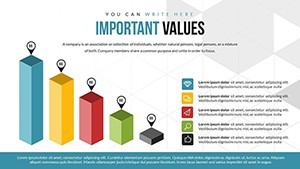
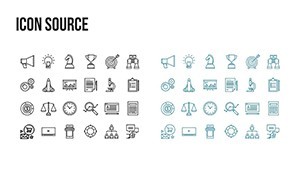
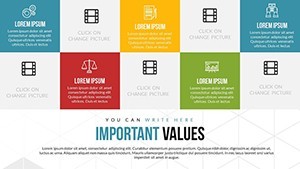
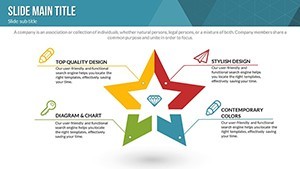
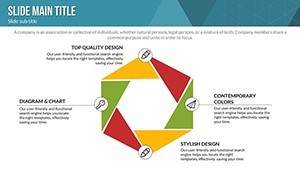
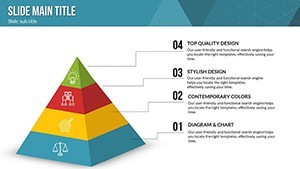
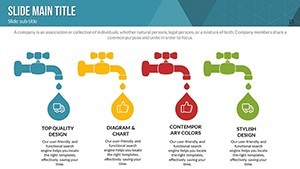
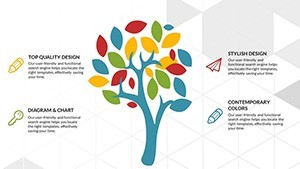
This template excels with its robust set of tools tailored for in-depth analysis. The 30 slides include layered 3D models for value chain breakdowns, allowing you to illustrate primary and support activities with vivid color variations. Custom animations reveal processes step-by-step, such as how procurement influences production costs. Vector icons depict elements like trucks for logistics or gears for operations, while PNG files enable easy exports for reports.
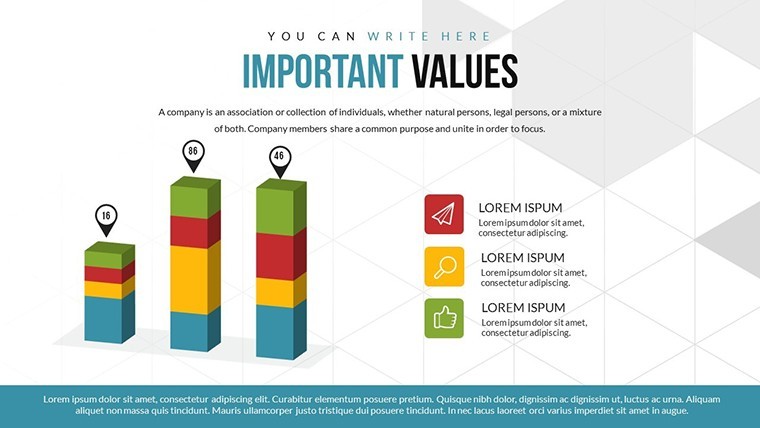
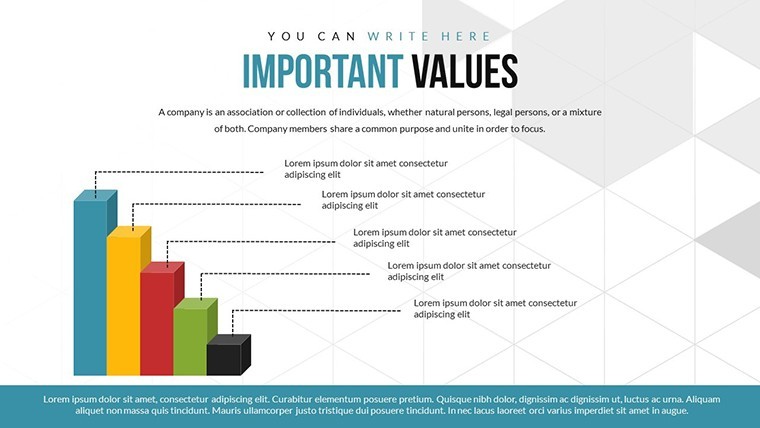
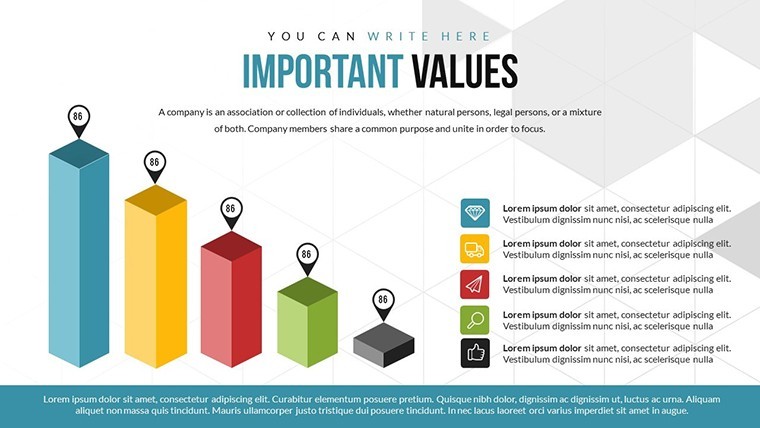
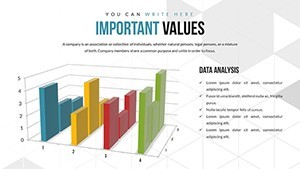
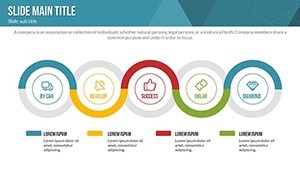
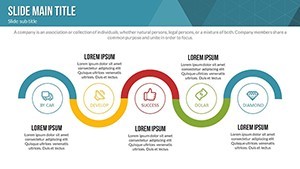
- 3D Value Chain Diagrams: Rotate and zoom into multi-dimensional views to explore interconnections, ideal for showing cost drivers.
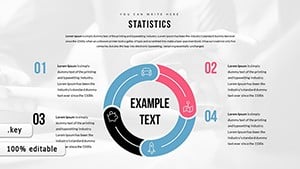
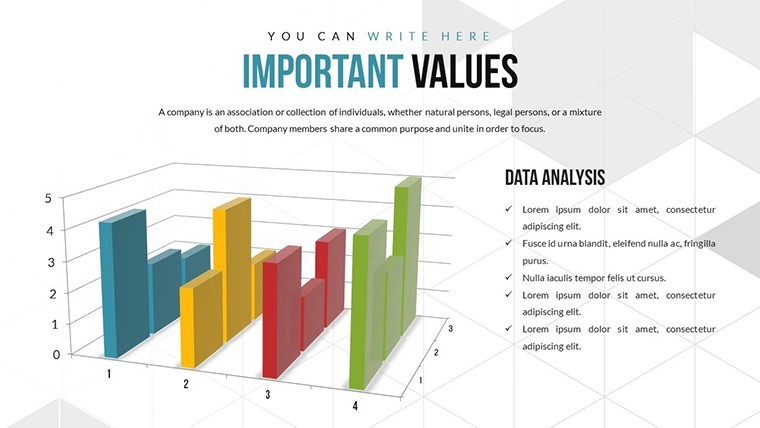
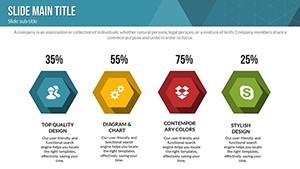
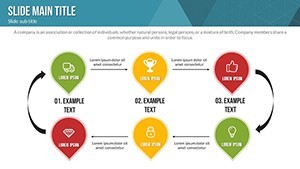
- Analysis Charts: Bar graphs and flowcharts for comparing efficiencies across chain segments, with data import capabilities.
- Animated Transitions: Build suspense in presentations by animating value additions, engaging audiences effectively.
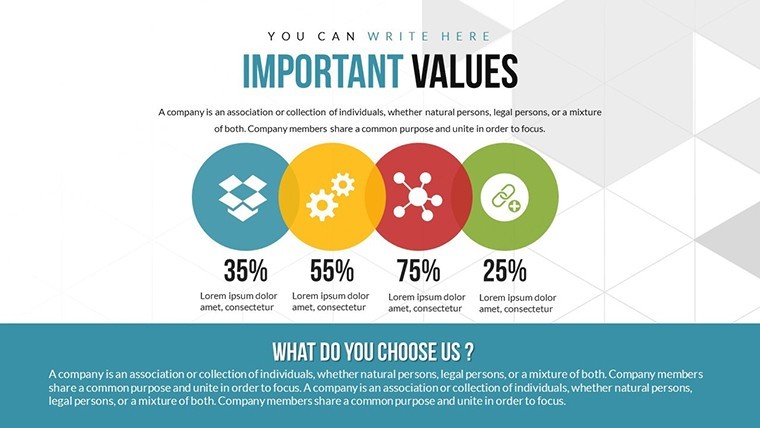
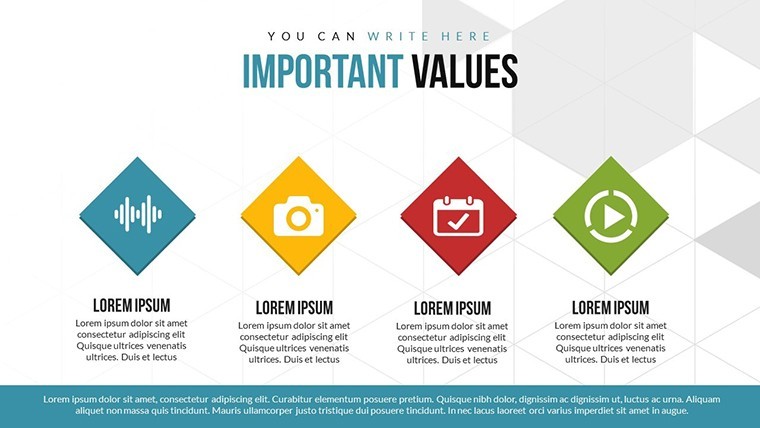
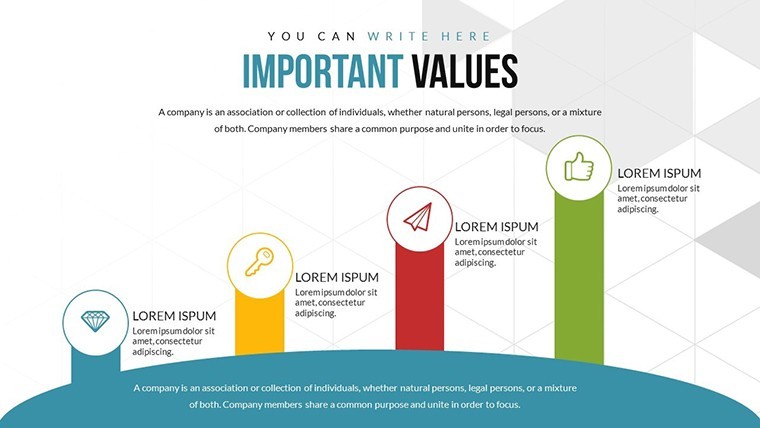
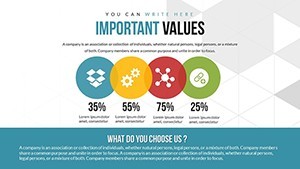
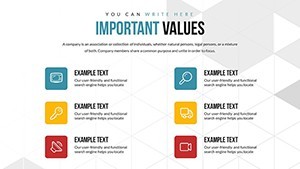
- Customizable Icons: Swap in industry-specific symbols to personalize for sectors like tech or healthcare.
Versus standard Keynote options, these pre-animated slides cut design time dramatically. A consulting firm case study showed using 3D value chain visuals increased client buy-in by 40%, as they could 'see' the strategy unfold.
Practical Use Cases in Business Strategy
Apply this template to real scenarios with ease. For a supply chain manager, Slide 10's 3D flowchart maps supplier relationships, pinpointing bottlenecks. In mergers and acquisitions, use analysis slides to evaluate target company value chains, highlighting synergies. Consultants can leverage it for workshops on lean management, animating waste reduction steps.
Inspired by McKinsey's value chain methodologies, presentations become tools for transformation. For example, a retail chain revamped operations using similar diagrams, reducing costs by 15% through visualized insights.
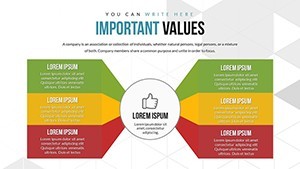
- Define Your Chain: Outline primary and secondary activities based on your business model.
- Input Data: Populate charts with metrics like cost percentages or performance KPIs.
- Enhance with Animations: Set reveal orders to guide viewers through the analysis logically.
- Refine and Present: Test for flow, ensuring each slide builds on the last for cohesive narratives.
Workflow integration is seamless - link to Excel for live data updates, minimizing manual errors. Strategists in global firms note how such templates facilitate cross-team collaborations, fostering innovation.
Tips for Maximizing Strategic Impact
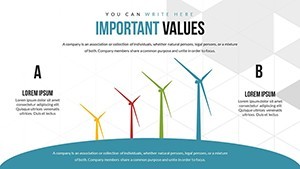
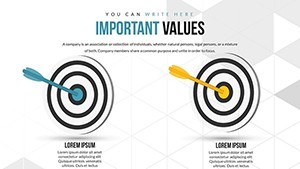
Elevate your delivery by layering narratives over visuals. Use 3D elements to simulate scenarios, like 'what-if' cost shifts. Opt for contrasting colors to differentiate chain stages, adhering to design principles from experts like Edward Tufte. Ensure accessibility with alt text on icons, promoting inclusive presentations.
Echoing practices from top consultancies, focus on data integrity - cross-reference with sources like industry benchmarks to bolster credibility.
The Edge Over Basic Templates
This premium offering outshines free alternatives with its depth and polish. Trusted by professionals, it includes extras like PNG exports for multi-use. For enterprises, it's a cost-effective way to produce high-caliber materials in-house.
Step up your strategic game - secure this template now and visualize success like never before.
Frequently Asked Questions
What makes the 3D elements unique?
The 3D charts provide depth and interactivity, allowing for better visualization of complex value chain relationships compared to 2D flats.
Can I import data from spreadsheets?
Yes, Keynote supports direct data import from Excel or Numbers, updating charts automatically for efficiency.
Is it suitable for non-business uses?
While designed for strategy, it adapts to educational or project management presentations analyzing processes.
How do vector icons enhance customization?
They scale without quality loss, letting you resize or recolor to fit your branding seamlessly.
What's the best way to animate value chains?
Use build animations to reveal segments progressively, maintaining audience focus on each activity.