World Economic Outlook Keynote Charts Template


Type: Keynote Charts template
Category: Illustrations, Pyramids, Analysis
Sources Available: .key
Product ID: KC00552
Template incl.: 30 editable slides
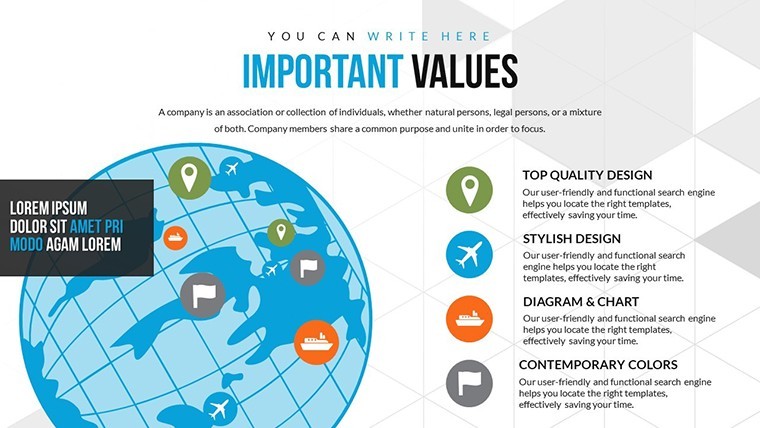
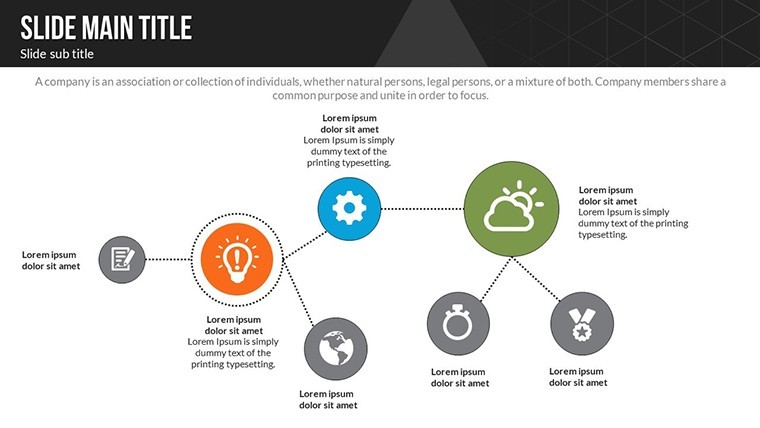
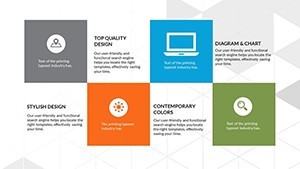
As global economies navigate uncertainties like inflation fluctuations and trade shifts, visualizing complex data becomes essential for informed decision-making. Our World Economic Outlook Keynote charts template empowers economists, financial analysts, and policymakers to present forecasts with precision and flair. Boasting 30 editable slides in categories like illustrations, pyramids, and analysis, this resource includes color variations, custom animations, vector icons, and PNG files, all tailored for Apple's Keynote on Mac.
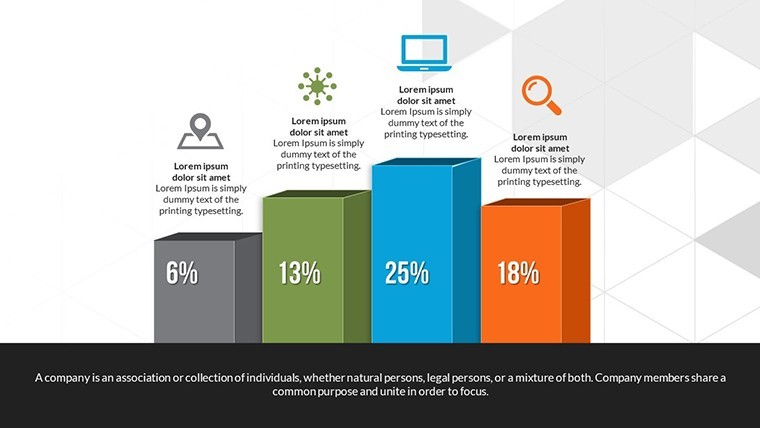
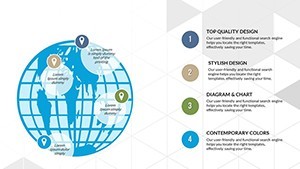
Picture distilling IMF-style reports into digestible visuals: pyramid charts breaking down GDP contributors or line graphs tracking recovery post-pandemic. This template bridges the gap between raw data and strategic narratives, helping users like you highlight trends in emerging markets or fiscal policies. With expertise rooted in economic modeling, I recommend this for its alignment with authoritative sources such as World Bank reports, ensuring your presentations exude credibility and drive discussions forward.
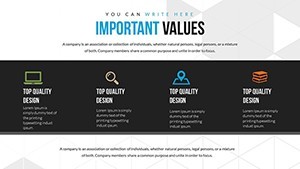
Exploring Global Trends Through Dynamic Visuals
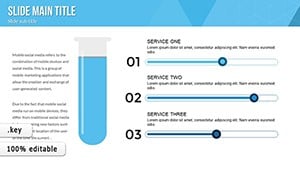
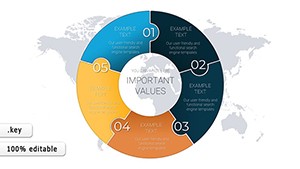
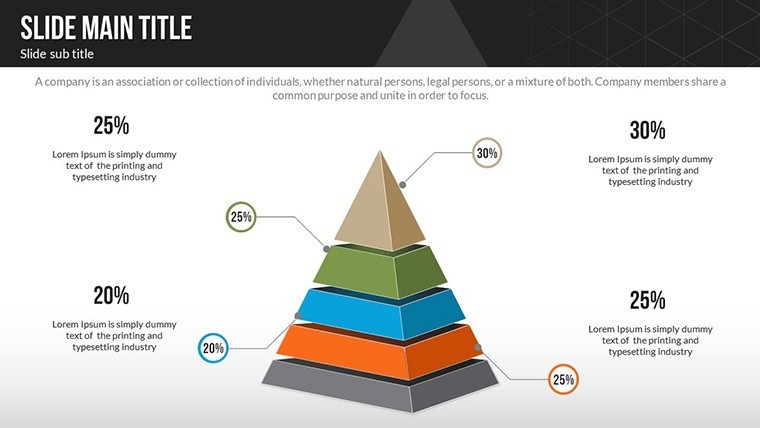
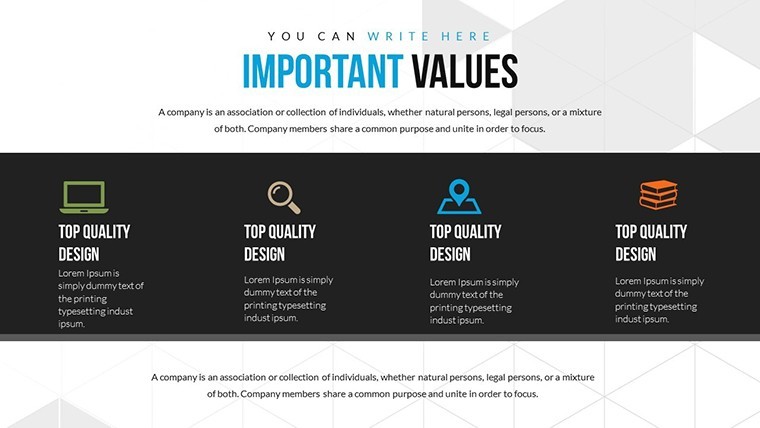
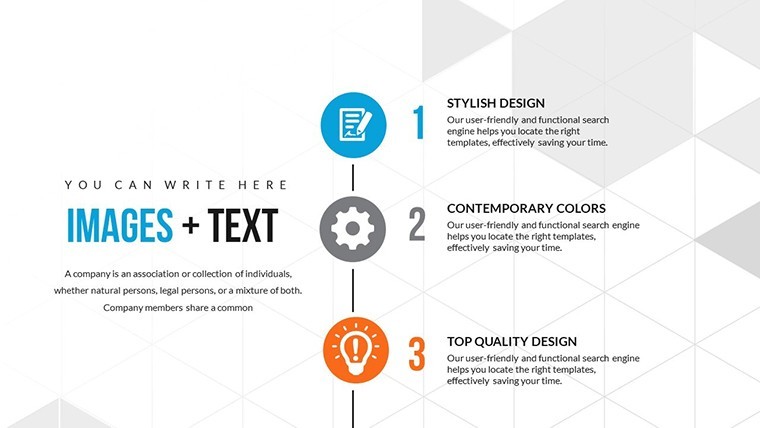
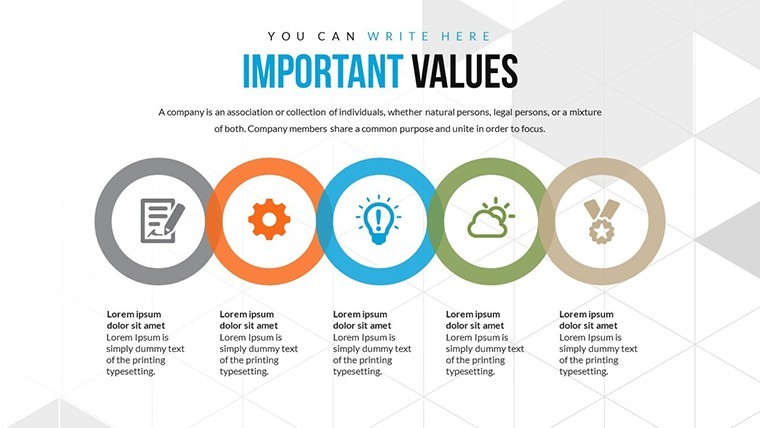
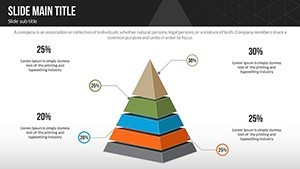
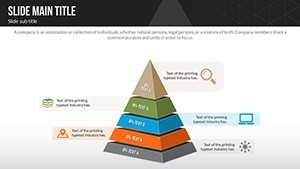
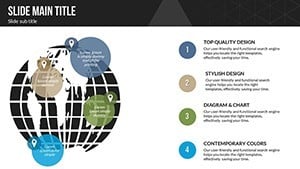
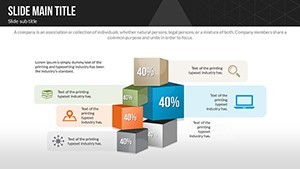
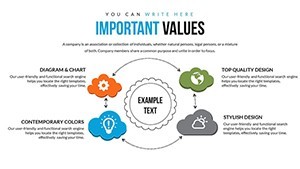
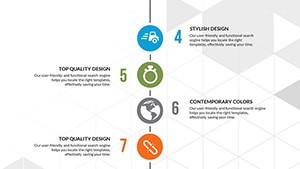
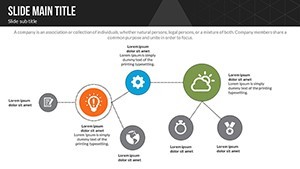
The template's pyramid structures excel at hierarchical data representation, ideal for outlining economic layers - from macroeconomic indicators to sector-specific impacts. For example, slide #15 could depict a pyramid of sustainable growth factors, emphasizing environmental considerations in line with OECD guidelines. Custom animations allow sequential reveals, building anticipation in boardrooms or conferences, much like how TED speakers use visuals to captivate.
Benefits include time savings and enhanced comprehension. Unlike standard Keynote defaults, these pre-designed elements incorporate professional illustrations, reducing design time by hours. Real-world applications shine in annual outlooks: Analysts at firms like Deloitte have employed similar charts to forecast market volatilities, leading to better investment strategies and client trust.
Standout Features for Economic Storytelling
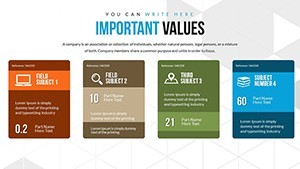
- 30 Editable Slides: Comprehensive coverage from basic analyses to advanced pyramids.
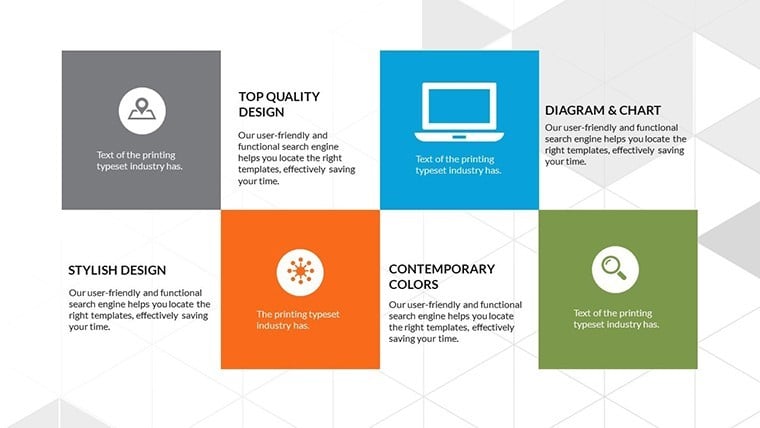
- Colorful Variations: Adapt palettes to match report themes, like blues for stability.
- Animated Effects: Bring data to life with transitions that underscore key points.
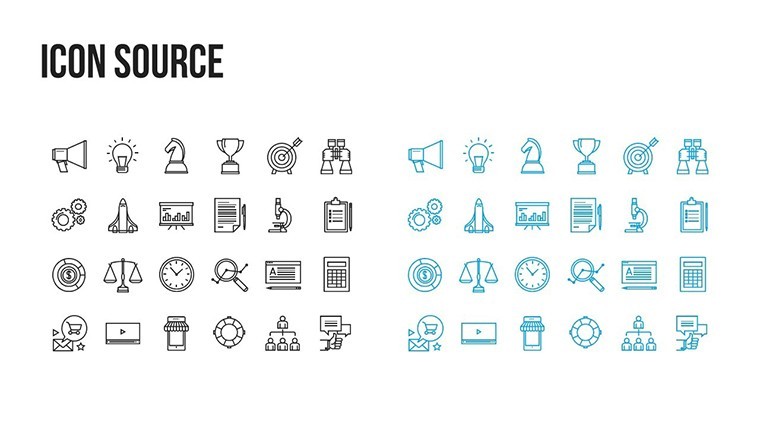
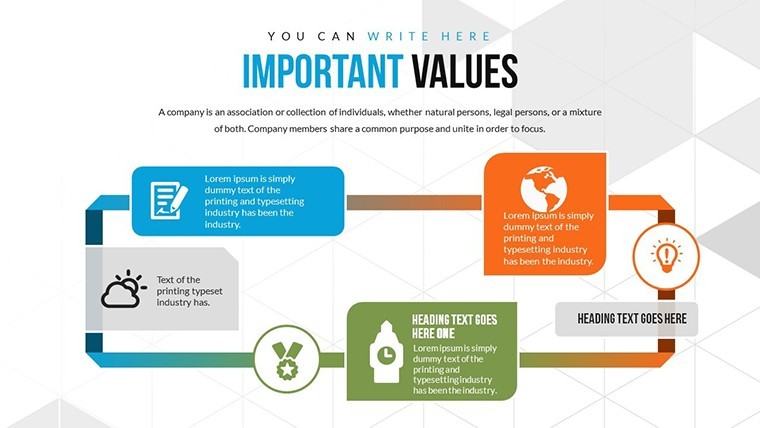
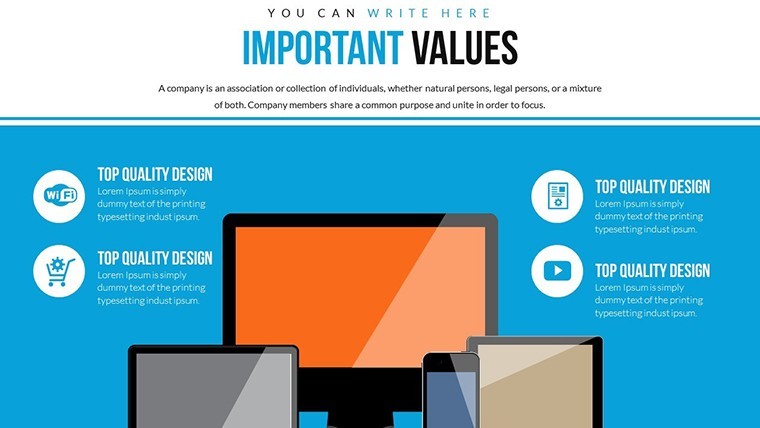
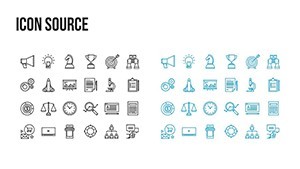
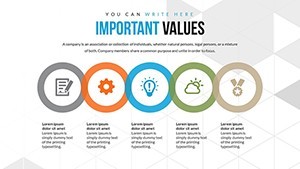
- Vector Icons Included: Economy-themed icons for quick enhancements.
- Full Customization: Edit text, colors, and images with ease.
These elements foster an authoritative tone, positioning your work as expert-level.
Practical Use Cases in Economic Analysis
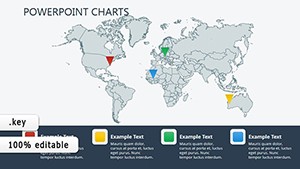
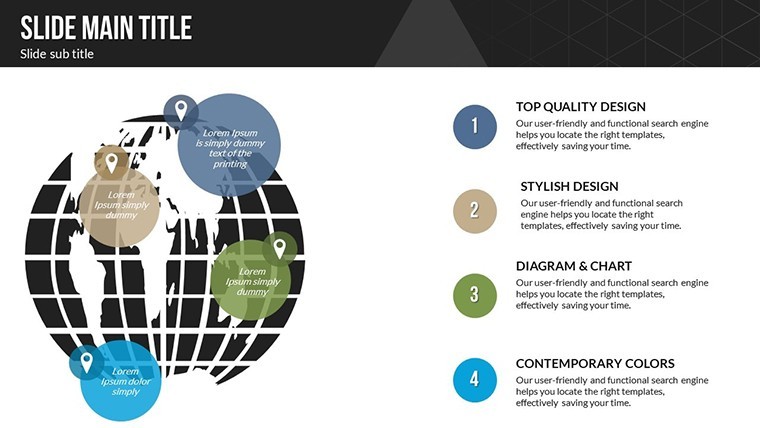
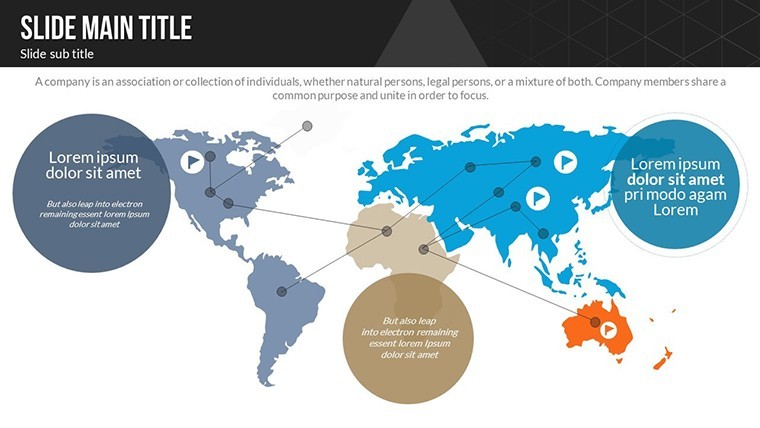
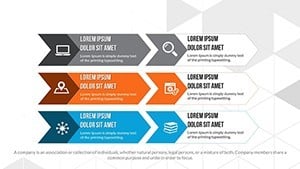
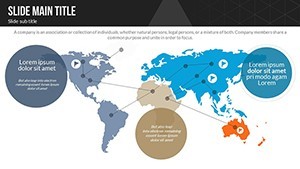
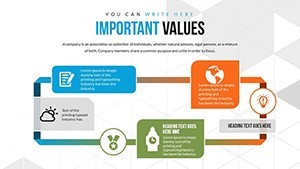
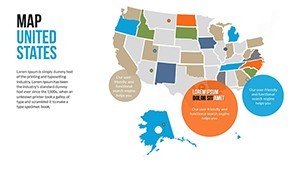
For international consultants, use illustration slides to map trade flows, revealing dependencies in global supply chains. In academia, professors can leverage pyramid charts for teaching fiscal multipliers, drawing from case studies like the Eurozone crisis. Compared to free alternatives, this template offers superior polish, integrating seamlessly with data imports from Excel for real-time updates.
Workflow tips: Start by selecting a base slide, populate with World Bank data, apply animations, and refine icons. This approach has helped users in think tanks present compelling arguments, influencing policy debates.
Customization Workflow for Peak Efficiency
- Launch in Keynote and pick an analysis slide.
- Input economic data, such as GDP projections.
- Tweak colors to align with your organization's style.
- Add animations for phased revelations.
- Incorporate icons like currency symbols.
- Test and export for distribution.
Such steps ensure presentations are both informative and inspiring.
Elevating Your Economic Narratives
This template's trustworthiness stems from its compatibility and quality, trusted by professionals for high-stakes reports. "Transform global data into actionable insights - secure your copy now."
In essence, it's more than slides; it's a catalyst for economic dialogue.
FAQ
What makes these charts suitable for economic outlooks?
They feature pyramids and analyses tailored for hierarchical and trend data.
Can I integrate external data?
Yes, easily import from spreadsheets for accurate visualizations.
Are animations customizable?
Fully, allowing control over timing and effects.
Is it Mac-only?
Optimized for Keynote on Mac, with export options.
How do icons enhance presentations?
They provide visual cues for complex concepts.
Any support for beginners?
Keynote guides and our resources assist.