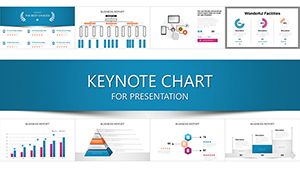
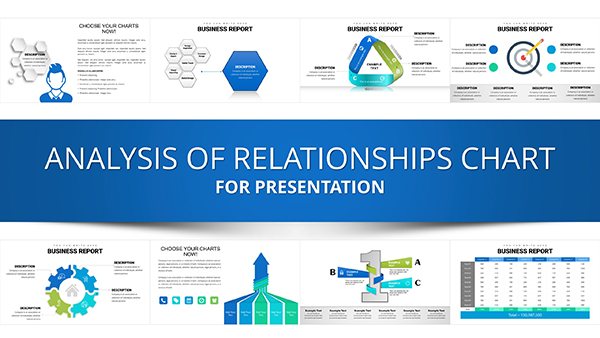
Embedded Derivatives Keynote Charts Template: Elevate Your Financial Presentations


Type: Keynote Charts template
Category: Illustrations, Analysis
Sources Available: .key
Product ID: KC00528
Template incl.: 21 editable slides
In the fast-paced world of finance, where every detail counts, presenting complex concepts like embedded derivatives can make or break a deal. Imagine transforming dense financial data into visually compelling stories that captivate your audience - whether it's stakeholders, clients, or team members. Our Embedded Derivatives Keynote Charts Template is designed specifically for financial professionals who need to illustrate the intricacies of derivatives embedded in host contracts, such as convertible bonds or insurance policies. With 21 fully editable slides, this template offers a seamless blend of illustrations and analysis tools, ensuring your presentations are not just informative but truly engaging.
This template isn't just about charts; it's about empowering you to communicate the nuances of financial instruments with clarity. Think about the last time you struggled to explain how an embedded derivative affects the valuation of a hybrid security. With our pre-built visuals, you can highlight separation criteria under standards like IFRS 9 or ASC 815, making abstract ideas tangible. The color variations and custom animations bring your data to life, allowing you to focus on strategy rather than design. Compatible exclusively with Apple's Keynote on Mac, it ensures smooth performance without compatibility headaches.
Key Features That Set This Template Apart
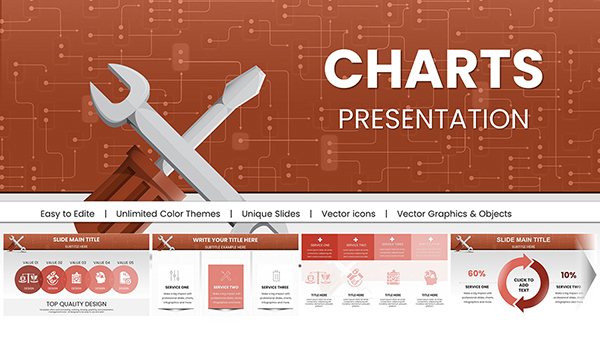
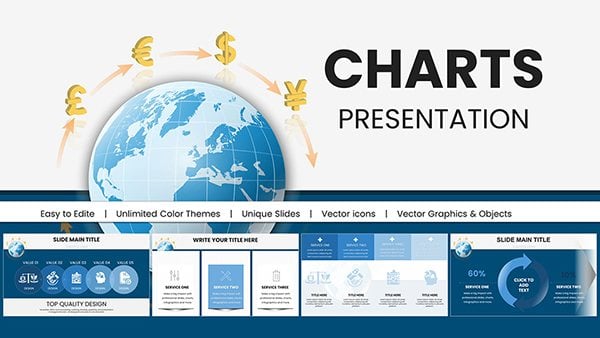
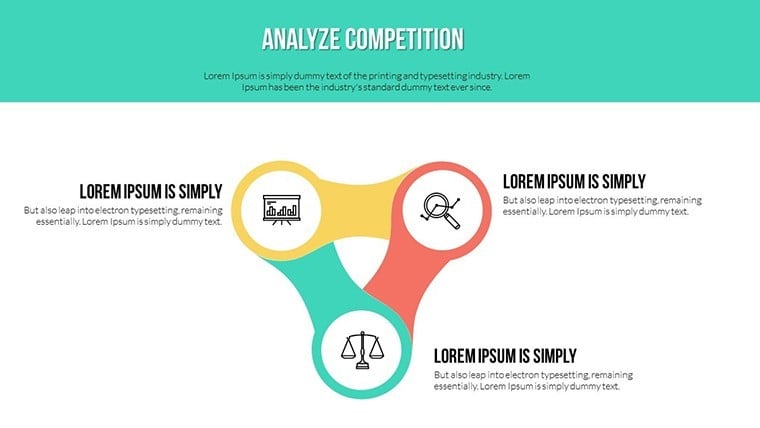
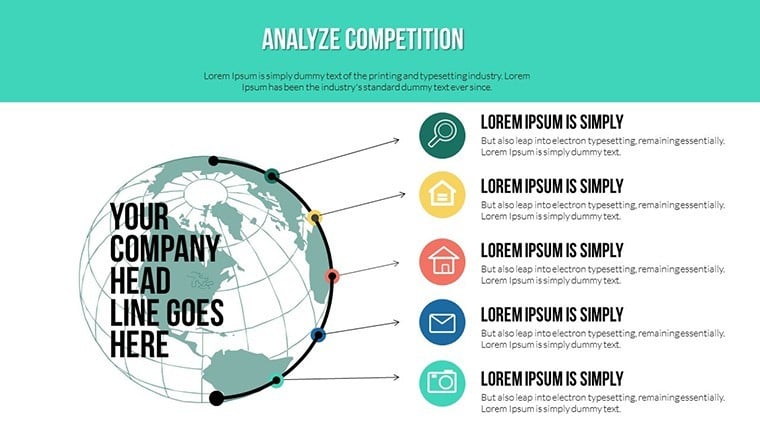
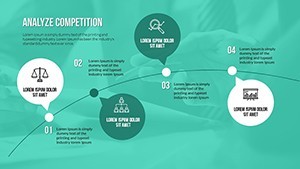
Dive into a suite of features tailored for financial storytelling. Each slide is crafted with precision, incorporating vector icons and PNG elements that you can resize without losing quality. The full editability means you can swap colors to match your firm's branding - perhaps shifting from corporate blues to vibrant greens for a fresh take on risk assessment. Custom animated effects add a professional polish, like fading in payoff diagrams or animating cash flow projections, keeping your audience hooked from slide one to twenty-one.
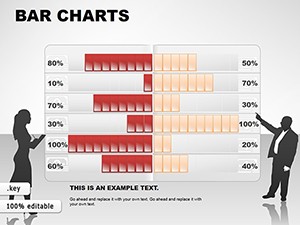
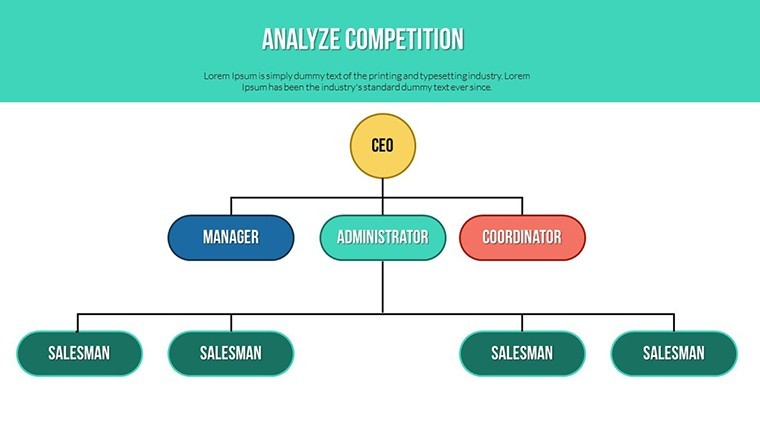
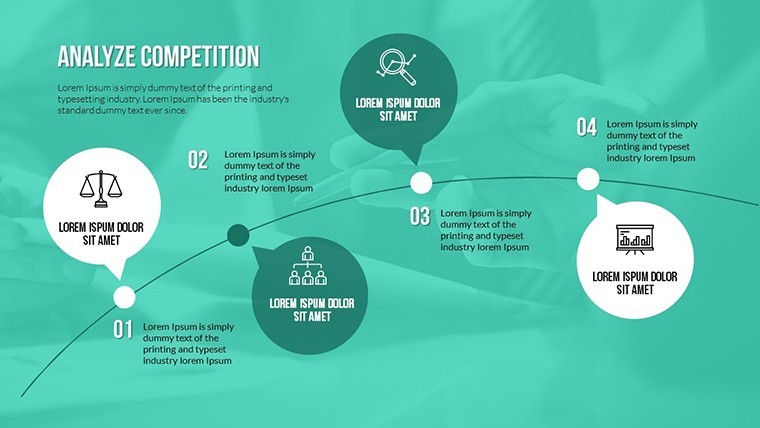
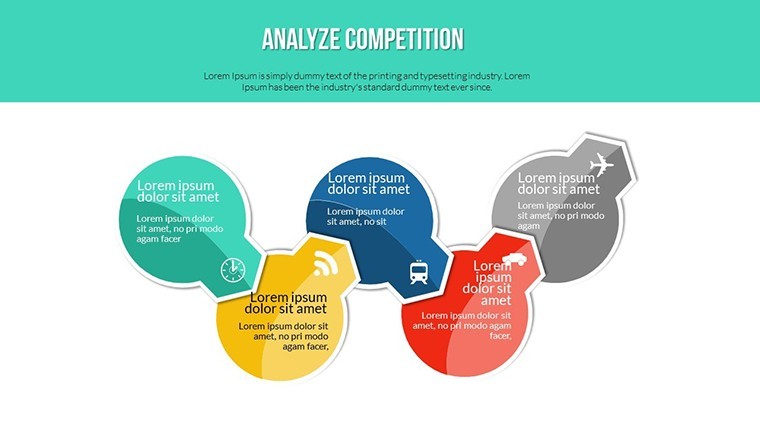
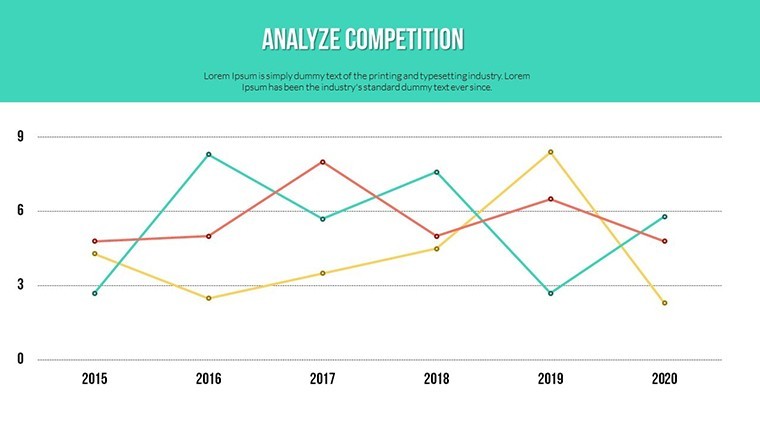
- Versatile Chart Types: From payoff profiles to bifurcation flowcharts, cover everything from basic embedded options to complex structured products.
- High-Resolution Graphics: Ensure your presentations look sharp on any screen, ideal for virtual meetings or boardroom displays.
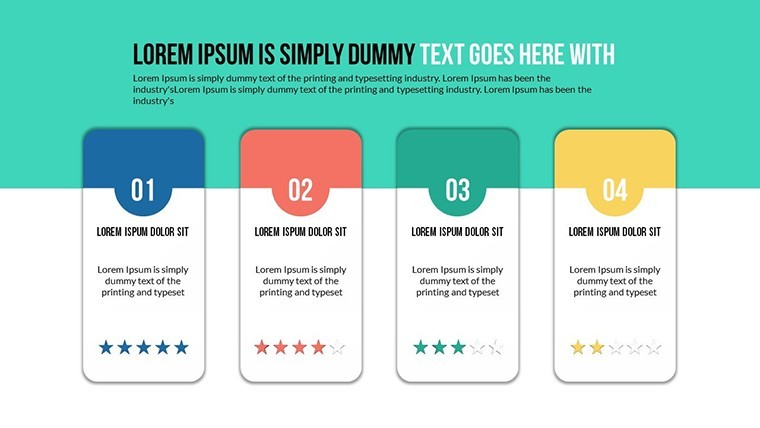
- Easy Customization: Drag-and-drop elements let you insert your data quickly, saving hours of manual work.
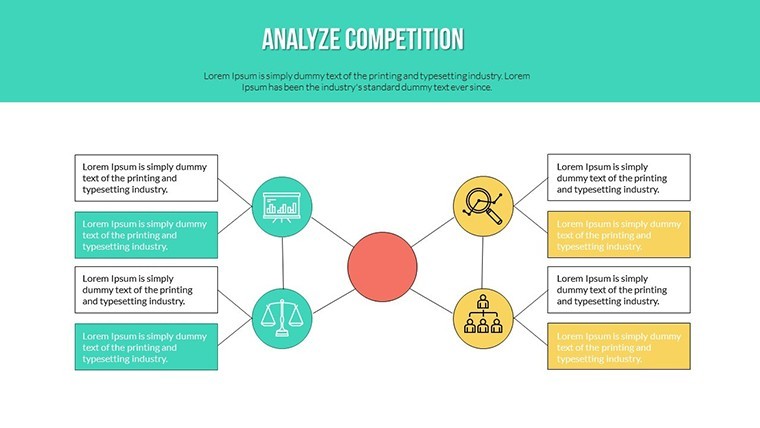
- Included Assets: Vector icons for financial symbols and PNG files for quick integrations.
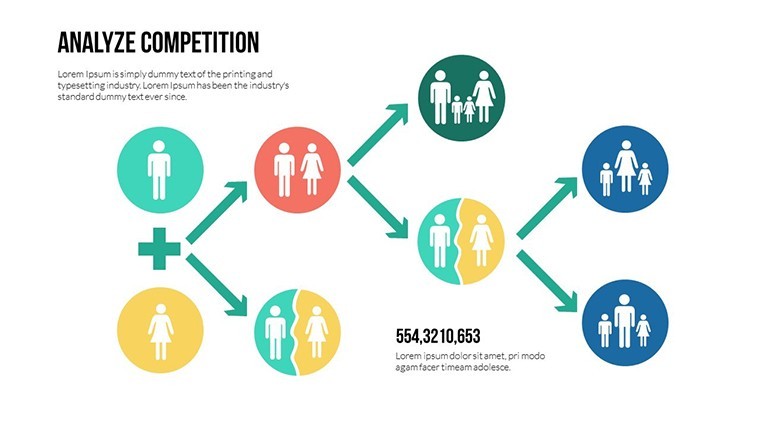
These features aren't generic; they're honed for the financial sector. For instance, use the illustration slides to depict how an embedded call option in a debt instrument can be separated if it meets the 'closely related' test, providing real value in compliance reporting.
Real-World Applications for Financial Experts
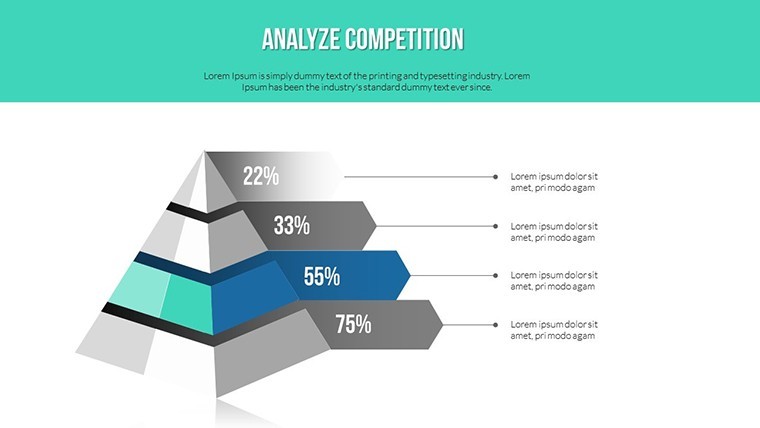
Picture this: You're an investment banker preparing a pitch for a merger involving hybrid securities. Instead of static tables, use our template's analysis charts to show how embedded derivatives impact fair value measurements. Or, as a risk manager, visualize hedging strategies against interest rate fluctuations in floating-rate notes with caps. This template shines in scenarios like quarterly earnings calls, where you need to break down derivative exposures without overwhelming your listeners.
In educational settings, finance professors can leverage these slides to teach students about the economic characteristics of embedded features, using animated transitions to simulate market scenarios. Even in consulting, advisors can customize the template to compare embedded derivatives across industries, such as energy contracts with price floors versus tech leases with purchase options. The result? Presentations that not only inform but inspire action, like approving a new hedging program.
Step-by-Step Guide to Using the Template
- Download and Open: Get the .zip file, extract, and launch in Keynote on your Mac.
- Input Your Data: Replace placeholders with your specific figures, such as derivative values or host contract terms.
- Customize Visuals: Adjust colors, add animations, and incorporate icons to fit your narrative.
- Rehearse and Present: Use Keynote's presenter notes for cues, ensuring a flawless delivery.
This workflow integrates seamlessly into your daily routine, whether you're using it alongside tools like Excel for data import or Bloomberg for real-time figures. Compared to basic Keynote setups, our template offers themed consistency, reducing design time by up to 70% based on user feedback from similar financial tools.
Benefits That Drive Results
Beyond features, the true value lies in outcomes. Users report increased engagement in meetings, with audiences grasping complex topics faster thanks to intuitive visuals. For example, a hedge fund analyst might use the bifurcation charts to demonstrate how an embedded forward contract alters investment returns, leading to quicker decision-making. The template's trustworthiness stems from its alignment with industry standards, subtly boosting your authority in presentations.
Moreover, it's not just about saving time - it's about elevating your professional image. In a field where precision is paramount, having a polished template like this signals expertise. Integrate it with your existing workflow for tasks like annual reports or client advisories, and watch how it transforms routine updates into strategic discussions.
Expert Tips for Maximum Impact
To truly shine, pair charts with storytelling. Start with a problem - like the risks of misclassifying embedded derivatives - then use slides to reveal solutions. Keep text minimal; let visuals do the talking. For virtual presentations, test animations on different devices to ensure smooth playback. And always back your data with sources, enhancing trustworthiness.
Ready to revolutionize your financial communications? This template is your gateway to more persuasive, professional presentations. Customize it today and see the difference in your next session.
Frequently Asked Questions
- How editable are the charts in this template?
- Every element is fully editable, from colors and text to animations and icons, allowing complete customization to fit your needs.
- Is this template compatible with other software besides Keynote?
- No, it's designed exclusively for Apple's Keynote on Mac, ensuring optimal performance and features.
- Can I use this for non-financial presentations?
- While optimized for finance, the versatile charts can adapt to other analysis-heavy fields like market research.
- What file formats are included?
- The download includes .key files, vector icons, and PNG elements in a .zip archive.
- How many slides does it have?
- There are 21 editable slides, covering a range of financial illustrations and analyses.