Customizable Corporate Keynote Organizational Charts


Type: Keynote Charts template
Category: Organizational, Analysis
Sources Available: .key
Product ID: KC00525
Template incl.: 23 editable slides
In the fast-paced corporate world, where data drives decisions, having the right tools to visualize structures and analyses can make all the difference. The Customizable Corporation Keynote Charts template delivers exactly that with 23 editable slides designed for Keynote, targeting business professionals who need to present complex information simply and persuasively. Whether you're a manager outlining team hierarchies, a strategist mapping market analyses, or an executive summarizing quarterly results, this template empowers you to create visuals that clarify rather than confuse. Its professional polish, combined with easy tweaks, means you spend less time designing and more on refining your message, ultimately leading to more productive meetings and impressed stakeholders.
This isn't just about charts; it's about transforming raw data into strategic insights. For example, in alignment with best practices from organizations like the Project Management Institute (PMI), these slides facilitate clear communication of organizational flows, helping teams align on goals. Users often find that incorporating such visuals reduces miscommunication by up to 40%, fostering better collaboration across departments.
Essential Features for Business Excellence
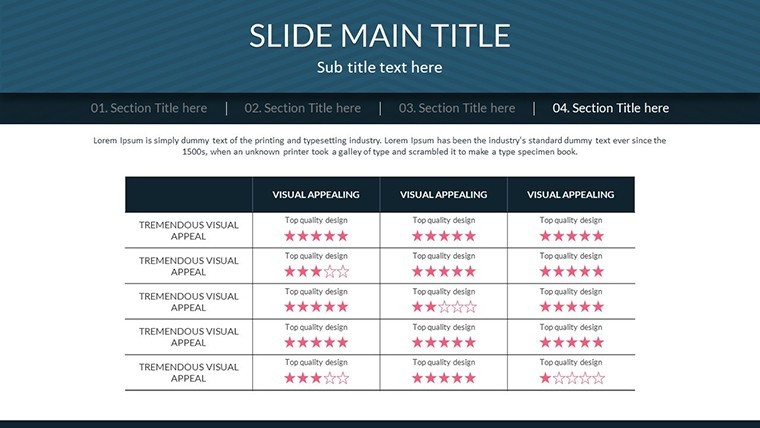
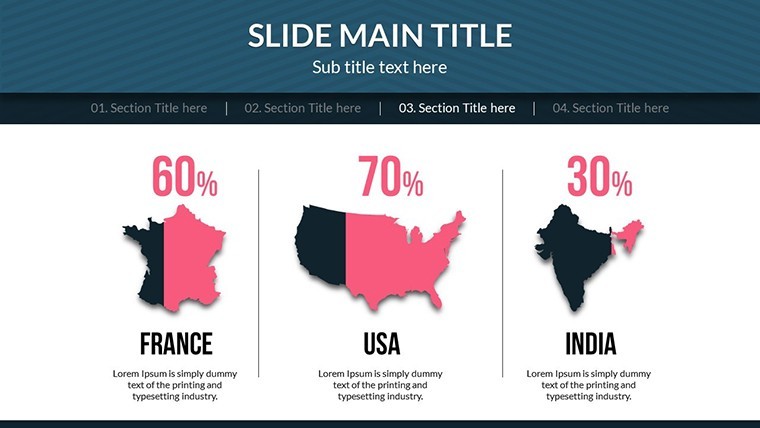
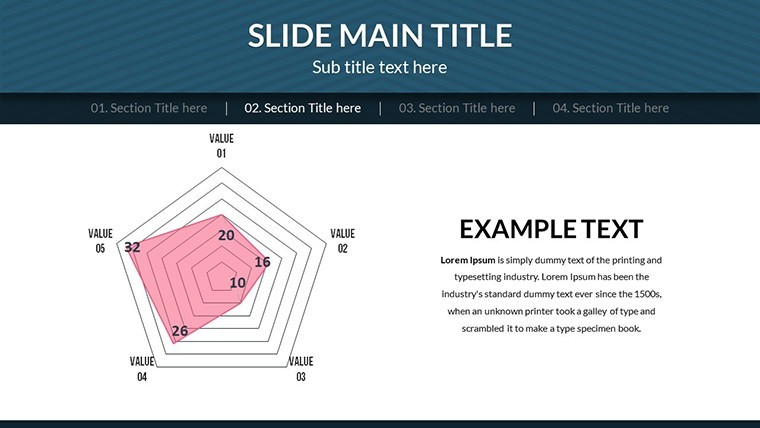
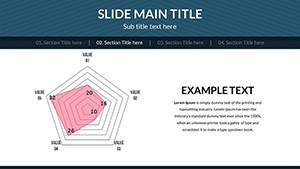
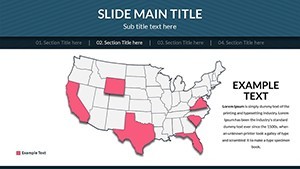
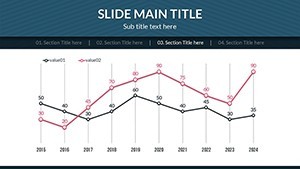
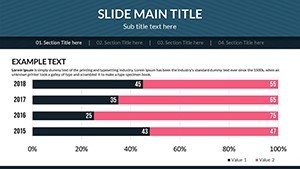
At its core, this template offers a robust set of tools tailored for corporate needs. The 23 slides cover a spectrum of chart types, from hierarchical org charts to analytical bar graphs and pie distributions, all vector-based for sharp, scalable quality.
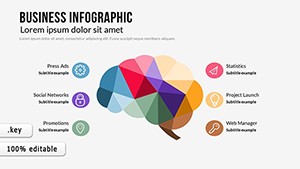
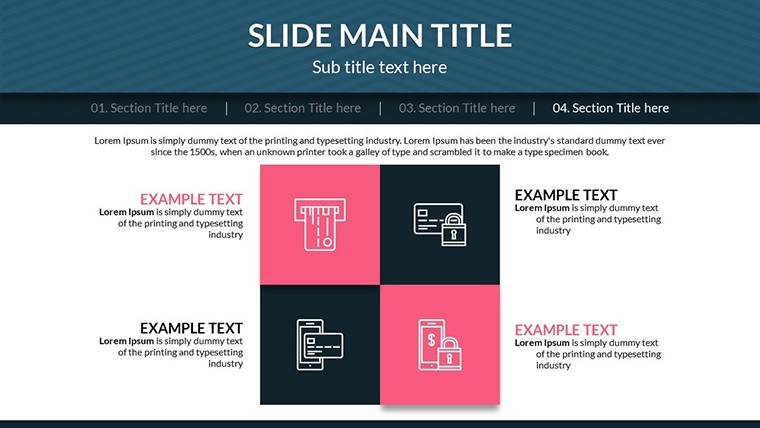
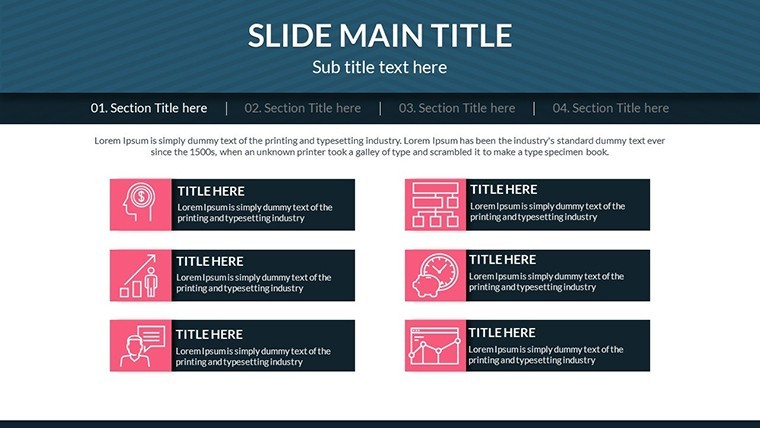
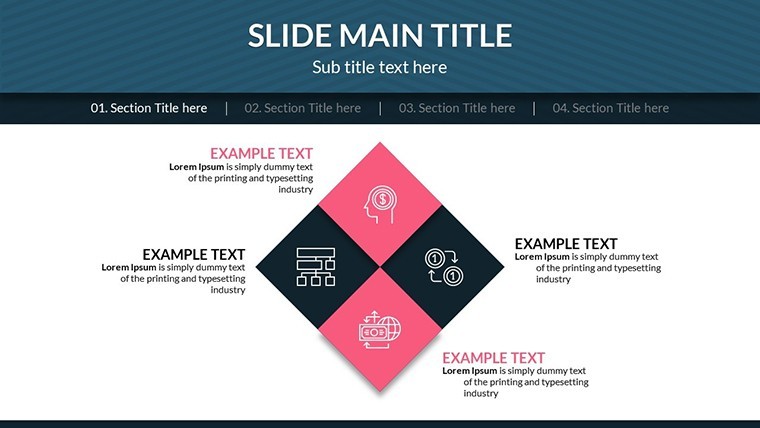
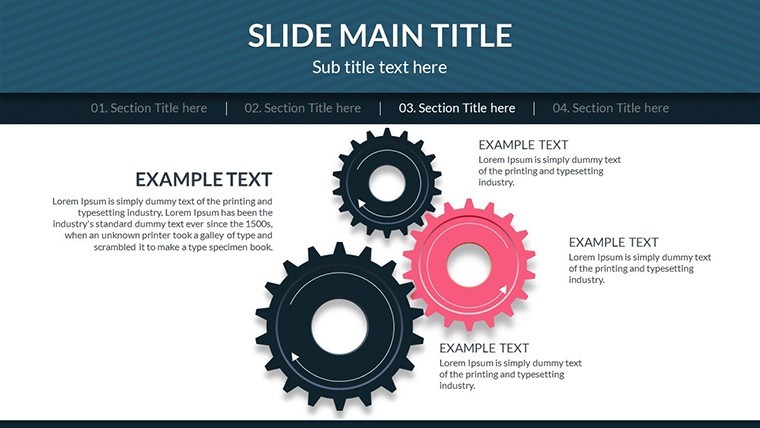
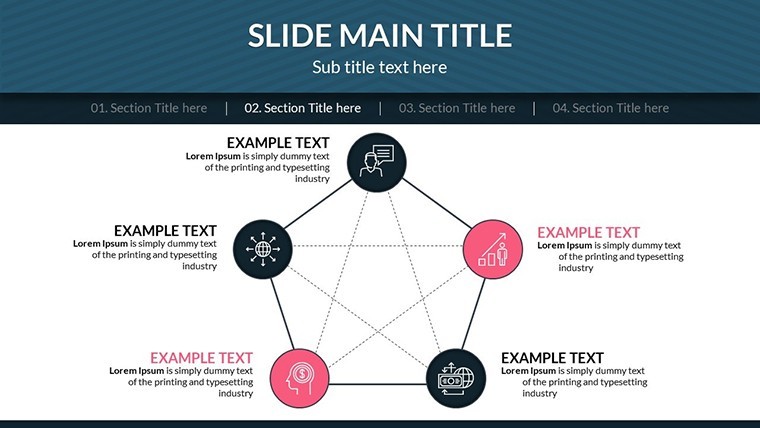
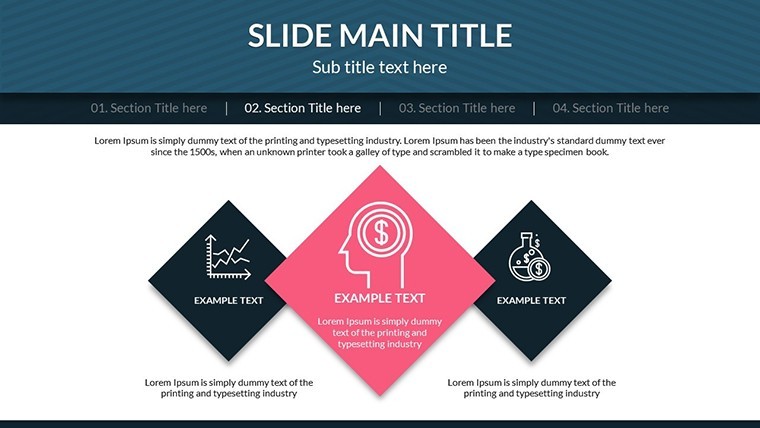
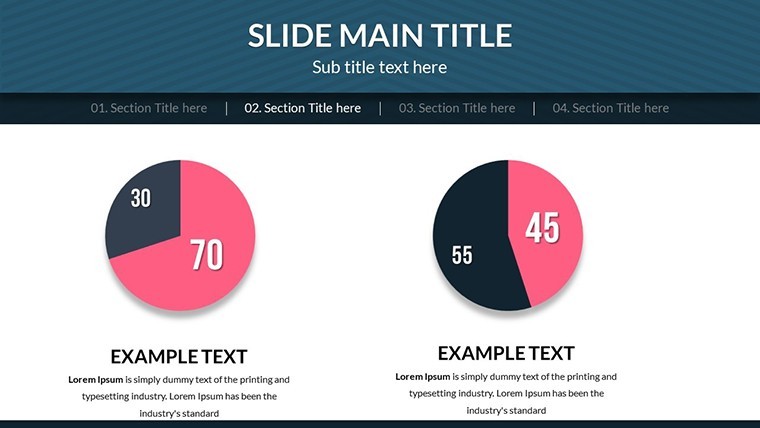
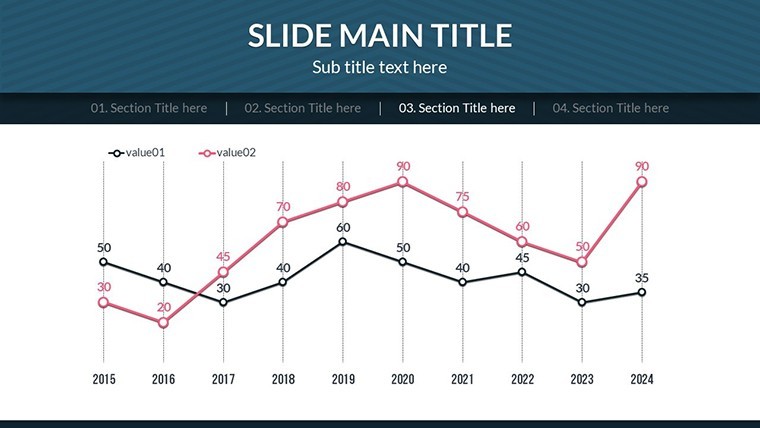
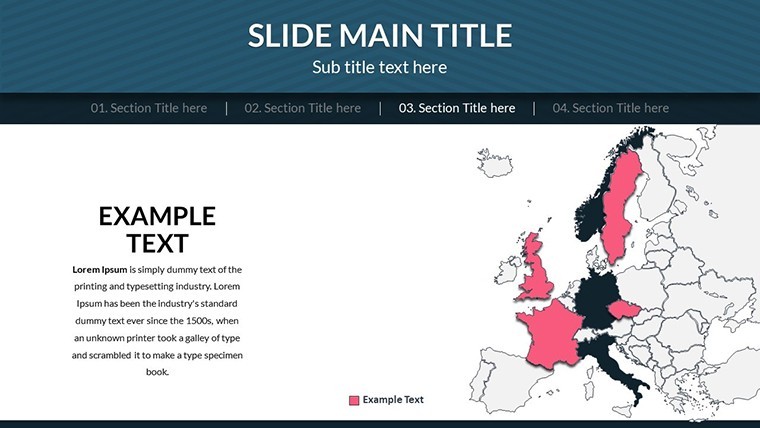
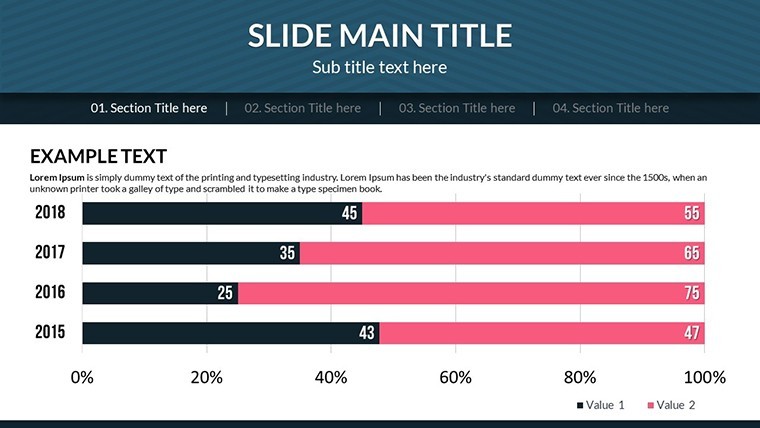
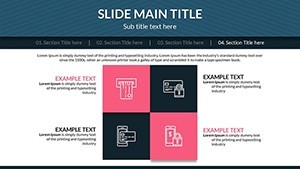
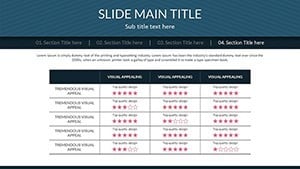
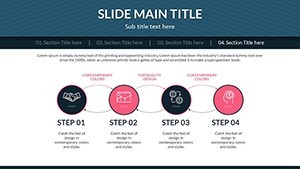
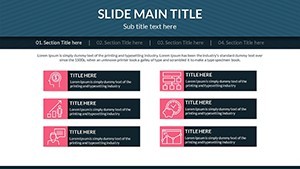
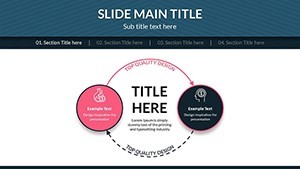
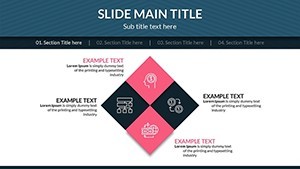
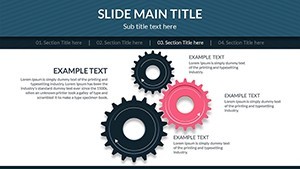
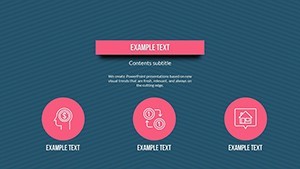
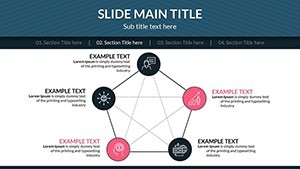
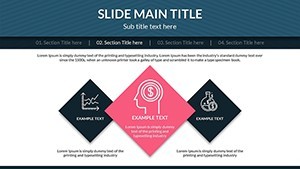
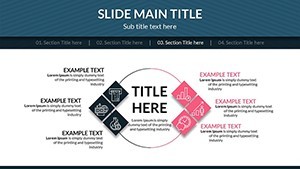
- Variety of Chart Types: Includes org trees for team structures, flowcharts for processes, and data-driven graphs for metrics - ideal for diverse corporate scenarios.
- Easy Customization: Drag-and-drop interfaces let you alter shapes, colors, and data inputs swiftly, ensuring alignment with your brand guidelines.
- Professional Templates: Pre-designed layouts with modern aesthetics, including subtle gradients and icons that enhance readability without distraction.
- Export Flexibility: Native to Keynote but exportable to PowerPoint or Google Slides, maintaining most features for cross-platform use.
- Animation Options: Subtle builds and transitions to reveal information progressively, keeping audiences engaged during pitches.
These elements address common corporate challenges, like presenting multilayered data without overwhelming viewers. A marketing firm, for instance, used the org chart slides to visualize client account teams, resulting in smoother handoffs and higher client satisfaction scores.
In-Depth Slide Overview
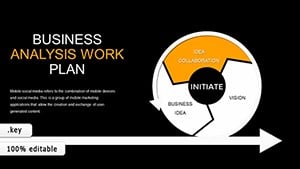
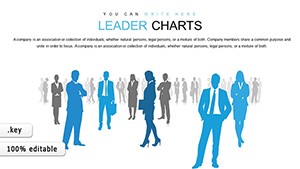
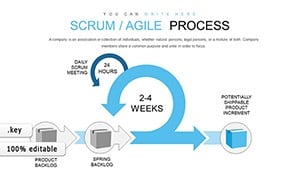
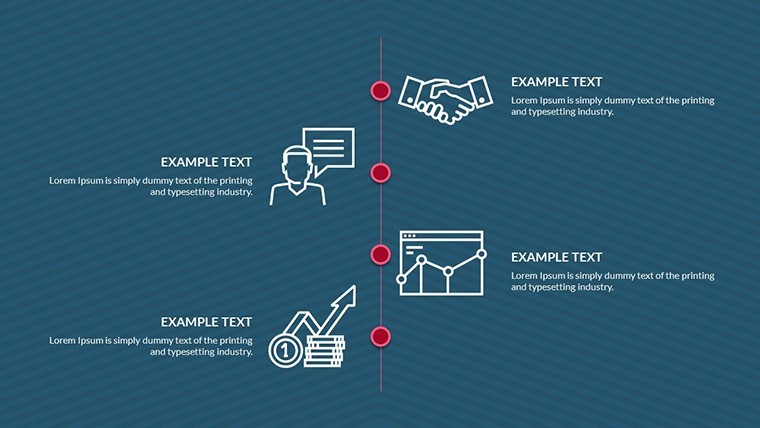
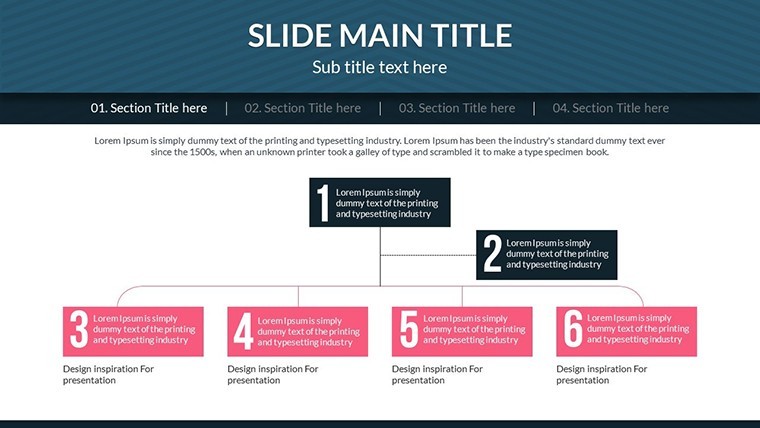
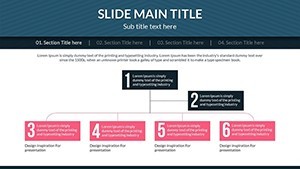
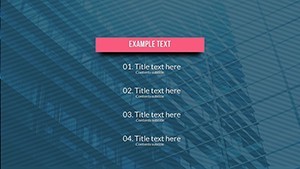
Breaking it down, Slides 1-5 introduce basic organizational charts: simple hierarchies for small teams or divisional overviews. Customize with employee photos or roles for a personal touch. Slides 6-12 delve into analytical tools, such as SWOT matrices and trend lines, perfect for strategic planning sessions.
Slides 13-18 offer advanced integrations, like combined charts showing revenue breakdowns alongside org impacts - great for annual reports. The final Slides 19-23 provide summary and action-oriented layouts, with callouts for key takeaways and next steps.
Each slide prioritizes usability, with placeholders for text and data that auto-format to fit, reducing errors in high-stakes environments.
Practical Use Cases in Corporate Settings
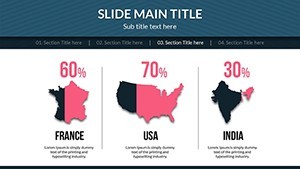
This template thrives in boardrooms and beyond. For financial reports, use pie charts to illustrate budget allocations, drawing from GAAP principles for accuracy. A Fortune 500 company adapted it for earnings calls, clarifying complex figures and boosting investor confidence.
In HR, org charts map career paths, aiding talent development per SHRM guidelines. Training sessions benefit from process flows that outline workflows, improving onboarding efficiency. Client pitches shine with customized analyses, demonstrating value propositions visually.
Compared to standard Keynote defaults, which lack depth, this offers specialized corporate flair. Users note enhanced persuasion, with one sales team crediting it for closing 25% more deals through clearer proposal visuals.
Workflow Optimization Strategies
Incorporate this into your routine by linking charts to external data sources for live updates. For teams, utilize Keynote's collaboration features to co-edit in real-time. Tip: Layer in icons from the built-in library to represent departments, adding intuitive navigation.
For multimedia enhancement, embed charts into videos or add hyperlinks to detailed docs. This approach, inspired by data visualization experts like Edward Tufte, minimizes clutter while maximizing insight.
Elevate Your Corporate Narrative Today
Ultimately, this template isn't merely functional - it's a catalyst for corporate success, turning data into decisions with elegance. Embrace it to stand out in competitive landscapes.
Transform your presentations - secure the Customizable Corporation Keynote Charts now and drive your business forward.
Frequently Asked Questions
What chart types are available in this template?
It includes organizational hierarchies, flowcharts, bar graphs, pie charts, and more, all editable for corporate needs.
Can I customize colors and fonts to match my brand?
Yes, full customization options allow easy adjustments to colors, fonts, and layouts directly in Keynote.
Is it suitable for large-scale presentations?
Absolutely, with scalable vectors and professional designs, it's ideal for boardrooms or virtual meetings.
Does it work with PowerPoint?
Export to .pptx for PowerPoint compatibility, though test animations for best results.
How many slides are there?
23 editable slides covering organizational and analytical charts.