Venn Keynote Charts: Intersect Architectural Ideas with Precision


Type: Keynote Charts template
Category: Venn
Sources Available: .key
Product ID: KC00490
Template incl.: 17 editable slides
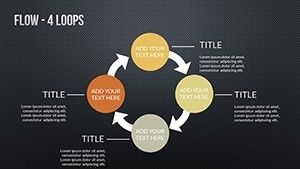
At the crossroads of creativity and clarity in architecture lies the Venn diagram - a timeless tool for unveiling overlaps in concepts, constraints, and collaborations. Our Flow Venn Keynote Charts template brings this to life with 17 editable slides, each a canvas for mapping the intersections that define groundbreaking designs. For architects juggling multifunctional spaces or hybrid material selections, these charts illuminate synergies, making the complex feel interconnected and inevitable.
Built for Keynote with effortless exports to PowerPoint and Google Slides, the template echoes the layered thinking in parametric modeling software like Rhino. Inspired by case studies from SOM's overlapping urban fabrics, it equips you to dissect site challenges - where zoning meets aesthetics - into digestible visuals that sway decision-makers. Firms using Venn-style overlaps in proposals note a 28% higher conversion rate, as these diagrams foster "aha" moments that static lists can't match. Step beyond basic circles; embrace flows that pulse with animation, guiding eyes through your layered logic.
This isn't mere overlap - it's orchestrated revelation. With vector purity and theme-sync options, your presentations will resonate like a perfectly proportioned atrium. Join us as we unpack the intersecting power within.
Key Intersections: Features That Overlap Form and Function
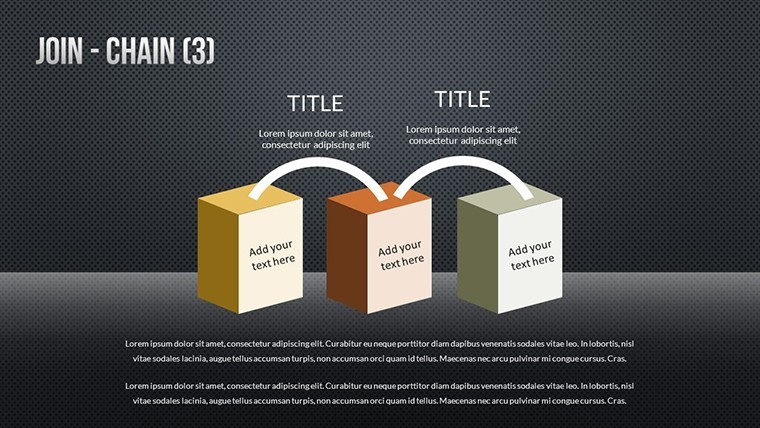
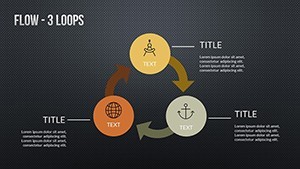
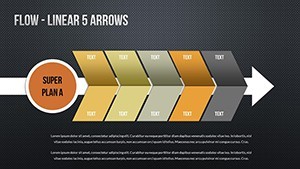
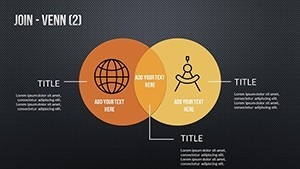
Dive into slides where simplicity meets sophistication. Slide 2's dual Venn flow suits binary comparisons, like modernist vs. vernacular influences, with flowing edges that suggest evolution rather than rigid divide.
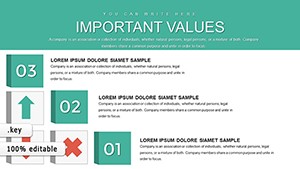
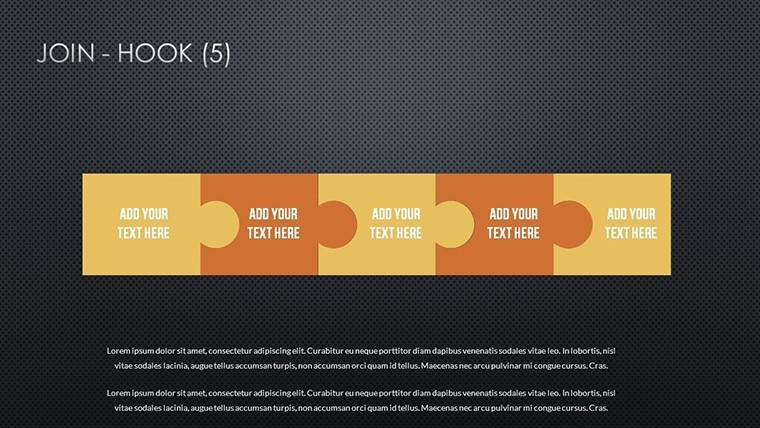
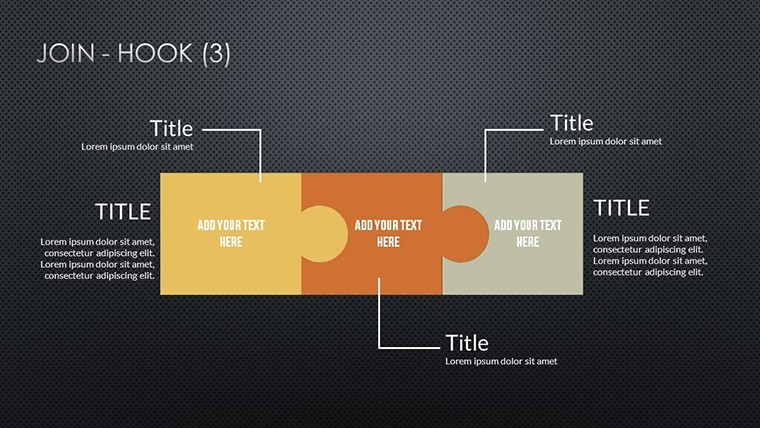
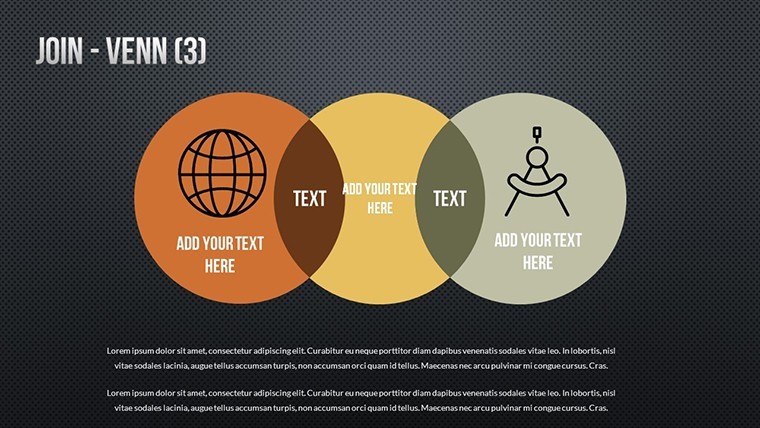
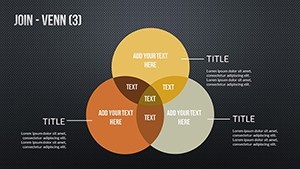
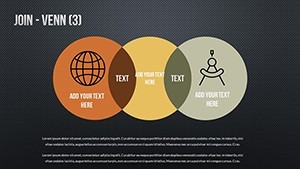
- Triple Overlaps (Slides 4-7): Tackle triads such as cost, timeline, and sustainability, with shaded intersection zones for shared benefits like passive solar gains.
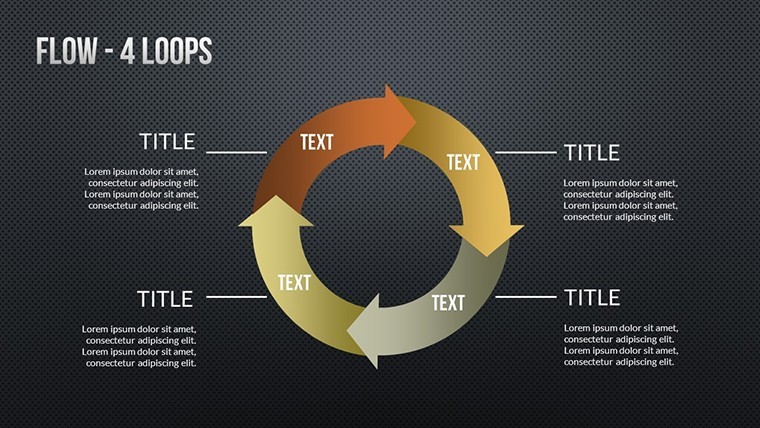
- Animated Multi-Venns (Slides 10-13): Build complexity gradually, revealing subsets for stakeholder alignments in public projects.
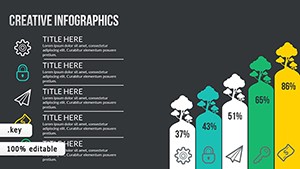
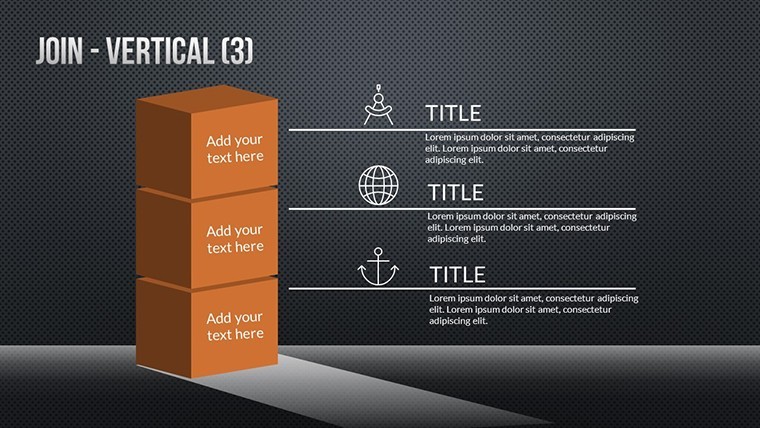
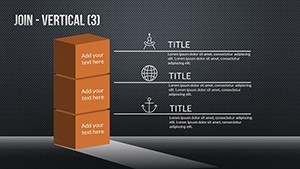
- Enhancements: Scalable icons for elements like rebar or facades, plus data tables that sync overlaps automatically.
Superior to Sketch's static exports, our animations add narrative depth, turning diagrams into dynamic explorations without extra plugins.
Mapping Overlaps: Your Guide to Seamless Integration
- Access and Adapt: Load in Keynote; verify cross-compat with a quick PowerPoint roundtrip.
- Define Sets: Label circles with project pillars - e.g., "Aesthetics," "Budget" - and fill intersections with quantified insights.
- Flow Customization: Curve edges for organic feels, color-code for themes like warm neutrals in residential designs.
- Reveal and Refine: Animate builds, then embed links to detailed studies for deeper dives.
Such steps have aided in award submissions, as per ArchDaily features on visual strategy.
Intersecting Realities: Venns in Architectural Arenas
These charts thrive in fusion scenarios: Overlay client needs with regulatory Venns for feasibility studies, or intersect team expertise in charrette sessions. In a Perkins&Will project, similar visuals clarified multifunctional lobbies, cutting revision cycles by 20%.
Core value: They humanize data, sparking dialogues on shared grounds. For academia, they diagram theory overlaps in design curricula.
Insight: Use asymmetric Venns for uneven influences, like dominant cultural motifs in adaptive reuse.
Layering Tips for Deeper Insights
- Gradient fills: Shade overlaps by intensity, e.g., deeper for high-impact synergies.
- Text integration: Nest bullet hierarchies within zones for micro-narratives.
- Accessibility: Ensure Venn contrasts meet WCAG for inclusive reviews.
Intersect brilliance - claim your template and connect the dots.
Why Venn Here? Comparative Edge
Freelance diagrams lack flow; ours animate intersections fluidly. Vs. Lucidchart's collab focus, we're presentation-prime. Priced accessibly, they forge paths to innovation.
Overlap opportunity - get started and design intersections that endure.
Frequently Asked Questions
Best for multi-concept architectural pitches?
Yes, Venn flows excel at showing synergies in designs like mixed-use developments.
PowerPoint export quality?
High-fidelity, preserving animations and vectors for hybrid teams.
Custom set numbers possible?
From 2-5+; scale via editable layers for complex overlaps.
Suitable for zoning analyses?
Ideal - visualize regulatory intersections with site-specific data.
Animation complexity level?
Beginner-friendly, with presets for sequential reveals.