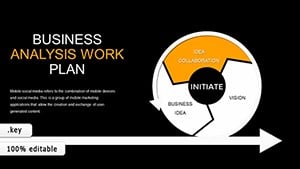
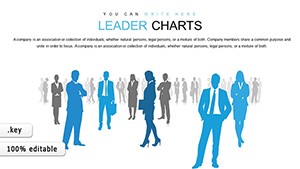
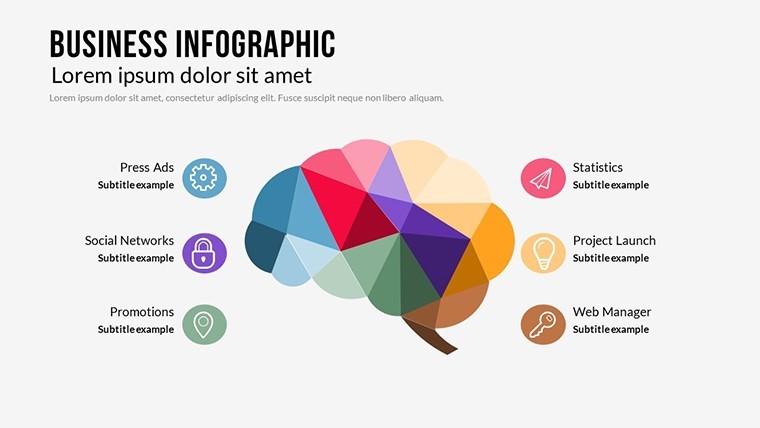
Business Infographic Keynote Charts: Craft Compelling Narratives with Ease


Type: Keynote Charts template
Category: Business Models, 3D
Sources Available: .key
Slide size: widescreen (16:9)
Product ID: KC00479
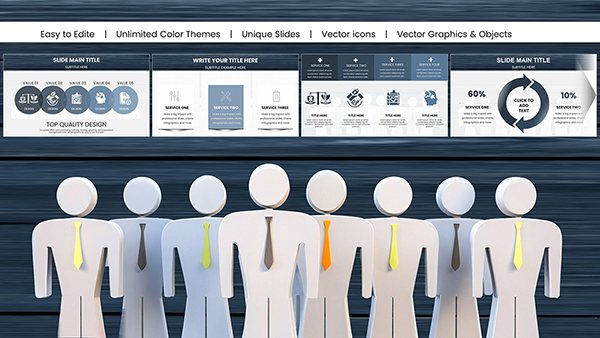
Template incl.: 21 editable slides
Business presentations often drown in numbers, but what if your infographics could cut through the noise like a well-honed strategy? Our Business Infographic Keynote Charts template is your ally in this quest, offering 21 unique, animated slides that blend creativity with clarity. Aimed at executives, analysts, and entrepreneurs, it's perfect for dissecting models, forecasting trends, or unveiling 3D projections that turn heads and spark discussions.
Flexible and scalable, every element - from vectors to smart objects - is primed for your tweaks, ensuring outputs that scale from screen shares to printed reports. Animations add a layer of sophistication, revealing layers of data like peeling back an onion to expose core insights. Drawing from design luminaries like those at Information is Beautiful, this template prioritizes simplicity without sacrificing depth, making even dense topics like revenue streams feel approachable and exciting.
The payoff? Presentations that don't just inform but inspire action. Think of a CFO animating a 3D pie chart to illustrate departmental budgets, or a product manager mapping user journeys with interconnected infographics - outcomes include quicker buy-ins and fewer follow-up questions. In an era of information overload, this tool positions you as the curator of clarity.
Standout Features: Design Meets Functionality
Peel back the layers to see what fuels this template's versatility:
- Vector and Smart Objects: All graphics are infinitely resizable, maintaining pixel-perfect quality for diverse formats.
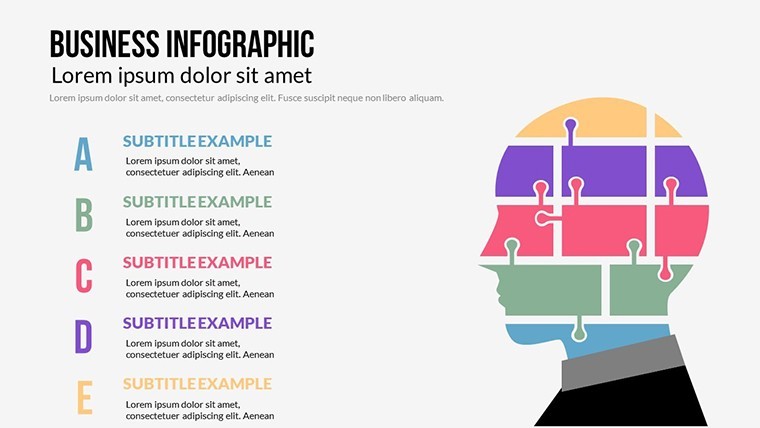
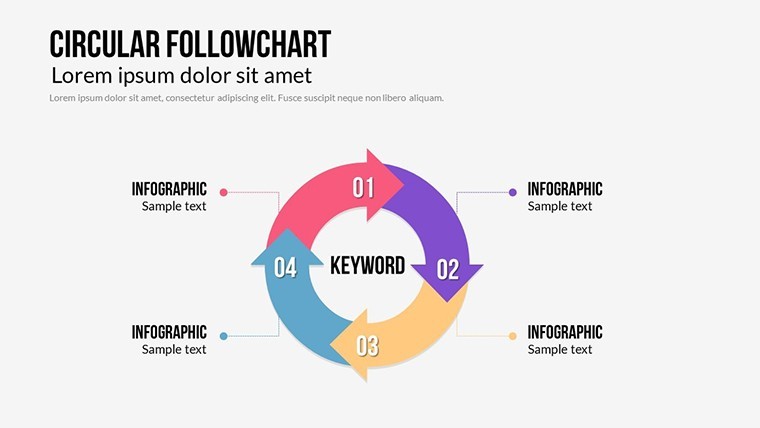
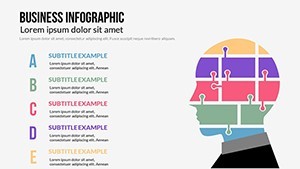
- Full Animation Suite: Subtle motions that guide focus - lines drawing themselves, icons assembling like puzzle pieces.
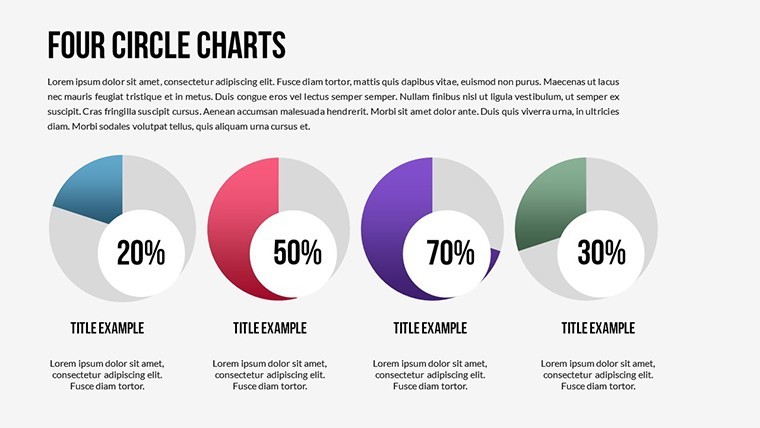
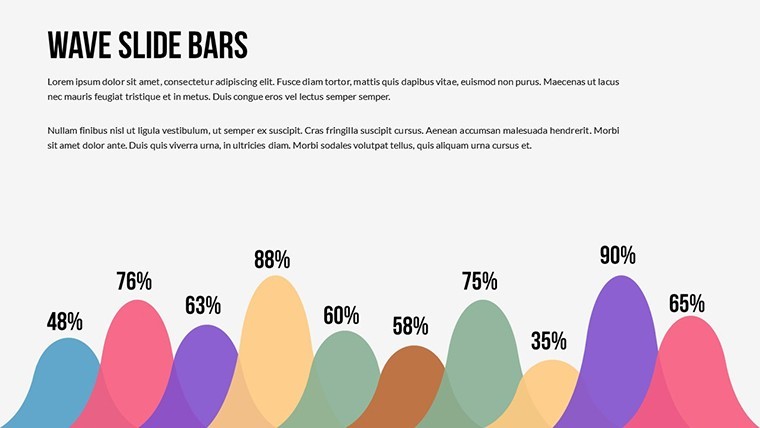
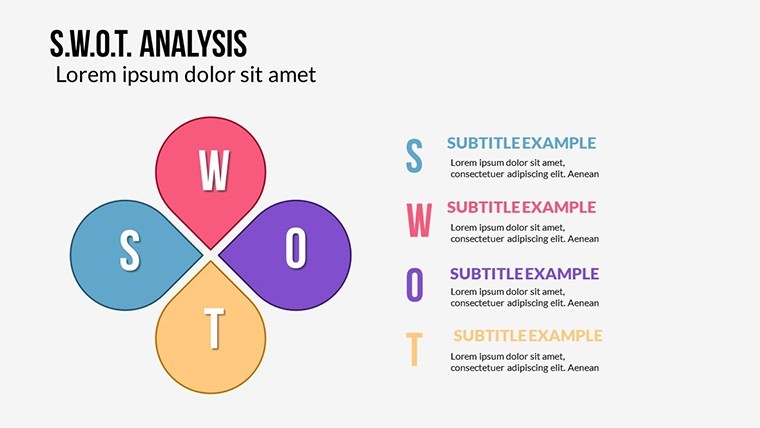
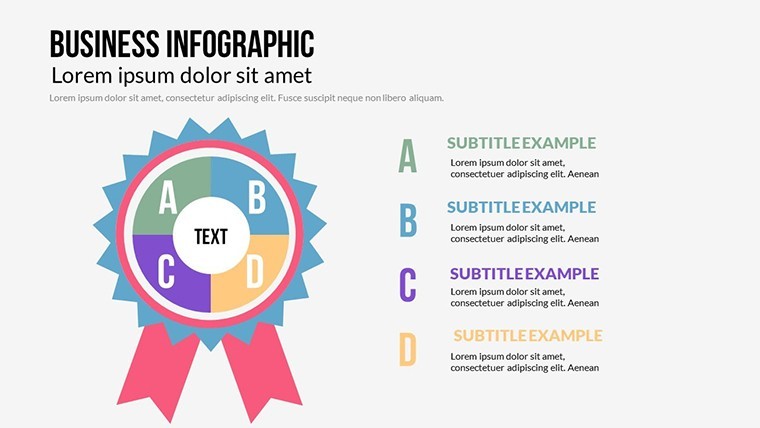
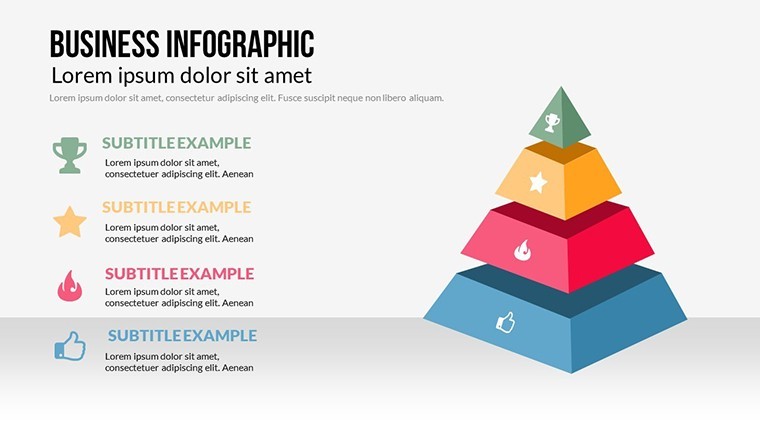
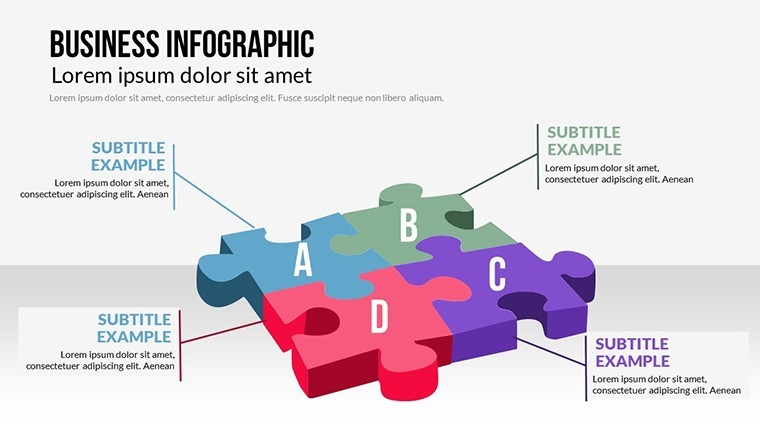
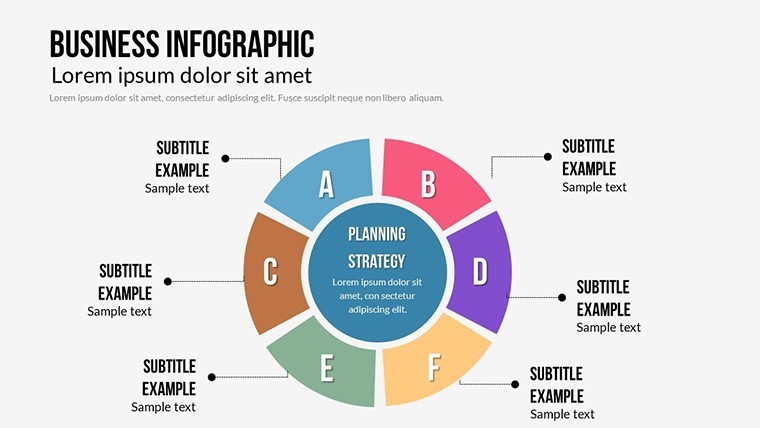
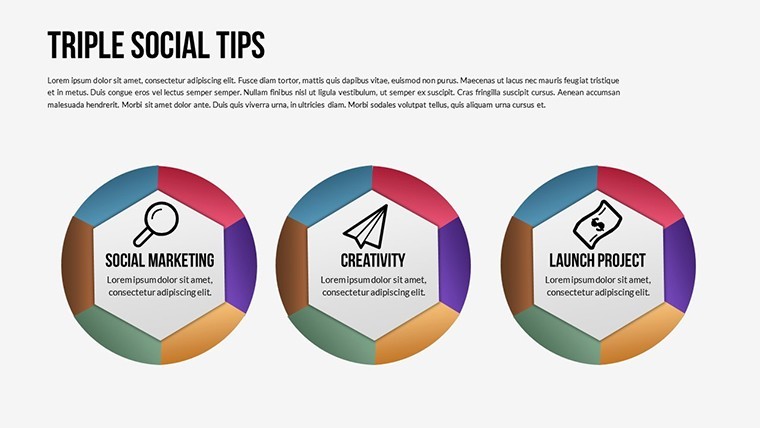
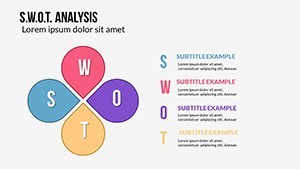
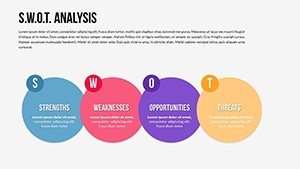
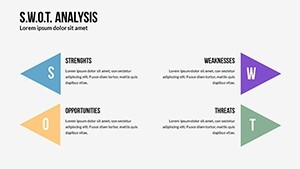
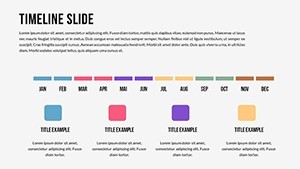
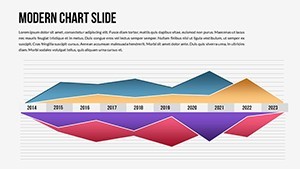
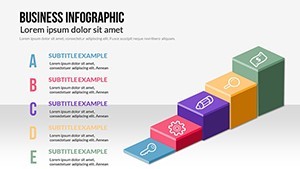
- 21 Unique Layouts: From flat hierarchies to immersive 3D models, covering business essentials like SWOT analyses and KPI dashboards.
- Effortless Editability: Layer-based structure in Keynote lets you swap colors, text, or images in seconds.
Built for Keynote pros and newcomers alike, it exports flawlessly to other formats, keeping your creative flow uninterrupted.
Practical Applications: Infographics in Action
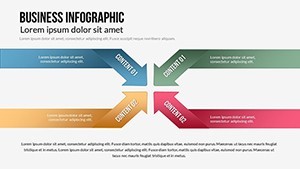
Where does it excel? In boardroom battles, animate a business model canvas to layer value propositions over revenue streams, echoing Osterwalder's frameworks for instant recognition.
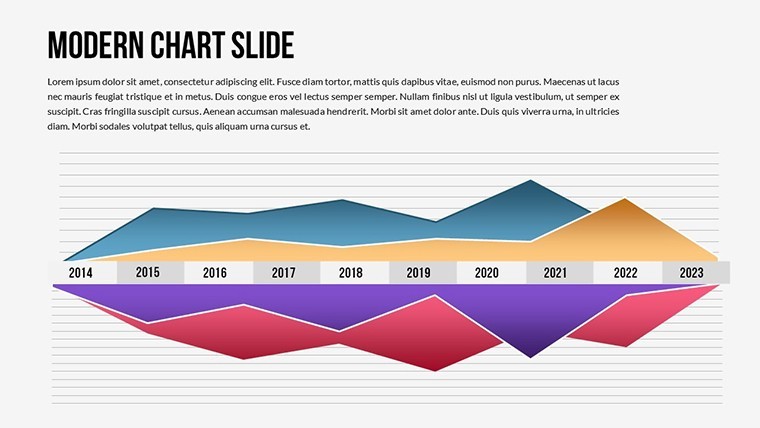
For sales teams, 3D bar charts visualize pipeline stages, popping with color to highlight bottlenecks - a tactic that's helped reps close 20% more deals in shared case studies.
- Input Core Data: Populate smart objects with your figures; auto-adjustments handle the math.
- Activate Animations: Choose build orders to sequence storytelling, from overview to details.
- Enhance with Media: Embed charts into larger decks or standalone for social media teasers.
- Review for Scalability: Zoom test to confirm vectors hold up in print or projection.
Outshines basic infographics by embedding narrative flow, reducing design time from days to hours.
Expert Customization: Infuse Your Unique Spin
Level up with tailored advice. Align vectors with your corporate identity using Keynote's shape tools - add gradients for depth in 3D elements. For humor-infused decks, animate icons with bouncy entrances to lighten financial forecasts.
A consultant's tale: Revamping a merger infographic with these slides, they layered animated timelines over org charts, clarifying integration paths and earning rave reviews from C-suite execs.
Superiority to Generic Options
Generic charts feel cookie-cutter; this delivers bespoke flair with evidence-based design, per UX research from Baymard Institute. It's your edge in competitive landscapes.
Don't settle for static - download Business Infographic Keynote Charts now and let your data dazzle. Innovation starts with the right visual voice.
Frequently Asked Questions
Are all slides fully animated?
Yes, each of the 21 slides includes customizable animations for dynamic reveals and transitions.
How scalable are the vector elements?
Perfectly - vectors ensure no quality loss, ideal for everything from emails to billboards.
Compatible with team collaborations?
Absolutely, Keynote's share features make it easy for multi-user edits without version conflicts.
Best for 3D business models?
Tailored yes, with smart objects that simulate depth for immersive model visualizations.
Time to customize a full deck?
Typically 1-2 hours for pros, thanks to pre-built, intuitive structures.