Interactive Keynote Charts Template


Type: Keynote Charts template
Category: Illustrations, Analysis
Sources Available: .key
Product ID: KC00476
Template incl.: 13 editable slides
As someone who`s crafted hundreds of client presentations over the years, I can tell you one thing: static charts kill momentum. Your audience`s eyes glaze over, questions pile up, and that crucial point about revenue growth? Lost in the noise. But with this interactive Keynote charts template, those days are gone. I`ve used it to guide marketing teams through campaign breakdowns and founders through investor pitches, turning what could be a monologue into a lively conversation.
Picture this: You`re walking a venture capitalist through your startup`s user acquisition funnel. Instead of flipping to a flat bar graph, you click a hotspot, and segments animate open one by one, revealing drop-off reasons with smooth transitions. Heads nod, questions flow naturally, and suddenly, you`re not just presenting - you`re collaborating. That`s the power here. This template packs 13 fully editable slides built right into Keynote, so no clunky add-ons or export headaches. It`s ready for your Mac, iPad, or even remote shares, keeping everything fluid and professional.
Why Interactivity Transforms Your Data Stories
In my work with consultants and project managers, I`ve seen firsthand how passive slides lead to passive listeners. This template flips the script with native Keynote features like hyperlinks, layered reveals, and over 40 animation presets - from subtle fades to dramatic zooms. It`s not gimmicky; it`s strategic. For educators explaining complex ecosystems, a treemap slide lets students hover to expand nodes, uncovering biodiversity layers without overwhelming the screen. Founders love the SWOT matrix where tapping a quadrant flips to action items, making strategy feel immediate and actionable.
The design keeps things clean and intuitive, drawing from real usability principles so your audience focuses on insights, not figuring out the tech. I`ve customized it for a creative agency to showcase portfolio metrics: a carousel slide swipes through project thumbnails, each popping metrics on interaction. No more "wait, what does this line mean?" - they explore at their pace, and you guide the discovery.
Versatile Charts for Every Presentation Need
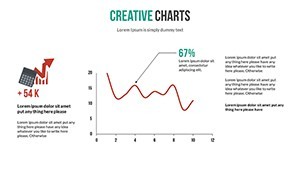
This isn`t a one-trick pony. The slides cover a spectrum of chart types, each wired for engagement. Start with the dashboard overview: clickable elements drill into sub-charts, perfect for executives scanning quarterly KPIs before diving deeper. Then there`s the animated line graph - imagine tracing sales trajectories with a mouse trail that highlights peaks and valleys in real-time, ideal for sales leaders plotting recovery post-launch.
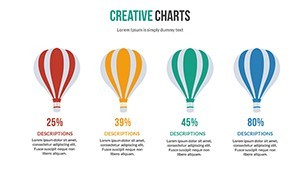
- Pie Charts with Slice Controls: Click to isolate segments, like breaking down app usage by feature in a product demo. It makes demographics tangible, helping product managers spot trends instantly.
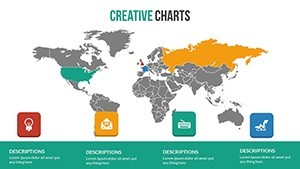
- Heatmaps and Treemaps: Color-coded intensity grids for risk assessments; I`ve used these in consulting decks to map market saturation, where warmer tones pulse on hover to emphasize hot zones.
- Timelines with Pop-Ups: Project milestones unfold sequentially, with taps revealing dependencies - game-changer for managers aligning teams on deliverables.
- Portfolio Carousels: Swipe-friendly for creatives; embed metrics that animate in as you navigate, turning a static gallery into a dynamic showcase.
Every element is vector-based, so resizing for your brand`s layout never blurs. And the color palette? Fully tweakable - vibrant blues for tech startups or earthy tones for sustainability reports. Fonts scale effortlessly, ensuring your messaging stays crisp across devices.
How It Fits Seamlessly into Your Workflow
I`ve streamlined countless prep sessions with this. Drop in your data via Keynote`s built-in tools, assign triggers to animations, and test in presenter view - all in under an hour. For branching narratives, hyperlink slides to quizzes or deeper dives, turning a linear deck into an adaptive tool. HR pros I`ve coached use it for talent reviews: a radar chart spins to compare competencies, revealing gaps that spark targeted discussions.
Compatibility shines here too. It plays nice with iPad gestures for on-the-go tweaks and exports smoothly to video for non-Apple crowds, though the full magic lives in Keynote. Inclusivity is baked in - high-contrast modes and screen-reader friendly labels mean everyone follows along, no exclusions.
Real-World Wins from Everyday Users
Think of a marketing director at a mid-sized firm: She swapped her cluttered Excel dumps for this template`s Sankey flows, watching engagement soar as teams traced lead paths interactively. Or the nonprofit coordinator who animated donor impact timelines, with pop-ups sharing stories - donations ticked up because supporters felt the difference. These aren`t hypotheticals; they`re the outcomes I see weekly. For you, it could mean closing that client faster or landing the grant with a deck that lingers.
Open it in Keynote and tweak a slide or two - see how it elevates your next talk.
Frequently Asked Questions
Can I use this interactive Keynote charts template on iPad?
Yes, it`s fully optimized for iPad, with touch-friendly hotspots and gestures that make navigation smooth during mobile presentations or edits.
How many animation options come with the slides?
There are over 40 built-in effects, from morphs and fades to pops and zooms, all adjustable for timing and triggers to match your pacing.
Is the template compatible with older Keynote versions?
It works best with Keynote 13 and later, but core interactivity holds up in versions 11+, though some advanced animations may simplify.
Can I add my own data sources directly?
Absolutely - import from CSV or copy-paste from Sheets, and the charts auto-update while keeping animations intact for quick refreshes.
Does it support team collaboration in Keynote?
Yes, share via iCloud for real-time edits, so your team can collaborate on customizations without version conflicts.
What if I need to export for non-Keynote users?
Export to PDF or video retains visuals and basic flows; for full interactivity, stick to Keynote shares or embedded links.