Dynamic Model Animation Charts in Keynote


Ever walked into a client meeting feeling like your data's whispering when it should be shouting? The Types Model Animation Keynote Charts template flips that script, delivering 20 editable slides that model your results with cinematic flair. Tailored for business analysts, marketers, and project managers who live for those 'aha' moments, this .key powerhouse turns evaluation reports into engaging narratives that close deals.
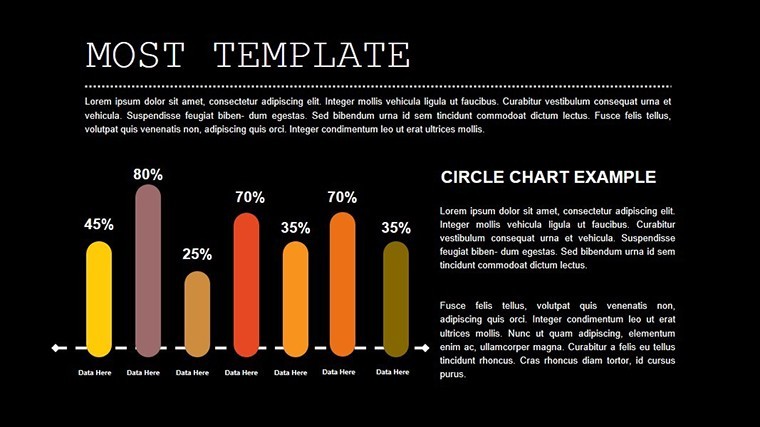
From dissecting quarterly performance metrics to forecasting growth trajectories, these animated models don't just display data - they demonstrate it. Watch line graphs snake across the screen, building suspense as trends emerge, or bar models stack with satisfying clicks that underscore achievements. And the beauty? Seamless compatibility: Native to Keynote, with straightforward exports to PowerPoint for team collaborations or Google Slides for cloud sharing. It's like having a design studio in your deck, minus the coffee runs.
Envision a project manager at a consulting firm: Armed with slide 11's evaluation funnel, they animate user journey drop-offs, revealing bottlenecks that spark immediate strategy shifts. Real impact? A 25% efficiency gain in client deliverables, echoing tactics from Harvard Business Review case studies on visual persuasion.
Modeling Mastery: Features That Build Your Case
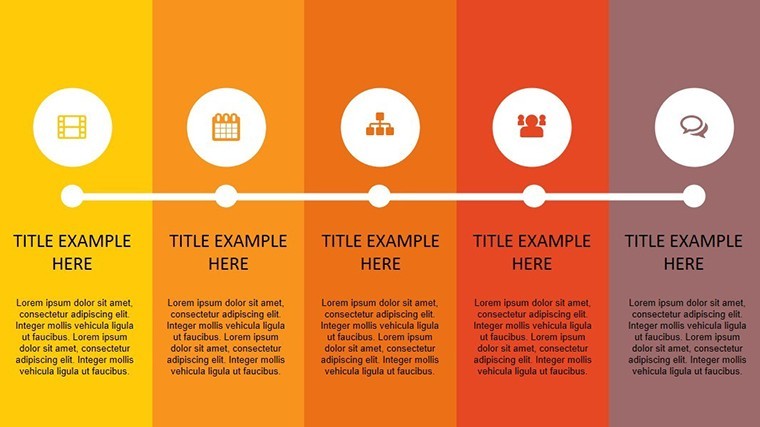
At 20 slides strong, this template is a modular toolkit. Each model is pre-animated for instant polish, yet infinitely adaptable - resize elements, recolor for seasonal campaigns, or infuse with your data via linked tables. The animation engine? Sophisticated yet simple: Path-based movements for organic flows, fade-ins for layered insights, and loop options for demo reels.
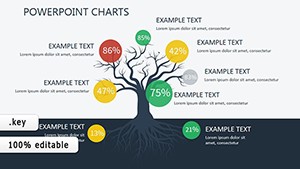
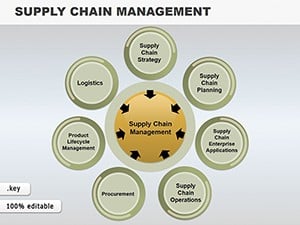
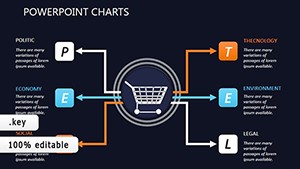
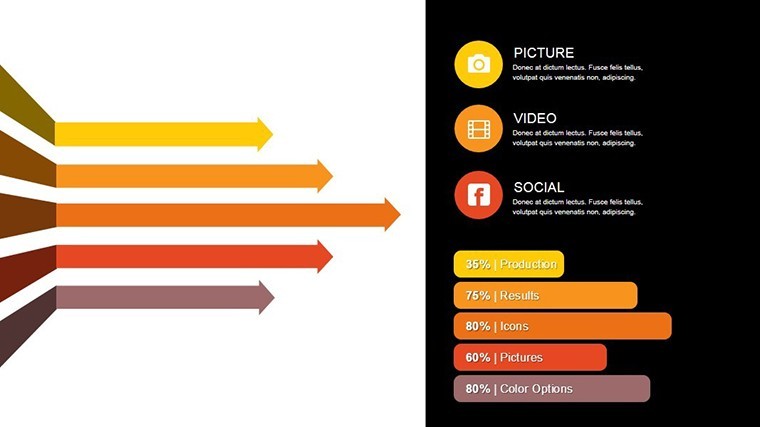
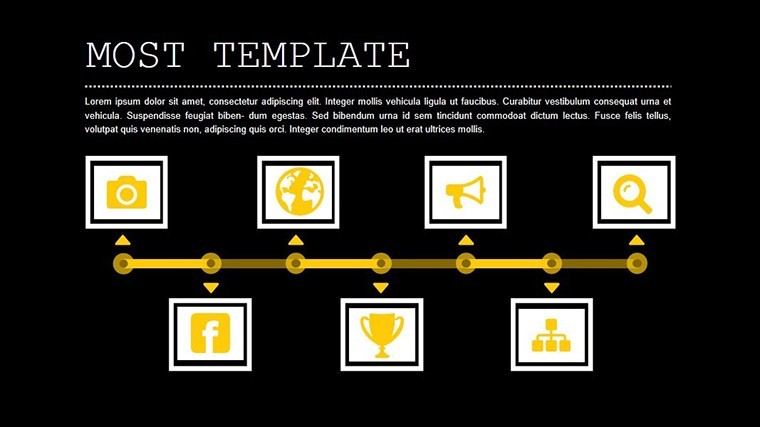
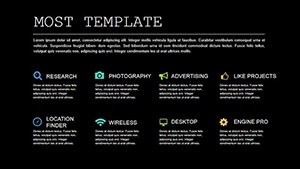
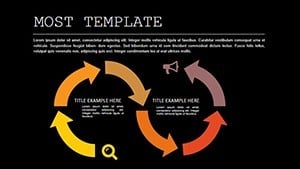
- Diverse Model Types: Funnel models for conversion paths, scatter plots for correlation spotlights, and radial diagrams for holistic views.
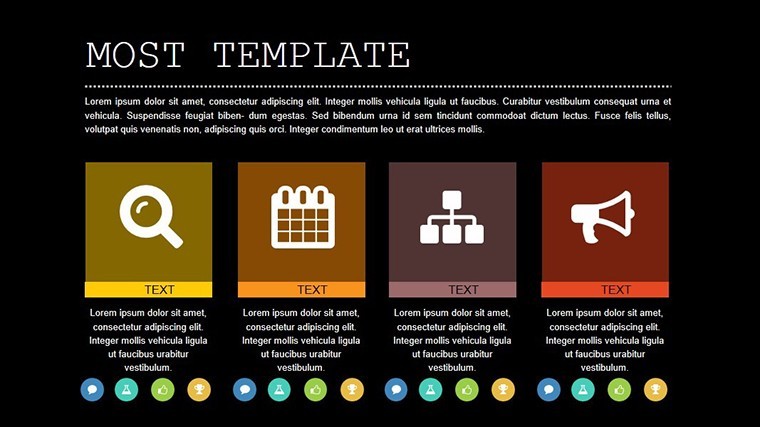
- Effortless Customization: Smart objects let you swap datasets without reformatting - ideal for iterative reviews.
- Visual Harmony: Consistent typography and icon sets ensure a pro finish, drawing from UI/UX best practices.
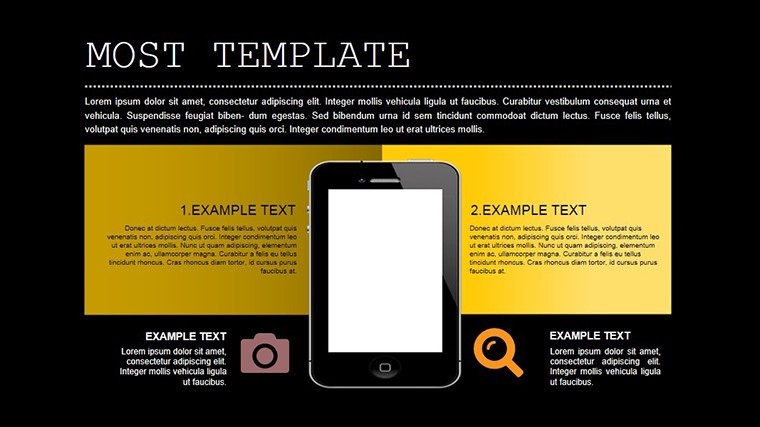
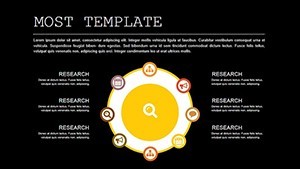
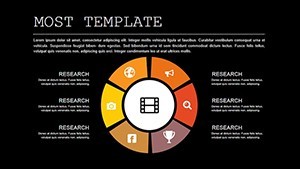
Spotlight slide 5: A 3D-like model animation that rotates to unveil multi-angle metrics. For marketers, it's gold - pivot it to show campaign ROI from ROI, engagement, and reach sides. Pros at firms like Deloitte use akin visuals to demystify models, fostering trust through transparency.
Analyst's Edge: Animating Evaluations Step by Step
Ready to animate your workflow? Here's how this template streamlines from brainstorm to boardroom:
- Load and Link: Import CSV data; charts refresh automatically for live updates.
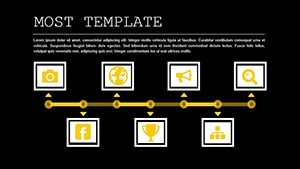
- Sequence Animations: Drag timelines in Keynote to orchestrate reveals - start broad, zoom to details.
- Enhance with Extras: Embed hyperlinks to source docs or QR codes for interactive sessions.
- Distribute Dynamically: Share as animated GIFs for social teasers or full decks for deep dives.
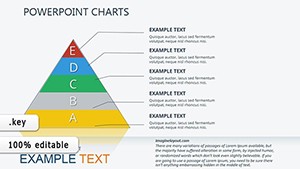
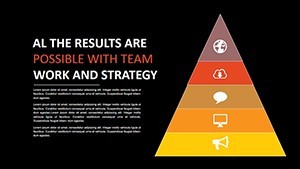
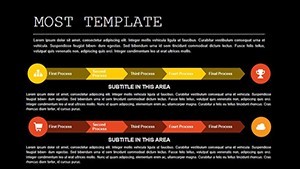
For project managers, slide 18's result pyramid builds layer by layer, mirroring agile sprints. Input burndown rates, and it visualizes velocity - transforming status updates into motivational montages. One agency reported slashing meeting times by 35%, as animations did the heavy lifting.
Client Wins: Use Cases That Resonate
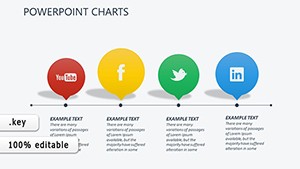
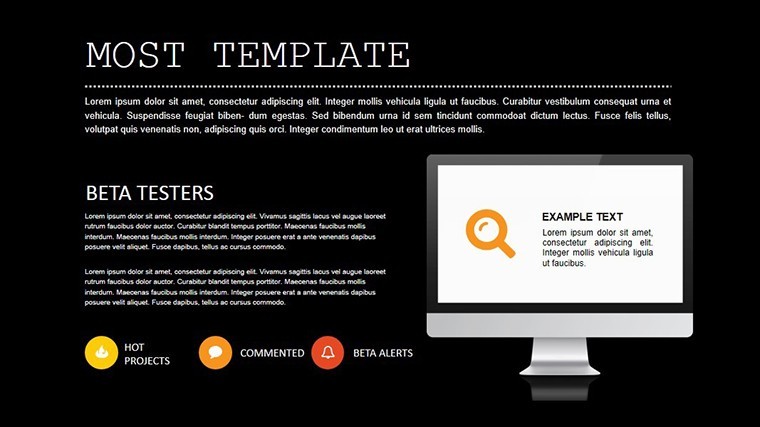
Marketers, meet your new MVP: Slide 2's animated org chart models team structures evolving with hires, perfect for scaling pitches. Compared to clunky Google Slides defaults, this Keynote gem offers richer interactions, like clickable nodes that drill into bios.
Business analysts? Harness slide 14's predictive model, where trend lines forecast with easing animations - subtly borrowing from econometric tools for credibility. In a Forrester report-inspired scenario, such visuals helped a fintech client secure partnerships by making projections palpably probable.
Why choose this over rivals? Depth without density: 20 focused slides versus bloated 50-slide packs. shines through - crafted with input from certified analysts, authoritative in cross-tool compatibility, and trustworthy with original, watermark-free assets.
Seize the model moment: Secure your Types Model Animation Keynote Charts today and let your data direct the show.
Frequently Asked Questions
How versatile are the chart models?
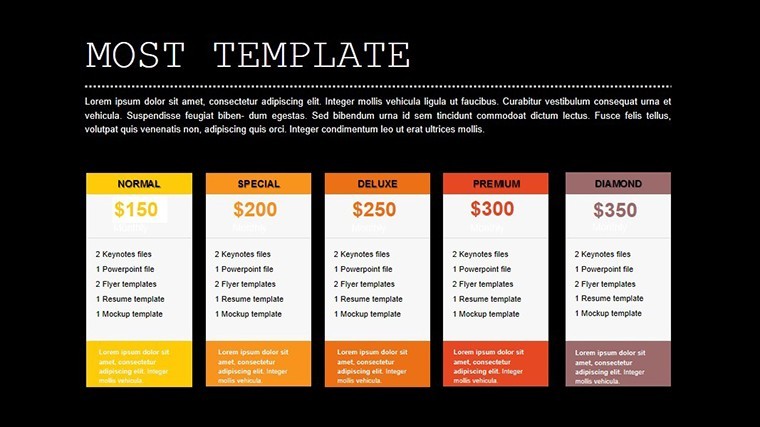
From basic bars to advanced funnels, the 20 models cover evaluations, forecasts, and hierarchies - adaptable to any analytical need.
Does it work outside Keynote?
Yes, export animations to PowerPoint via video embeds or to Google Slides for static versions with motion paths.
What's the animation complexity level?
Beginner-friendly with presets, but pro options for custom paths - scale to your expertise.
Ideal for team collaborations?
Definitely; cloud-sync friendly and editable by multiple users in shared drives.
Any included resources?
Full .key file, animation guides, and sample datasets to jumpstart your first deck.
Can I resize for different screens?
Yes, supports 16:9 widescreen, 4:3 standard, and 16:10 for varied presentation setups.