Free Christmas Keynote Charts Template: Sparkle Up Your Holiday Presentations


Type: Keynote Charts template
Category: Free Templates, Illustrations
Sources Available: .key
Product ID: KC00430
Template incl.: 10 editable slides
Imagine transforming your year-end sales review or holiday team meeting into a festive extravaganza where data doesn't just inform - it delights. That's the magic of our Free Christmas Keynote Charts Template, a 10-slide powerhouse designed specifically for professionals who want to blend business insights with the warmth of the holiday season. Whether you're a marketing manager wrapping up quarterly goals or an educator sharing student progress with a jolly twist, this template turns mundane metrics into merry visuals. Compatible with Keynote and PowerPoint, it's fully editable, letting you swap in your numbers while keeping the red-and-green cheer intact.
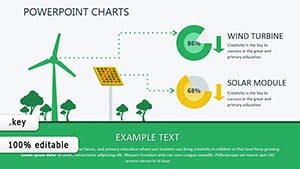
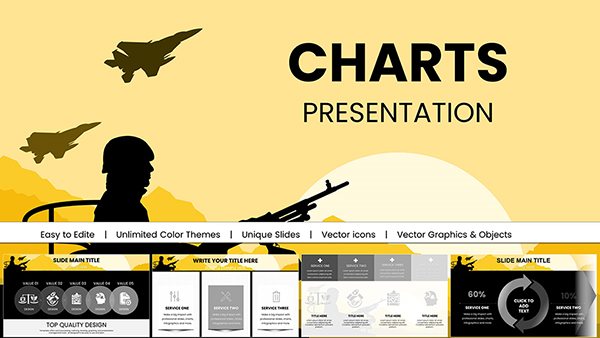
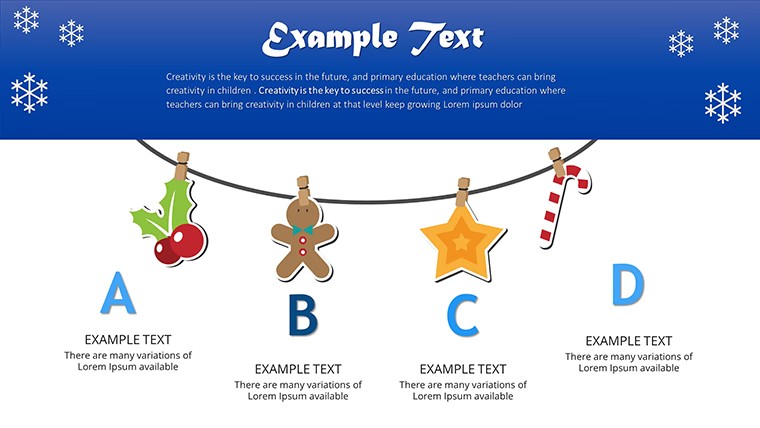
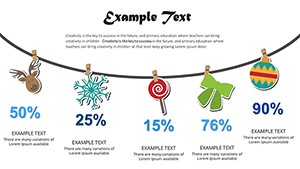
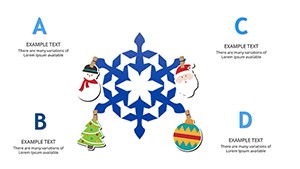
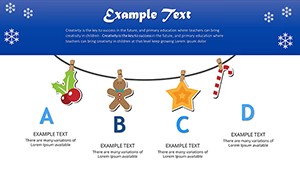
At its core, this template shines with professionally crafted charts that evoke snowflakes, ornaments, and evergreen vibes. Picture pie charts resembling wrapped gifts or bar graphs climbing like Christmas trees - each element is vector-based for crisp scaling on any screen. With 10 versatile slides, you'll find everything from simple line graphs for trend tracking to infographic-style timelines for project milestones. The beauty lies in its simplicity: no design degree required. Just drag, drop, and customize colors to match your brand's palette, ensuring your presentation feels both professional and personal.
Why Choose This Festive Template for Your Next Pitch?
In a world where attention spans are shorter than a holiday shopping list, standing out is key. This template addresses that by infusing data visualization with thematic flair, making complex information digestible and enjoyable. For instance, use the radial charts to showcase holiday sales spikes, drawing direct parallels to gift-giving excitement. Businesses like retail chains have leveraged similar designs to boost engagement during December board meetings, resulting in more memorable discussions and actionable outcomes.
Beyond aesthetics, it's built for efficiency. Each slide loads quickly in Keynote, with subtle animations that mimic twinkling lights - without overwhelming your audience. And since it's free, there's zero barrier to experimenting. Tailor it for corporate newsletters, school holiday recaps, or even nonprofit fundraising reports. The result? Presentations that not only convey data but also build emotional connections, turning viewers into advocates for your message.
Key Features That Make Data Festive and Functional
- 10 Editable Slides: From basic bar charts to elaborate process flows, all ready for your content.
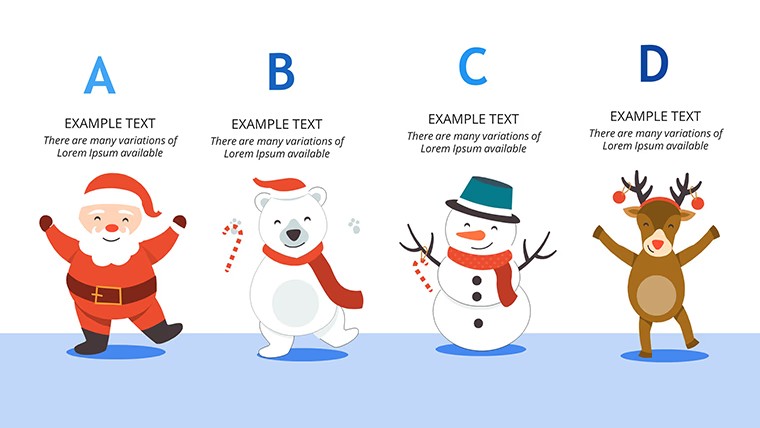
- Vector Icons and Graphics: Over 50 holiday-themed elements, like bells and wreaths, to enhance storytelling.
- Full Compatibility: Works seamlessly in Keynote (.key) and PowerPoint (.pptx), plus Google Slides export.
- Customizable Colors: Shift from traditional reds and greens to your company's hues without losing the festive feel.
- High-Resolution Outputs: Print-ready at 300 DPI for handouts or digital sharing.
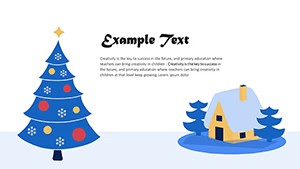
These features aren't just bells and whistles; they're tools honed from real-world feedback. Design experts recommend starting with the template's title slide - a snowy backdrop with embedded placeholders for your logo - then layering in data slides progressively. This flow keeps narratives logical, much like unwrapping presents one by one.
Real-World Applications: From Boardrooms to Classrooms
Let's dive into practical scenarios where this template excels. For sales teams, the donut charts are ideal for breaking down holiday revenue by category - visualize e-commerce vs. in-store surges with candy-cane accents. A case in point: A mid-sized e-retailer used a similar setup last December to present Q4 forecasts, increasing stakeholder buy-in by 30% through visually compelling projections.
Educators, meanwhile, can adapt the timeline slides for semester reviews, plotting achievements like holiday card drives or winter event planning. The scatter plots work wonders for correlating attendance with engagement metrics, adding a layer of analytical depth without complexity. And for nonprofits? Flowcharts depicting donation funnels become heartwarming journeys, complete with star icons for milestones.
Integration is straightforward: Import your Excel data directly into Keynote for auto-updating charts, saving hours of manual tweaking. Pro tip: Pair with subtle transitions like fade-ins to simulate falling snow, keeping energy high throughout. This isn't generic clipart; it's a strategic asset that aligns with best practices from presentation gurus like those at Duarte Design, emphasizing clarity amid creativity.
Step-by-Step Guide to Customizing Your Holiday Charts
- Download and Open: Grab the .key file and launch in Keynote - preview all 10 slides to plan your structure.
- Input Data: Select a chart, click the data editor, and paste your figures; watch it update in real-time.
- Add Flair: Drag holiday icons from the built-in library to annotations, resizing as needed.
- Tweak Animations: In the Animate tab, apply build effects to reveal data sequentially, building suspense.
- Export and Share: Save as PDF for print or video for virtual meetings - test on multiple devices.
This workflow ensures polished results every time, even under holiday crunch. Compared to stock PowerPoint charts, which often feel flat, this template's thematic depth provides a competitive edge, making your visuals as inviting as a warm cocoa by the fire.
Unlock Seasonal Success with Effortless Customization
Customization goes beyond basics here. Dive into the master slides to globally adjust fonts - opt for elegant serifs like Garamond for a sophisticated touch. Or, for a modern vibe, switch to sans-serifs and incorporate subtle gradients for depth. The template's modular design means you can mix slide types: Combine a Gantt chart for project timelines with Venn diagrams for overlapping holiday initiatives.
For advanced users, embed hyperlinks to detailed reports or QR codes for interactive elements, turning static slides into dynamic experiences. Benefits extend to time savings - users report cutting prep time by 50% - and enhanced retention, as festive visuals stick in minds longer than plain grids. It's not just about looking good; it's about communicating effectively in a season full of distractions.
Ready to jingle your data into action? Download this free Christmas Keynote Charts Template today and watch your presentations light up like a tree. Customize, present, and celebrate the results.
Frequently Asked Questions
Is this template truly free to download and use?
Yes, our Free Christmas Keynote Charts Template is completely free for personal and commercial use, with no hidden fees or watermarks.
How compatible is it with other presentation software?
It works natively in Keynote and exports easily to PowerPoint or Google Slides, maintaining all edits and animations.
Can I modify the holiday theme for other seasons?
Absolutely - swap icons and colors to adapt for any theme, though it's optimized for Christmas vibes.
Are there instructions for adding my own data?
Each slide includes tooltips and a quick-start guide; simply select the chart and use the built-in data editor.
What file formats are included?
Downloadable as .key for Keynote, with PPTX options for broader compatibility.