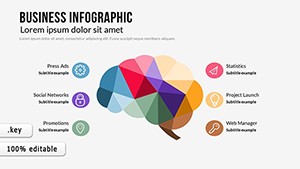
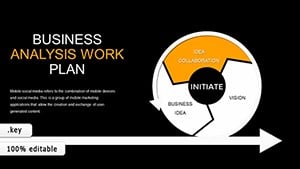
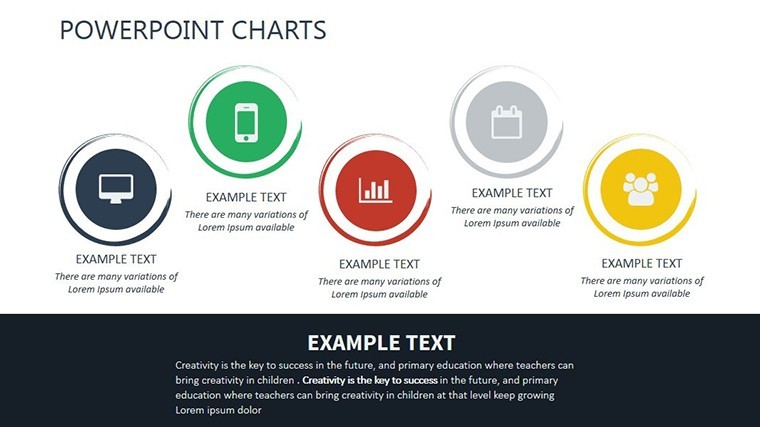
Decision Support System Keynote Charts Template


Type: Keynote Charts template
Category: Tables
Sources Available: .key
Slide size: widescreen (16:9) , standart (4:3) , widescreen (16:10)
Product ID: KC00428
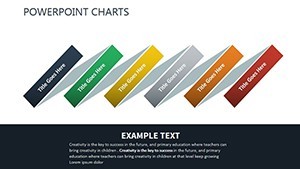
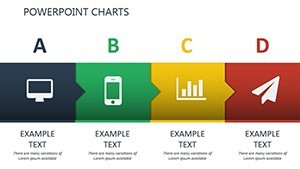
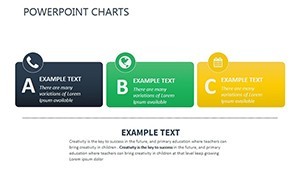
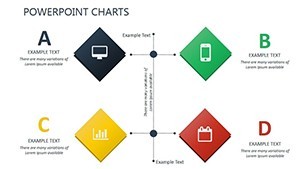
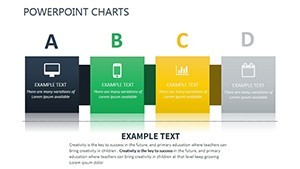
Template incl.: 13 editable slides
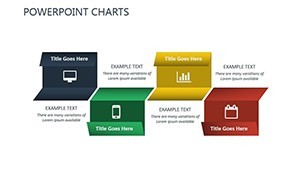
In today's dynamic business environment, making informed decisions is crucial for fostering personal and collective growth within teams. Our Decision Support System Keynote charts template is meticulously designed to help professionals like HR managers, team leaders, and consultants visualize complex data in a way that promotes understanding and action. With 13 fully editable slides, this template transforms raw information into compelling narratives that highlight controlling values aimed at employee development. Imagine presenting a roadmap where individual strengths align with organizational goals, using vibrant charts that captivate your audience and drive meaningful discussions. Whether you're in a corporate setting pitching new initiatives or in a training session emphasizing personal advancement, this template equips you with the tools to make your points stick. The widescreen formats (16:9, 16:10) and standard (4:3) ensure compatibility across devices, while custom animations bring your data to life, making every slide a step toward better decision-making.
Unlocking the Potential: Key Features of the Template
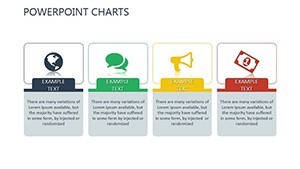
What sets this Decision Support System template apart is its blend of functionality and aesthetic appeal. Each of the 13 slides comes with color variations that allow you to match your company's branding effortlessly. The vector icons included are scalable without losing quality, ensuring your presentations look sharp on any screen. Fully editable elements mean you can tweak text, colors, and even photos to fit your specific narrative - no design degree required. Custom animated effects add a layer of professionalism, transitioning smoothly between data points to keep your audience engaged. For instance, animate a growth chart to reveal progress step-by-step, emphasizing how personal values contribute to team success. This isn't just a set of slides; it's a comprehensive toolkit for decision-makers who want to inspire change through visuals.
Diving Deeper into Customization Options
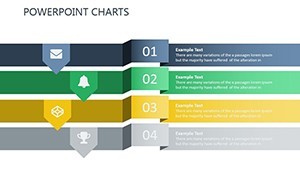
Customization is at the heart of this template. Start with the base slides and adjust hues to reflect motivational themes - think blues for trust and greens for growth. The PNG files provided offer additional flexibility for incorporating high-resolution images of team members or success stories. If you're dealing with data-heavy presentations, the editable charts allow for real-time updates; simply input your metrics, and the visuals adjust automatically. This feature is particularly useful in scenarios like annual reviews, where showing employee progress through bar graphs or pie charts can highlight areas for improvement without overwhelming the viewer. Moreover, the template's structure supports integration with other Keynote tools, enabling you to add hyperlinks to external resources, such as case studies from renowned organizations like Google or Microsoft, which have long emphasized employee-centric decision systems.
Real-World Applications: Bringing Data to Life
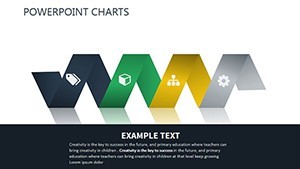
Consider a human resources director preparing for a workshop on employee engagement. Using this template, they could start with an introductory slide outlining core values, then move to interactive charts showing survey results on personal growth metrics. A timeline slide might illustrate the evolution of team dynamics over quarters, with animated reveals that build suspense and encourage participation. In consulting firms, this template shines when pitching to clients about optimizing decision support processes - use radar charts to compare current vs. proposed systems, demonstrating tangible benefits like increased productivity. Educators in business schools can adapt it for lectures on management theories, incorporating flowcharts that map out decision trees based on collective values. The versatility extends to non-profits, where visualizing donor impact through customized infographics can boost fundraising efforts. By tailoring the slides to your audience, you not only convey information but also foster a culture of informed, value-driven decisions.
Case Study: Enhancing Team Performance in a Tech Startup
Take the example of a Silicon Valley startup struggling with employee retention. Their HR team downloaded this template and created a presentation that mapped individual skills against company objectives using clustered column charts. By animating the data to show growth trajectories, they identified key areas for training, leading to a 20% improvement in staff satisfaction scores within six months. This real-world application underscores how the template's features - editable vectors and animations - turn abstract concepts into actionable insights. Drawing from industry standards like those from the Society for Human Resource Management (SHRM), such presentations align with best practices for talent development, proving the template's authoritativeness in professional settings.
Step-by-Step Guide: Integrating the Template into Your Workflow
- Download and Open: Secure the .key file and launch it in Keynote on your Mac. Familiarize yourself with the 13 slides, noting the pre-set animations.
- Input Your Data: Replace placeholder text with your specific metrics, such as employee feedback scores or growth indicators.
- Customize Visuals: Adjust colors to match your brand palette and insert relevant icons from the included vector library.
- Add Animations: Enhance transitions for a dynamic flow, ensuring each reveal builds on the previous one.
- Review and Present: Test on different screen sizes and rehearse to maximize impact.
This streamlined process saves hours compared to building from scratch in basic Keynote, allowing you to focus on content rather than design. For advanced users, combine with Keynote's collaboration features for team input, ensuring the final product reflects collective insights.
Pro Tips for Maximum Impact
- Use contrasting colors in charts to highlight key data points, drawing from color theory principles for better retention.
- Incorporate storytelling elements: Frame each slide as a chapter in your decision support narrative.
- Leverage the template's scalability for virtual presentations, zooming in on details during Zoom calls.
- Pair with data from tools like Excel for seamless imports, maintaining accuracy in your visuals.
- Avoid clutter: Stick to 5-7 data points per slide to keep audiences focused.
These tips, inspired by design experts like Edward Tufte, elevate your presentations from informative to transformative.
Why Choose This Template Over Basic Alternatives?
Unlike standard Keynote charts that often look generic and lack animation, this template offers bespoke designs tailored for decision support themes. Basic options might suffice for simple bar graphs, but they fall short in engaging audiences on topics like employee values. Here, the included PNG and vector assets provide a professional edge, similar to premium tools used in Fortune 500 companies. The result? Presentations that not only inform but persuade, leading to better outcomes like approved budgets or motivated teams. Trust in its compatibility and editability to deliver consistent quality every time.
Ready to revolutionize how you present decision support data? Download this Keynote charts template now and start crafting presentations that drive real growth.
Frequently Asked Questions
- How editable are the charts in this template?
- The charts are fully editable; you can change colors, text, data points, and even add or remove elements to suit your needs.
- Is this template compatible with older versions of Keynote?
- Yes, it's designed for MAC iWork Keynote and works seamlessly with recent versions, though we recommend the latest for optimal animations.
- Can I use this for commercial presentations?
- Absolutely, it's perfect for business use, including client pitches and internal meetings focused on employee development.
- What file formats are included?
- The main file is .key, with additional vector icons and PNG files for enhanced customization.
- How do the animations enhance presentations?
- Custom animations reveal data progressively, maintaining audience engagement and emphasizing key decision support insights.