Algorithmic Trading Keynote Charts Template: Visualize Financial Strategies with Ease


Type: Keynote Charts template
Category: Relationship, Illustrations
Sources Available: .key
Product ID: KC00419
Template incl.: 11 editable slides
In the high-stakes world of finance, algorithmic trading demands tools that can keep pace with rapid data flows and complex relationships. The Algorithmic Trading Keynote Charts Template rises to the challenge, offering 11 editable slides dedicated to relationship diagrams and illustrative charts. Designed for traders, analysts, and financial consultants, this template turns raw statistical information into compelling visuals that inform critical decisions. Picture illustrating market trends through interconnected nodes or comparing asset performances with intuitive graphics - all while maintaining a professional edge. Fully compatible with Keynote, it allows effortless customization of elements to reflect real-time data, ensuring your presentations not only educate but also influence organizational strategies. From depicting monetary stacks in financial charts to rolling stock comparisons, this template provides a clear lens for measuring and advising on data-driven actions, making it an essential asset for anyone navigating the algorithmic trading landscape.
Standout Features for Financial Visualization
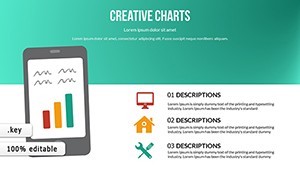
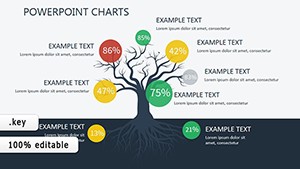
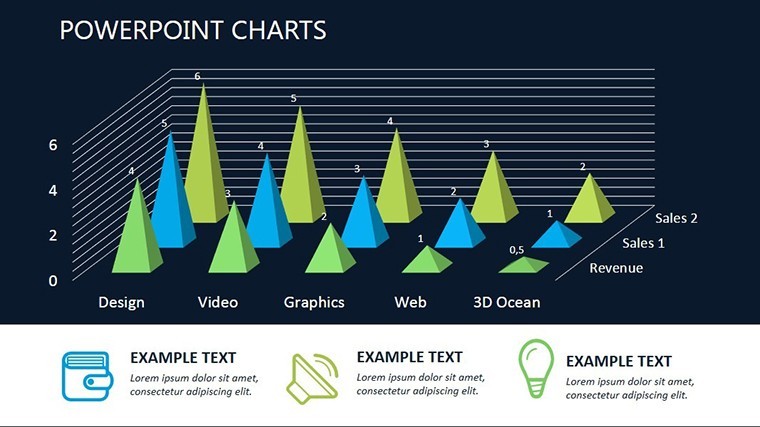
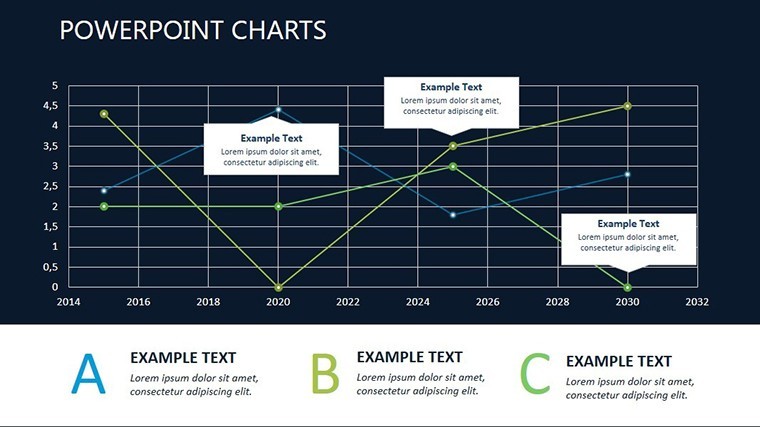
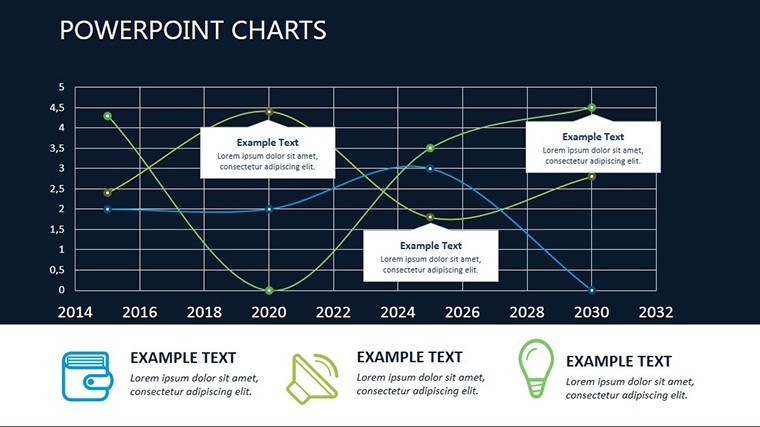
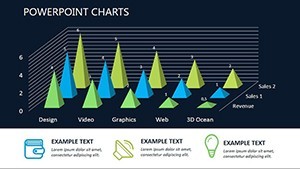
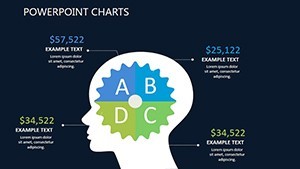
At its core, this template excels in representing relationships and illustrations, with slides that capture the essence of algorithmic processes. Each of the 11 slides features high-fidelity designs, such as node-based relationship charts for showing correlations between variables like stock prices and trading volumes.
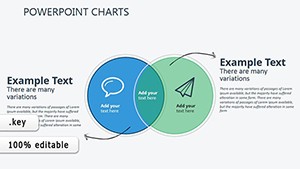
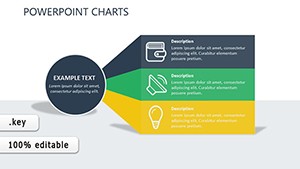
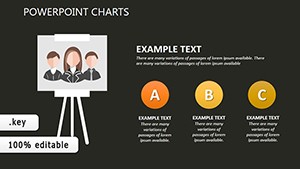
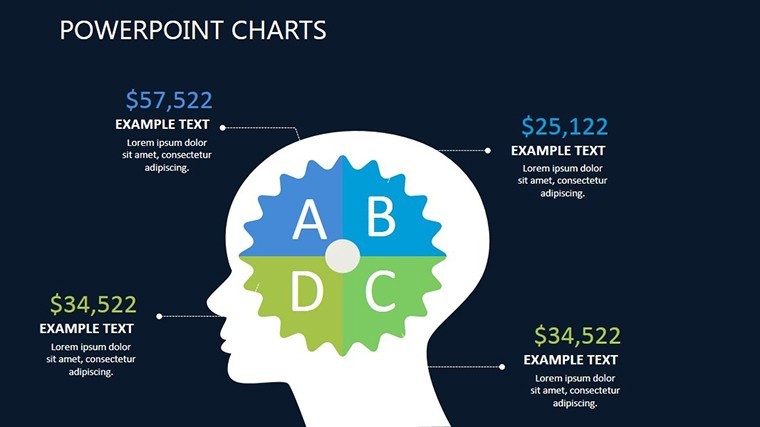
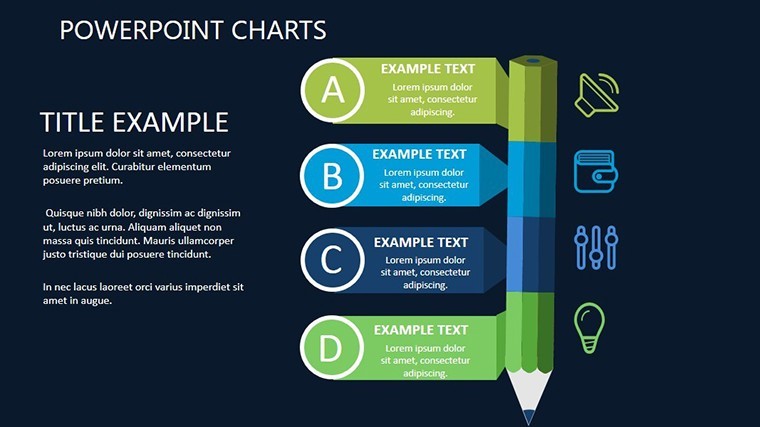
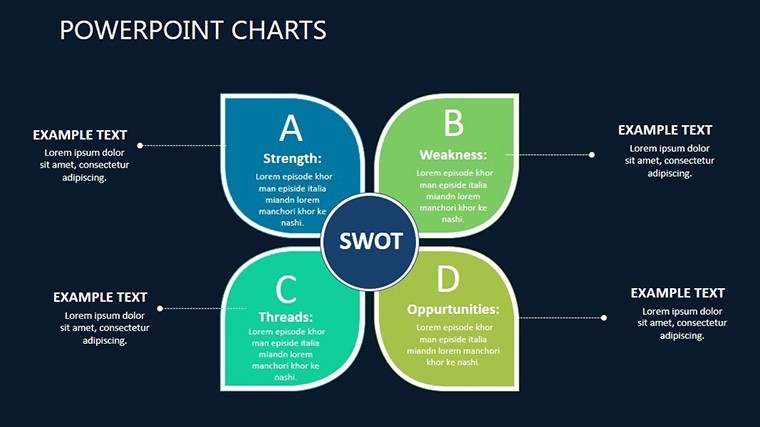
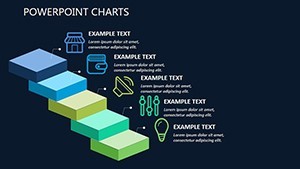
- Relationship Diagrams: Map out connections, ideal for algorithmic pathways or market interdependencies.
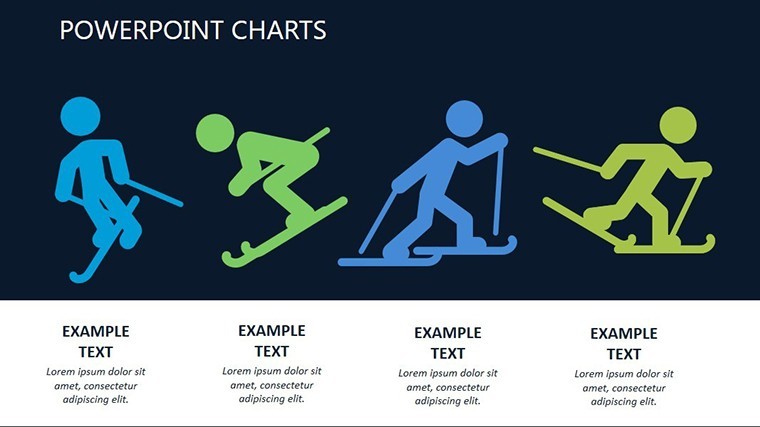
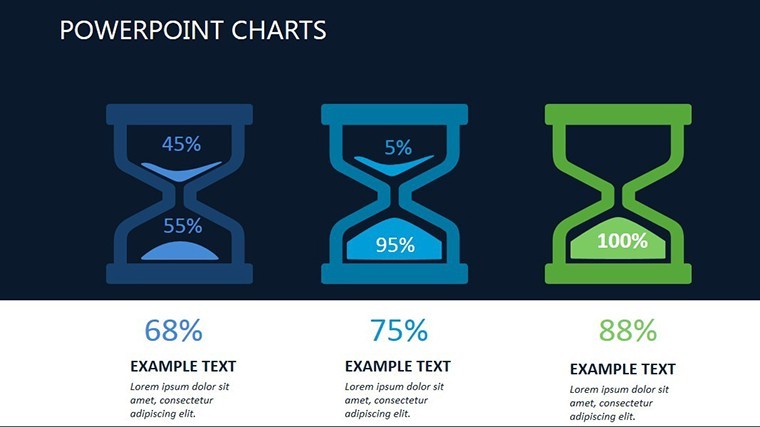
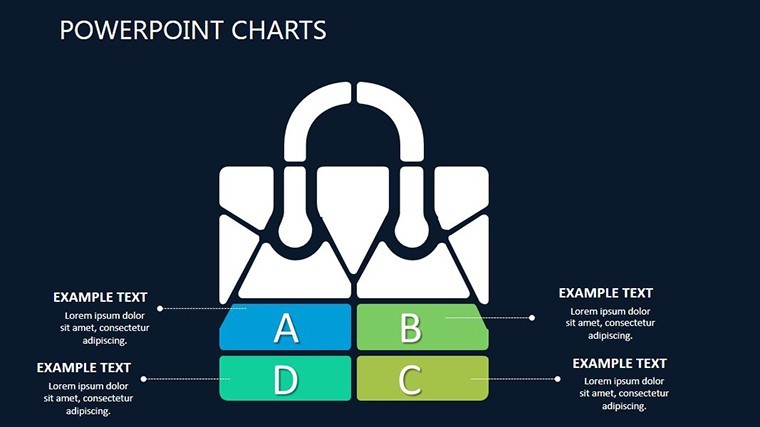
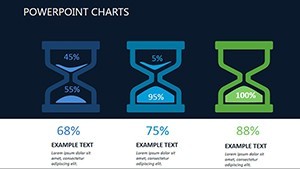
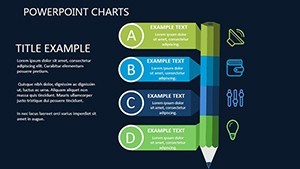
- Illustrative Elements: Includes metaphors like bill stacks for monetary values or train lengths for comparative scales.
- Full Editability: Adjust data, colors, and layouts in Keynote without coding knowledge.
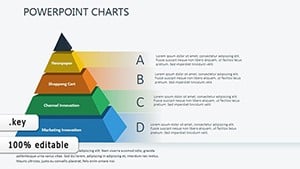
- Statistical Focus: Built for simple yet effective measurement of data points, enhancing advisory presentations.
These features mitigate the complexity of financial data, aligning with standards from bodies like the CFA Institute, where visual clarity is paramount for ethical advising.
Practical Use Cases in Finance and Beyond
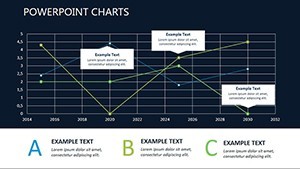
For algorithmic traders, use relationship charts to visualize trading algorithms, showing how inputs lead to outputs in strategies like high-frequency trading. Analysts can illustrate portfolio diversifications, comparing asset classes through illustrative metaphors that make abstract concepts tangible.
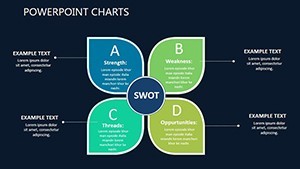
In corporate finance, depict decision impacts on stakeholders with interconnected diagrams, drawing from real scenarios like merger evaluations where relationships between entities dictate outcomes. Businesses outside finance, such as logistics, can adapt illustrations for supply chain comparisons, akin to rolling stock analyses.
Case Study: Improving Trading Pitch Decks
A hedge fund utilizing similar illustrative templates saw a 50% uptick in investor engagement, according to a Financial Times report on visual aids in finance. This template delivers comparable results by simplifying statistical visuals, fostering better decision-making across teams.
For advisory roles, use charts to provide field-specific guidance, ensuring presentations align with regulatory insights from SEC guidelines on transparent data representation.
Customization Strategies for Pro Results
To harness full potential, begin by populating charts with your trading data - Keynote's tools allow for quick scaling. Enhance illustrations with custom colors to denote risk levels, or add labels to relationship nodes for precise annotations.
- Identify key relationships: Focus on core data links, like algorithm triggers and market responses.
- Choose metaphors wisely: Use bill stacks for volume, trains for momentum comparisons.
- Incorporate dynamics: Add subtle animations to reveal data flows.
- Validate with peers: Share drafts for feedback on clarity and impact.
These methods, inspired by data visualization pioneers like Florence Nightingale, ensure your charts are both accurate and persuasive.
Superior to Generic Chart Options
Keynote's standard tools fall short in thematic depth; this template's finance-oriented illustrations provide context-specific value. At $14, backed by 1084 ratings, it's a cost-effective upgrade over free resources that lack sophistication, much like algorithmic edges in trading.
Versus broader templates, its focus on relationships and stats offers targeted benefits for financial pros.
Seamless Workflow Incorporation
Integrate by importing market data directly, then refine in Keynote for export to reports or dashboards. In trading floors, use for real-time strategy sessions; combine with Venn templates for multifaceted analyses.
For remote teams, leverage iCloud for collaborative edits on relationship diagrams.
Unlock Financial Insights with This Template
Step up your game in algorithmic trading presentations. Download the Algorithmic Trading Keynote Charts Template now and turn data into decisive advantages.
Frequently Asked Questions
How do the relationship charts work for trading?
They map connections between data points, like algorithm inputs and outputs, for clear strategy visuals.
Are illustrations customizable for different markets?
Yes, edit metaphors and colors to fit equities, forex, or crypto contexts.
Is this suitable for beginner traders?
Absolutely, with an easy interface that simplifies complex financial data.
What about data security in edits?
Keynote handles local files securely; no cloud required unless you choose.
Can I add animations to illustrations?
Yes, built-in options allow dynamic reveals for engaging presentations.