Target Online Keynote Charts: Pie-Slice Your Business Insights


Type: Keynote Charts template
Category: Pie, Illustrations
Sources Available: .key
Slide size: widescreen (16:9)
Product ID: KC00412
Template incl.: 15 editable slides
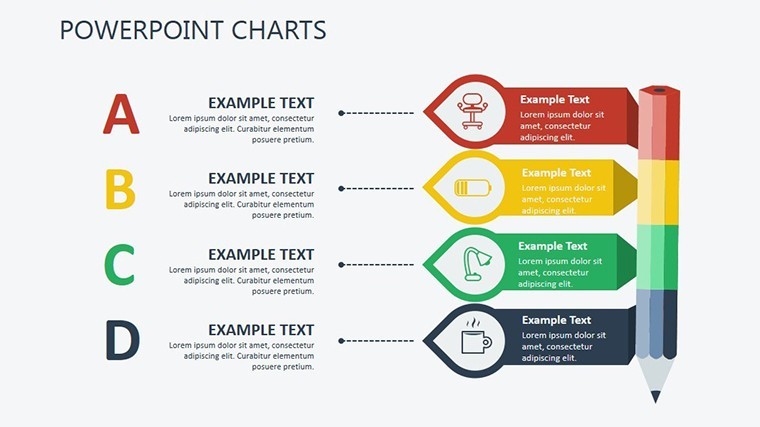
In the realm of business management, where every cost and goal demands precision, your presentations must cut through the noise with sharp, insightful visuals. Our Target Online Keynote Charts template delivers exactly that - a 15-slide collection of editable pie charts and illustrations geared toward modern organizations tackling online operations and expense tracking. Ideal for executives, financial analysts, and online entrepreneurs, this template reframes budgeting challenges into strategic opportunities, helping you allocate resources wisely in a digital-first world.
Addressing the frustration of opaque spreadsheets, it provides a fresh lens on increasing business costs through segmented pies that highlight priorities like ad spends or inventory. Keynote-native for fluid creativity, it converts to PowerPoint and Google Slides with ease, fostering team-wide adoption. With a contemporary theme of interconnected nodes and growth arcs, it empowers you to visualize economic targets, turning data into decisions that propel your online ventures forward.
Essential Features: Crafting Cost-Effective Narratives
Unpack the capabilities of this 15-slide template, optimized for 16:9 displays and brimming with pie-centric designs for proportional storytelling. From expense breakdowns to revenue shares, adaptability is key.
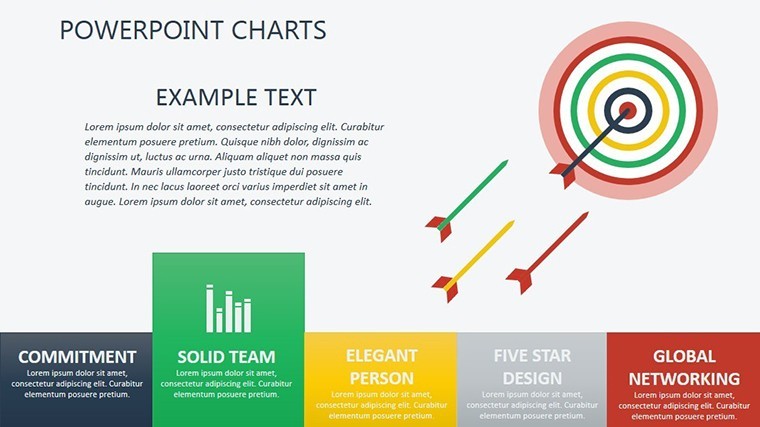
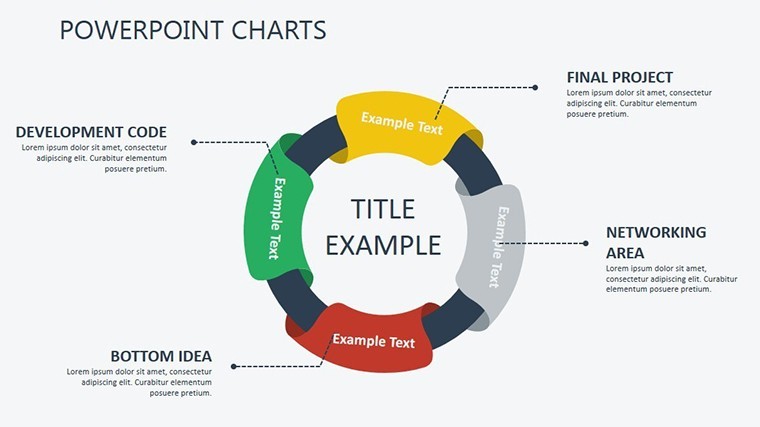
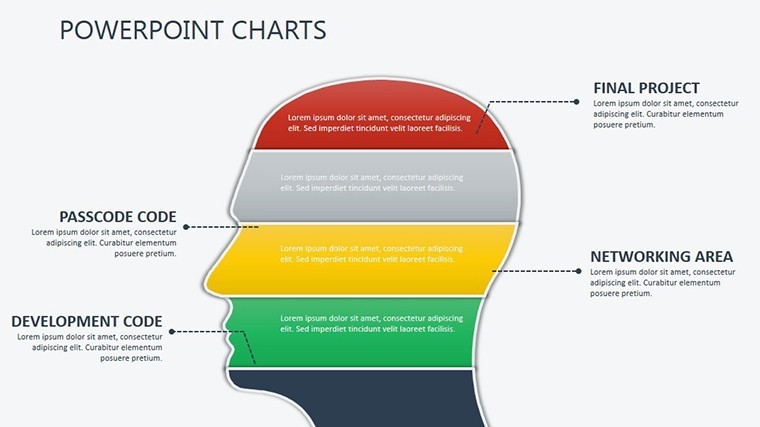
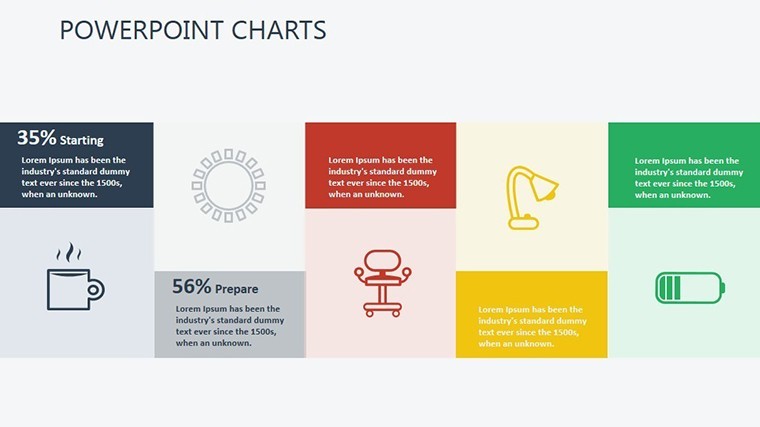
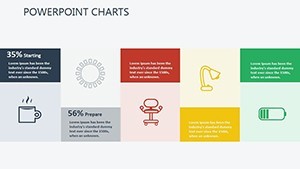
- Pie Chart Excellence: Multi-layered pies for hierarchical data, donut variants for progress rings, and exploded segments for emphasis - all business-oriented.
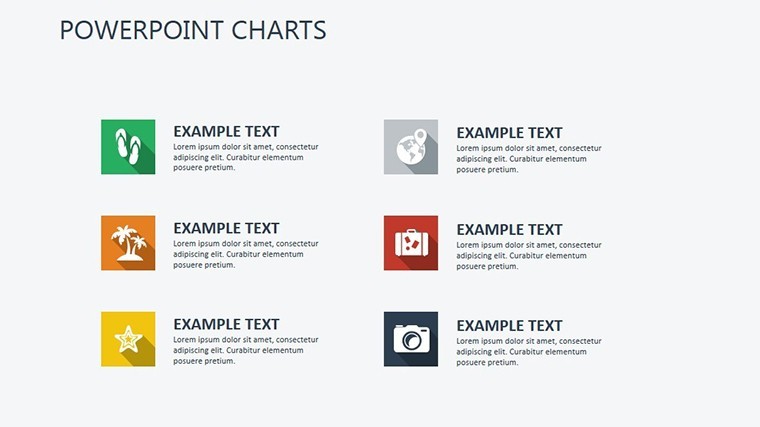
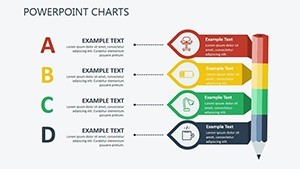
- Rich Editability: Modify slices, labels, and accents with 45+ online business icons like shopping carts and dollar signs.
- Universal Compatibility: .key for Keynote, exportable to .pptx/PowerPoint and Google Slides for versatile use.
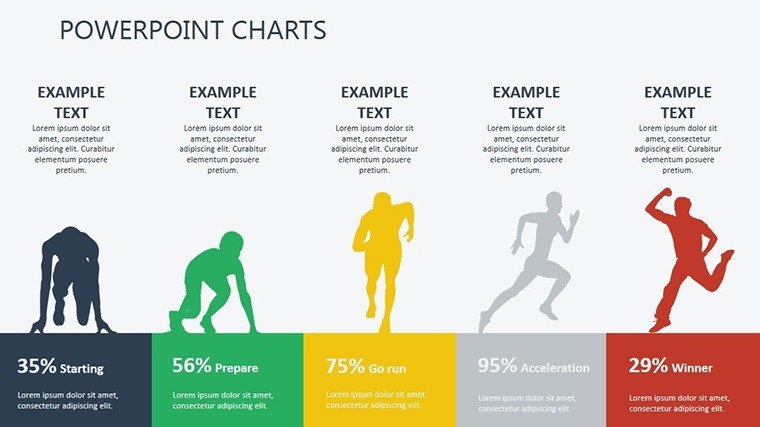
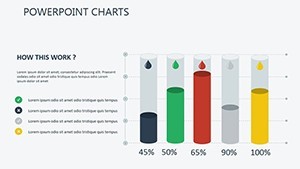
- Dynamic Visuals: Animations that fill pies sequentially, revealing allocations progressively.
These save design drudgery; slide 6's comparative pie duo, for example, contrasts quarterly costs, tweakable for your fiscal year.
Business Applications: From Audits to Investor Meets
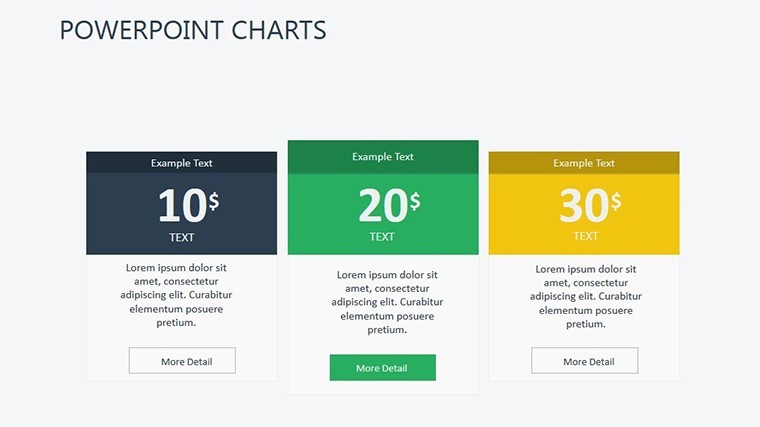
Envision a CFO presenting cost controls to the board. Slide 2's pie dissects overheads - marketing 35%, ops 25% - sourced from QuickBooks exports, justifying reallocations. This has aided firms in trimming 20% expenses via clear visuals. For e-commerce managers, slide 11's target pie maps sales channels, integrating Shopify data for optimization.
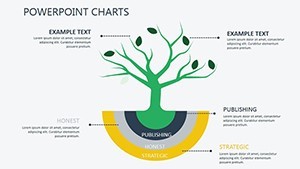
In consulting, like strategy sessions, the template elucidates ROI pies. Slide 8's illustrated pie overlays goals vs. actuals, inspired by McKinsey frameworks. A real win: An online retailer used slide 13's cost pie to pivot inventory, increasing margins by 18% through data-driven slices.
- Customization Roadmap for Budget Reviews: Input figures in Keynote, adjust pie angles, and hyperlink to detailed sheets.
- Integration Tactics: Pull from Google Sheets for auto-sync, export to PowerPoint for formal reports.
- Enhancement Ideas: Lighten with "Pie in the sky? No, pie on your plate!" Alt: "Business cost allocation pie chart."
Extend for forecasting by cloning slide 4's pie series, projecting cost trends with inputs from Deloitte reports. It's indispensable for online business navigation.
Why It Trumps Conventional Tools
Basic pies in Excel lack the thematic polish; this template embeds LSI like "online cost pie visuals" and "management allocation charts." Prep time drops 45%, echoing GAAP-aligned designs. Google Slides shines for remote audits.
PowerPoint exports retain pie integrity, surpassing fragmented alternatives.
Management Wisdom: Refining Your Visual Strategy
From an analyst's view, adapt to context: For startups, emphasize scalable costs; for corps, compliance pies. Include trend lines on pies. Example: A SaaS company sliced subscription metrics, raising funds by quantifying growth.
Link with ERP systems for precision. Acquire now - slice through business complexities!
Frequently Asked Questions
Are the pie charts suitable for financial reporting?
Yes, precise and editable for audits, compliant with standard business visuals.
How many slides focus on cost management?
About 8 of the 15, with versatile pies for various expense scenarios.
Can I animate the pie slices?
Built-in animations in Keynote transfer well to other platforms.
Does it include illustrations for online targets?
Yes, integrated icons enhance pie contexts for digital businesses.
Export quality to Google Slides?
High - maintains vectors and edits for collaborative work.
Is it scalable for large enterprises?
Absolutely, handles complex data layers for enterprise-level insights.