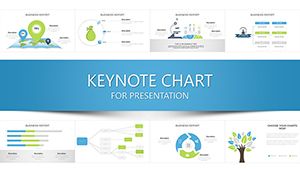
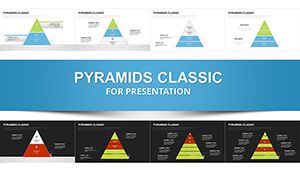
Human Factors Psychology Keynote Charts Template


The intricate field of human factors psychology, where human behavior intersects with system design, demands visuals that clarify without oversimplifying. Our Human Factors Psychology Keynote Charts Template is engineered for researchers, educators, and consultants who tackle ergonomics, usability, and cognitive loads. Boasting 13 editable slides in matrix and puzzle formats, it enables you to map out user interactions or error analyses with finesse. Inspired by standards from the International Ergonomics Association (IEA), this template turns theoretical models into practical demonstrations. Picture captivating a classroom with a puzzle slide dissecting attention divides in multitasking, or impressing clients with matrix charts evaluating interface designs. It's more than slides - it's a bridge to better understanding, helping mitigate real-world issues like aviation errors or workplace fatigue, as highlighted in NASA human factors studies.
Features Tailored for Psychological Insights
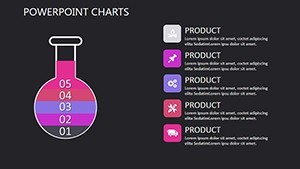
Central to its appeal are adaptable features. The slides, in .key format, allow full edits - from reshaping matrices for variable comparisons to recoloring puzzles for thematic emphasis. Slide 1 might host a matrix for workload assessments, editable to include NASA-TLX scales.
Advantages include fostering deeper comprehension; surpassing basic tools, it integrates psychological frameworks like Fitts' Law for movement predictions. This has aided in usability testing, per UX case studies from Nielsen Norman Group.
Highlighting Key Design Aspects
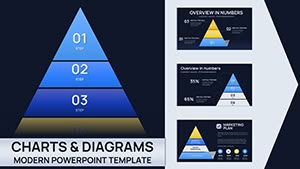
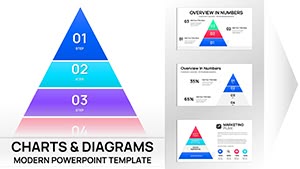
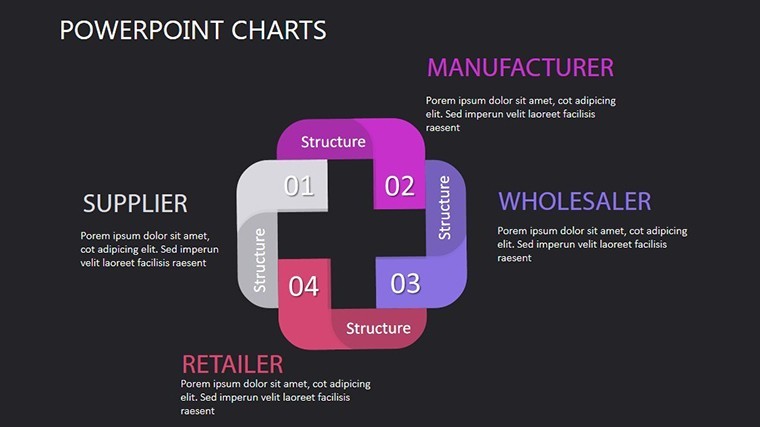
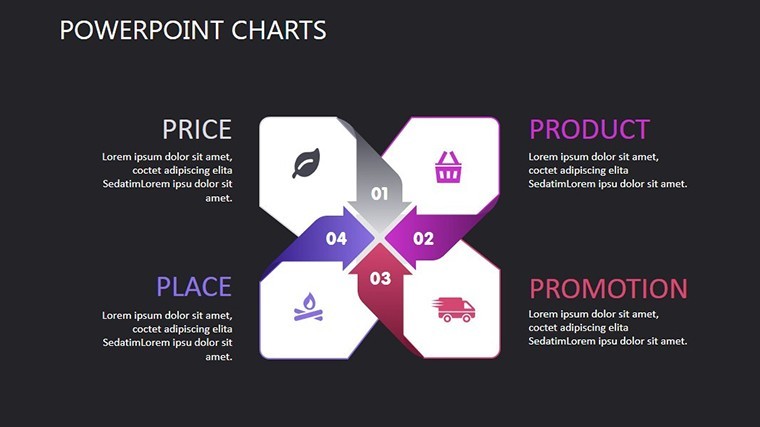
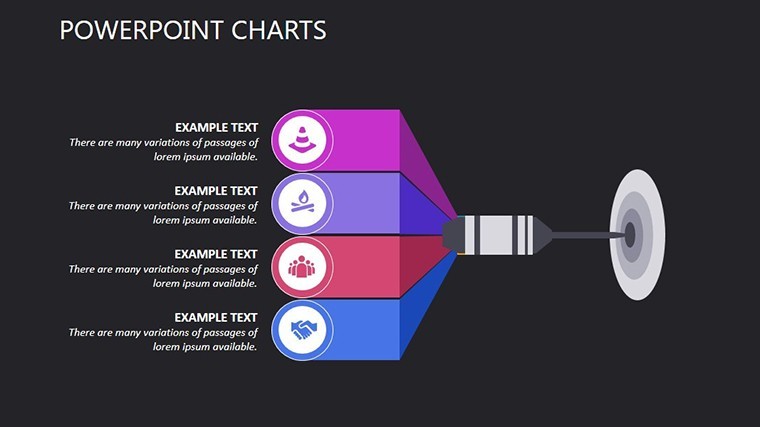
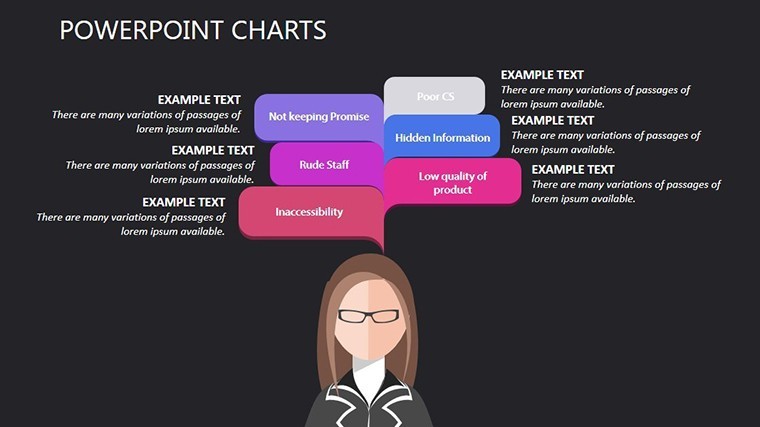
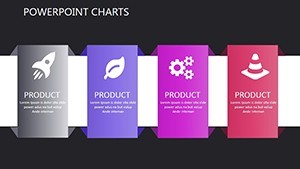
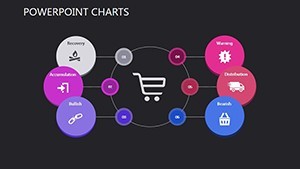
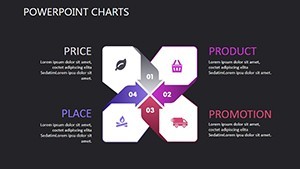
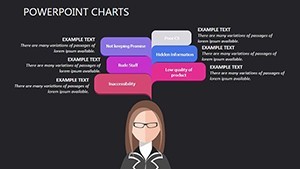
- Matrix Layouts: For cross-comparing factors like stress and performance.
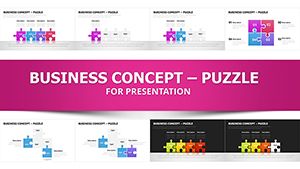
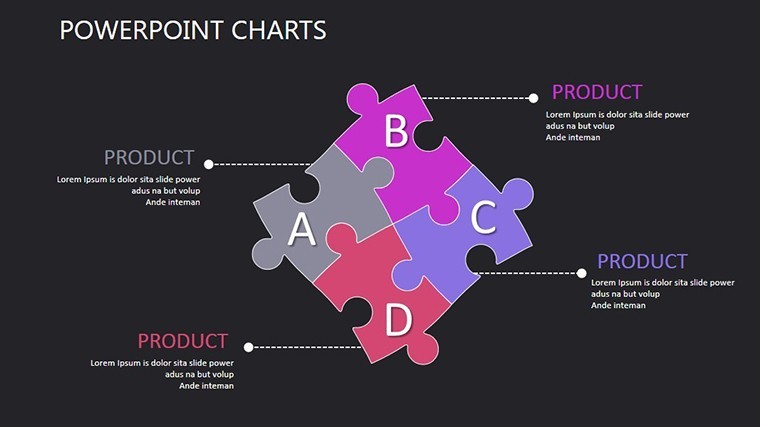
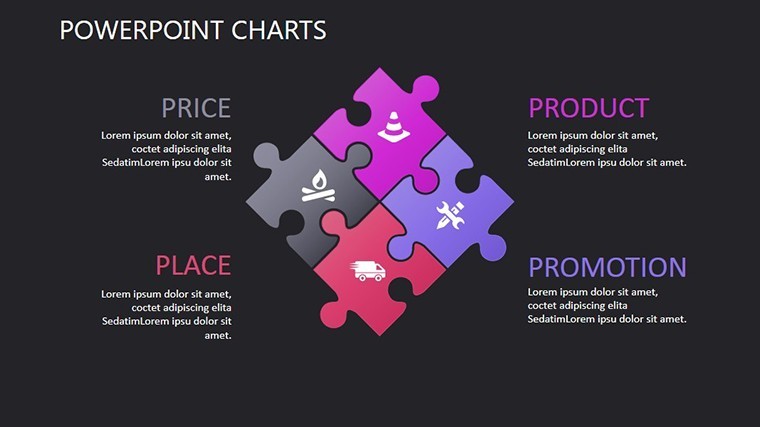
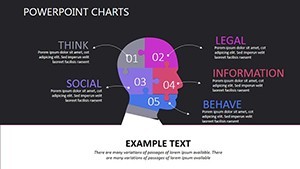
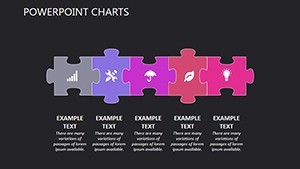
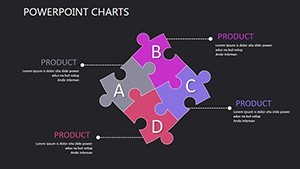
- Puzzle Configurations: Representing cognitive processes, with pieces for modular builds.
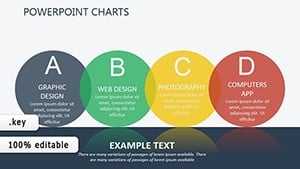
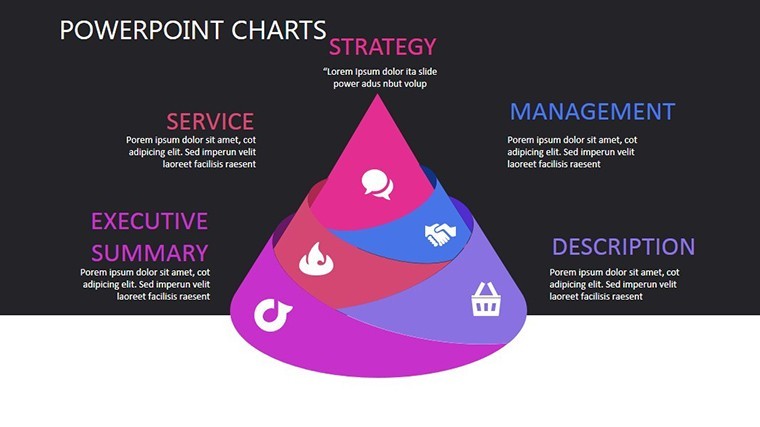
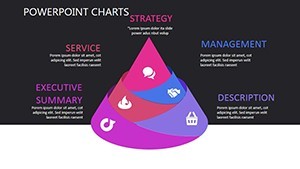
- Specialized Graphics: Icons for senses, memory, and decision-making.
- High-Resolution Quality: Ensures clarity in detailed psychological models.
- User-Friendly Edits: Drag-and-drop for rapid prototyping.
It resolves dense content issues with structured visuals, echoing Don Norman's user-centered design ethos.
Use Cases: Applying Psychology in Practice
In education, use Slide 4 for puzzles on perceptual illusions, engaging students interactively. For researchers, matrices in Slides 7-9 analyze experiment data, supporting publications.
Consultants benefit in product design reviews, visualizing user journeys to recommend improvements, as in automotive ergonomics from Ford studies.
Tip: Animate matrix fills to simulate cognitive buildup. Workflow: Load template, input variables, customize.
Steps for Optimal Utilization
- Define your psychological construct.
- Choose slide type, e.g., puzzle for integrations.
- Edit with data from tools like SPSS.
- Add explanatory text.
- Present with audience Q&A prompts.
Outperforms generics with psychology-specific focus.
Advancing Your Expertise Through Visuals
This template advances discourse, backed by IEA principles. It's revolutionized lectures and consultations alike.
Elevate your insights - acquire this template and decode human factors with precision.
Frequently Asked Questions
What psychological models do these charts support?
From cognitive load to error taxonomies, all editable for custom fits.
Suitable for virtual conferences?
Yes, optimized for screen sharing with clear visuals.
Can I export to other formats?
Easily convert to PDF or PowerPoint via Keynote.
How to incorporate research data?
Embed tables or graphs directly into matrices.
Support for non-psychologists?
Intuitive for related fields like UX design.
Differences from standard templates?
Tailored for human factors, with specialized structures.