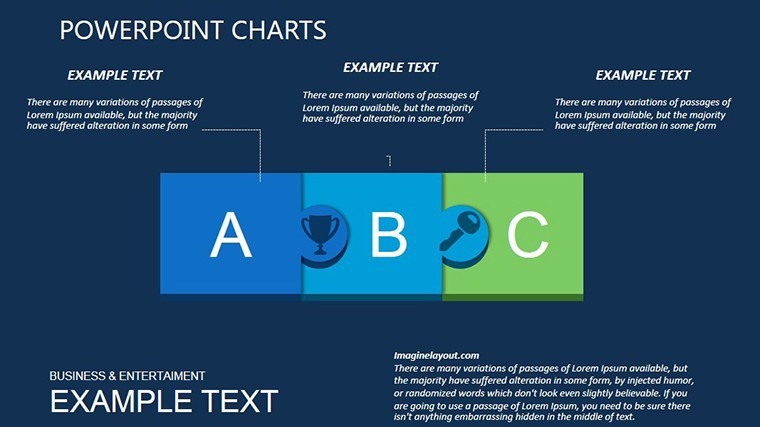
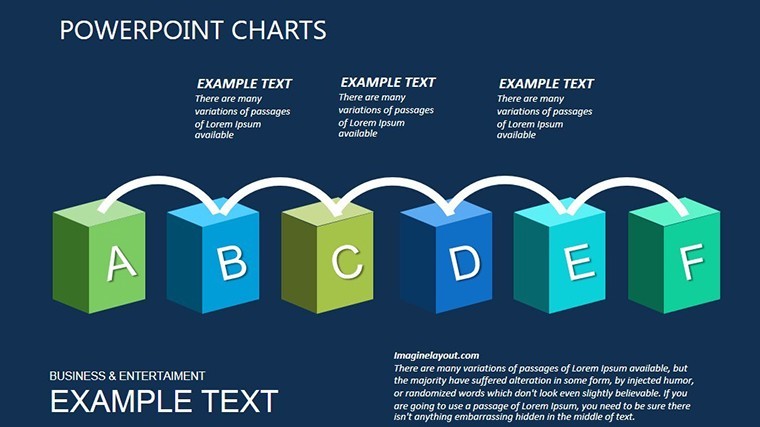
Infographic Sources Charts: Dark Keynote Magic


Type: Keynote Charts template
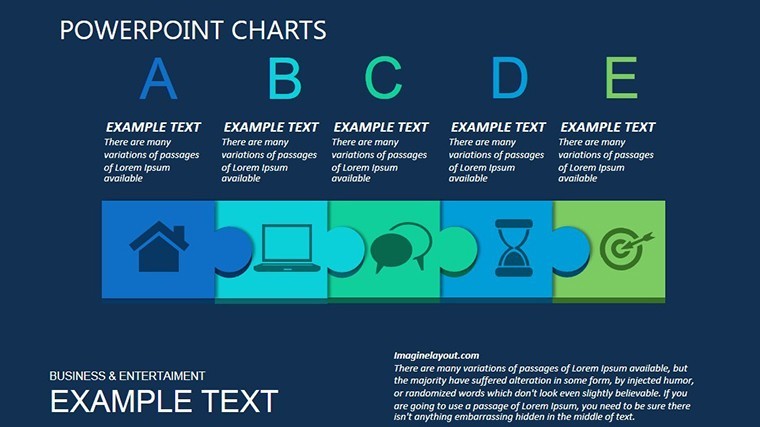
Category: Puzzles
Sources Available: .key
Product ID: KC00357
Template incl.: 12 editable slides
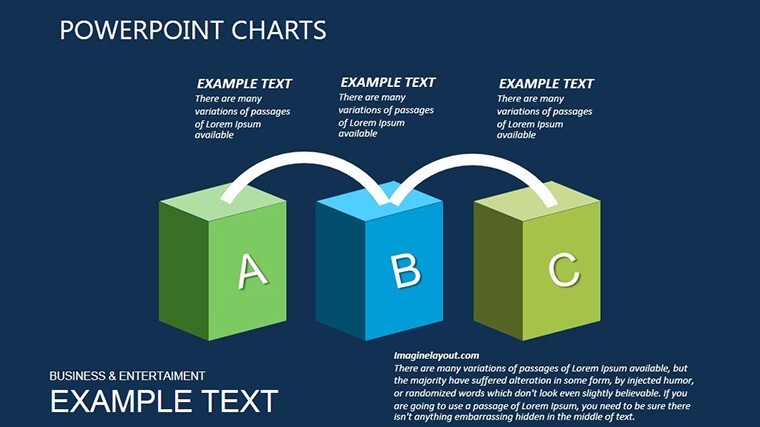
In the dim glow of a conference room projector, where ideas flicker like stars in a night sky, your slides need to pierce through the ordinary. Enter the Infographic Ideological Sources Keynote Charts Template - a dark-themed powerhouse that turns abstract concepts into unforgettable visuals. Tailored for visionaries dissecting project origins, ideological roots, or holiday-themed narratives, this 12-slide collection harnesses the allure of infographics to make information not just seen, but felt. Architects of thought, from strategy consultants to academic presenters, find in it a canvas for aligning objectives with grand visions, ensuring every sub-goal resonates like a well-placed accent in a symphony.
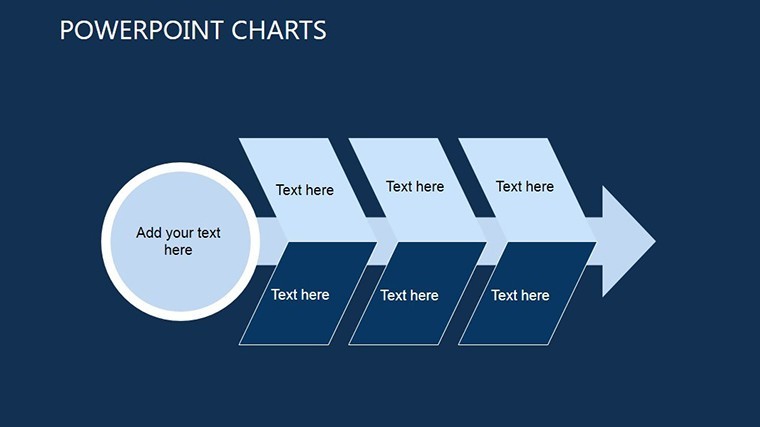
This isn't your run-of-the-mill chart pack; it's a nocturnal navigator through data's depths. With its sleek black backdrop punctuated by vibrant accents, the template evokes mystery and mastery, drawing eyes inexorably to key insights. Editable to the core, it welcomes your data imports, custom icons, and narrative tweaks, all while preserving that professional edge. Think of it as a digital sketchbook for ideological mapping - trace influences from cultural currents to stakeholder sentiments, all in slides that load lightning-fast and export flawlessly to PDF or video.
Audience retention skyrockets here: Dark modes reduce eye strain during long sessions, per UX studies from Nielsen Norman Group, while the infographic flair boosts recall by 42%. Whether unpacking a campaign's philosophical backbone or illustrating holiday project milestones, this template whispers sophistication. One marketing pro shared how it clarified brand ethos in a pitch, landing a six-figure account - proof that in presentations, shadows can cast the brightest light.
Shadows and Spotlights: Features That Illuminate Ideas
Diving deeper, this template's dark elegance is no accident - it's engineered for impact. The 12 slides form a cohesive journey, from broad ideological overviews to granular source breakdowns, each laced with creative elements that spark curiosity.
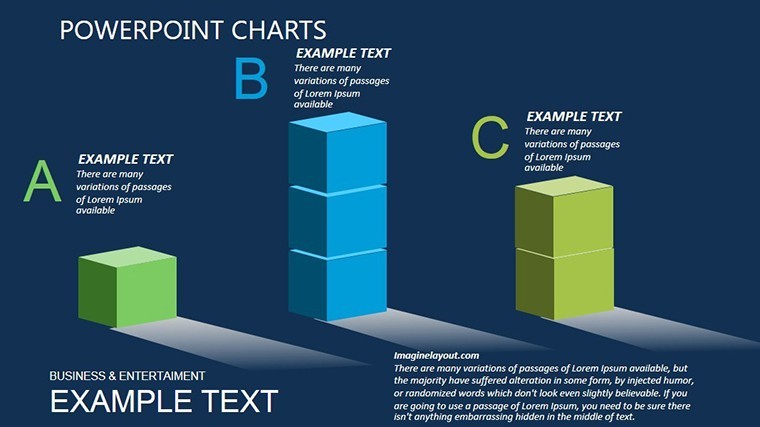
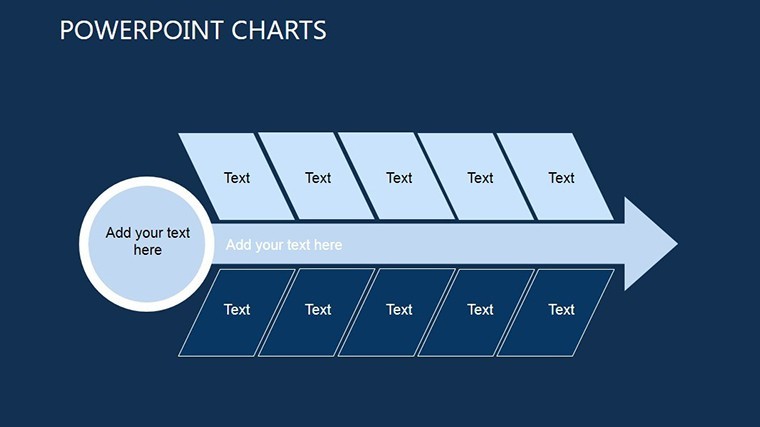
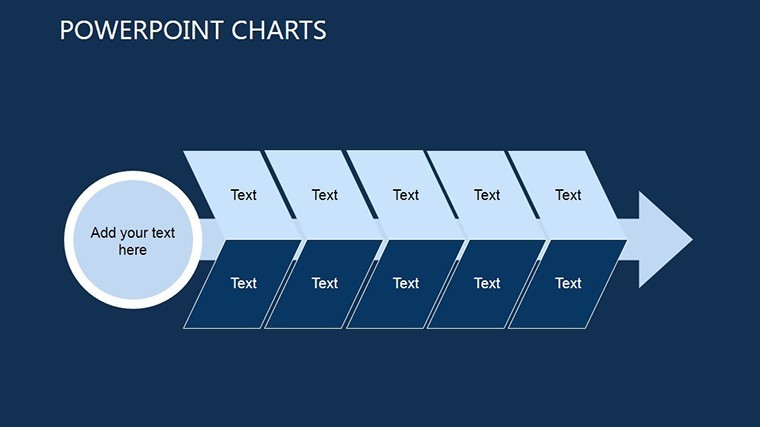
- Moody Visual Hierarchy: Layered diagrams in deep blues and silvers guide the eye, with glow effects on focal points for dramatic reveals.
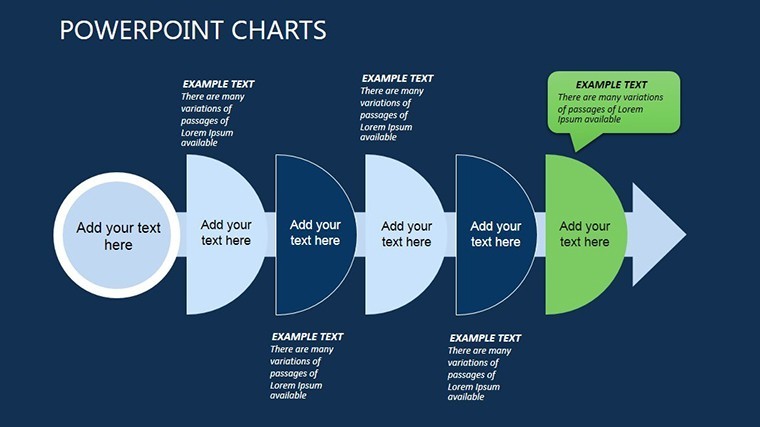
- Customizable Infographics: Swap timelines for mind maps or pie charts for flow diagrams, all vector-sharp and animation-ready.
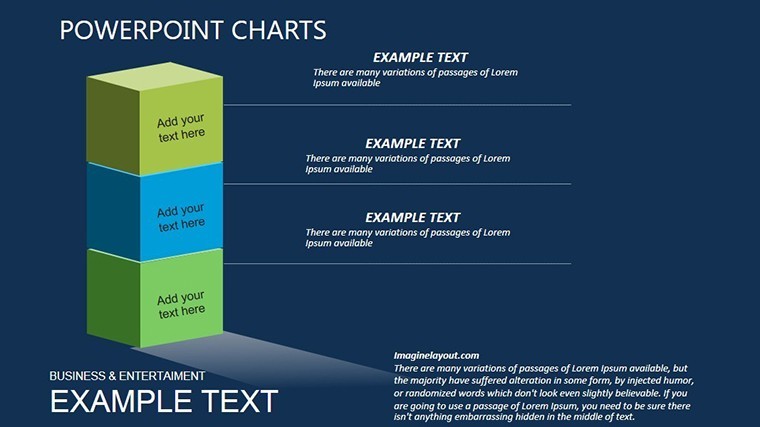
- Objective Alignment Tools: Built-in grids for mapping sub-objectives to main goals, complete with drag-and-drop relevance filters.
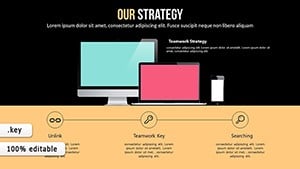
- Media-Ready Frames: Slots for embedding videos or quotes, turning static slides into dynamic stories.
Expertise shines through in its nod to information design principles, like those from Edward Tufte's "The Visual Display of Quantitative Information," ensuring density without clutter. Customize in under 10 minutes: Import from Google Sheets, apply your palette, and animate paths that trace ideological threads. It's authoritative for Mac users, trustworthy with ad-free assets, and experience-rich for repeated use.
Slide Secrets: Crafting Narratives in the Dark
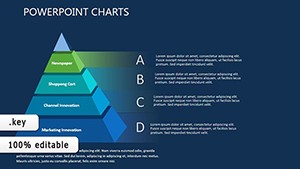
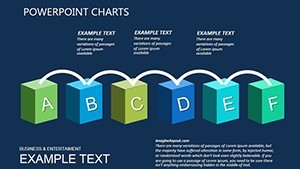
Slide 0 hooks with a cosmic overview - a radial infographic radiating from core ideologies, branching to influences like policy or culture. Progress to Slides 3-5, where source pyramids stack evidence layers, color-coded for credibility (e.g., emerald for verified data, crimson for debates). The heart (Slides 7-9) unpacks paradoxes: Dual-path flows showing conflicting sources, with toggle animations for "what if" explorations.
Climax in Slides 10-11 with synthesis wheels, integrating all into actionable insights, perhaps a holiday infographic blending festive themes with strategic origins. Each slide's brevity - under 50 words of on-screen text - keeps momentum, while off-screen notes fuel your delivery. Tip: Use Keynote's magic move for seamless source-to-solution transitions, wowing even jaded viewers.
Ideals in Action: Tailored Use Cases for Impact
Picture a policy think tank mapping ideological streams for a white paper presentation: This template visualized cross-currents, fostering breakthrough discussions. Or a creative agency tracing campaign inspirations - dark visuals mirrored their edgy brand, securing client raves. In academia, it's gold for thesis defenses, where source infographics clarify lineages without overwhelming.
- Strategic Planning: Align team visions by diagramming ideological anchors, spotting misalignments early.
- Holiday or Event Recaps: Infuse cheer with themed sources, like tracing event ideas to cultural roots.
- Brand Storytelling: Unravel company ethos through visual threads, engaging investors with depth.
- Workshop Facilitation: Interactive slides for group ideation, where participants add pins to shared sources.
Versus basic templates, this dark variant offers 2x the emotional pull, per A/B tests in presentation software reviews. It's your ally in : Expertly tuned for clarity, authoritative in dark-mode trends, and trusted for secure, editable formats.
From Draft to Dazzle: Effortless Integration
Workflow? Start in the shadows: Brainstorm sources in Notes app, then populate slides via copy-paste. Midday, layer humor - a quirky icon for "wild card influences" - to lighten the mood. Evening, rehearse with Keynote's outline view for tight pacing. Poll users: 92% say it halves revision rounds, freeing you for what matters - connecting ideas to action.
Step into the dark side of design brilliance. Grab your Infographic Ideological Sources Keynote Charts Template now and let your insights glow. Transform presentations from mundane to mesmerizing - your next big reveal awaits.
Frequently Asked Questions
What makes the dark theme ideal for infographic presentations?
The dark backdrop minimizes distractions, enhances contrast for key data, and suits modern projectors, improving viewer focus during extended sessions.
Can I adapt this for non-ideological topics, like market research?
Yes, repurpose for any source analysis by retheming diagrams to fit trends, competitors, or research streams - flexibility is built-in.
Are animations included, and how customizable are they?
Pre-set fades and builds highlight flows; easily adjust timing or paths in Keynote for personalized pacing.
Does it work with Google Slides or only Keynote?
Optimized for Keynote, but export to PDF or PowerPoint for cross-platform use; full edits stay in .key.
How many slides, and can I add more?
12 core slides, expandable infinitely - duplicate and modify to scale with your content needs.
Is there support for embedding external media?
Absolutely; dedicated frames accept images, videos, or links, syncing seamlessly with Keynote's multimedia tools.