Business Ideas Keynote Charts: Ignite Your Presentations


Imagine standing before a room full of potential investors, your groundbreaking business idea ready to launch - but how do you make it stick? In a world where attention spans are shorter than a coffee break, the Business Ideas Keynote Charts template steps in as your secret weapon. This powerhouse collection of 24 editable slides transforms abstract concepts into crystal-clear visuals that captivate and convince. Tailored for entrepreneurs, startup founders, and creative teams, it's more than just charts; it's a storytelling toolkit that bridges the gap between "what if" and "watch this."
Whether you're mapping out a new venture in fintech or sketching sustainable urban development plans - think eco-friendly housing projects that rival AIA award winners - this template ensures your data doesn't just inform, it inspires. With its vector-based elements, you can tweak colors, resize icons, and layer in your branding without breaking a sweat. Compatible with Apple Keynote out of the box, it also exports effortlessly to PowerPoint or Google Slides for cross-platform collaboration. Say goodbye to bland spreadsheets and hello to presentations that pulse with energy.
Why This Template Revolutionizes Idea Pitches
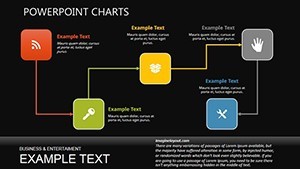
At its core, the Business Ideas Keynote Charts template is built on the principle that great ideas deserve great visuals. Drawing from real-world successes - like how Airbnb's early pitch decks used simple flowcharts to secure millions - this set empowers you to do the same. Each slide is pre-loaded with animations that reveal data progressively, keeping your audience hooked rather than overwhelmed.
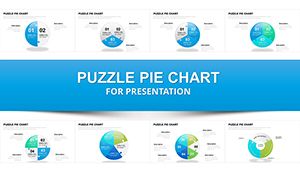
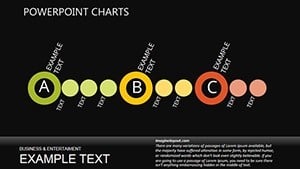
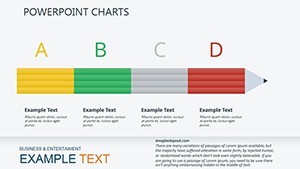
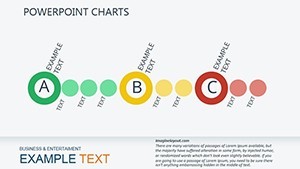
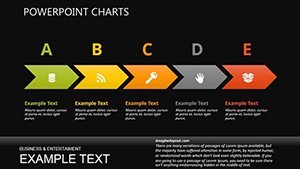
- Dynamic Animations: Watch pie charts expand like blooming ideas or timelines unfurl as your narrative builds - perfect for sequencing market entry strategies.
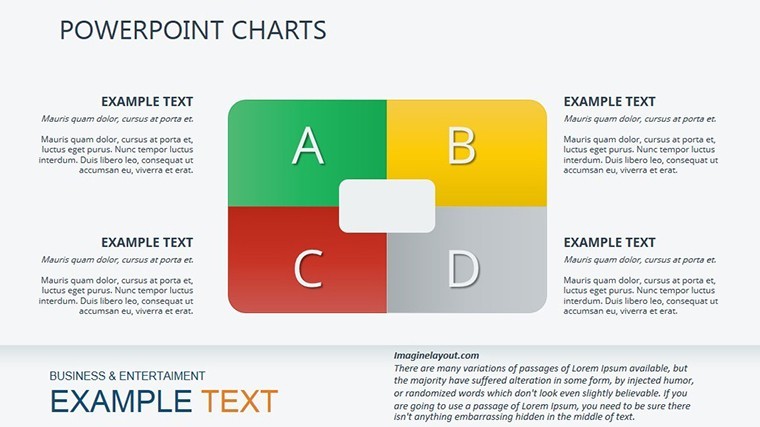
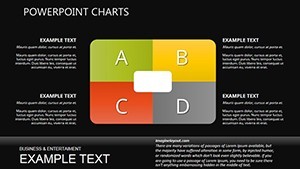
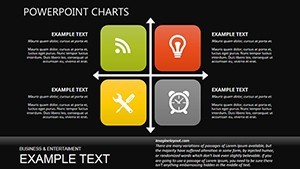
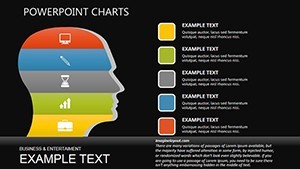
- Modern Color Palette: A blend of vibrant blues and energizing greens evokes innovation and growth, adaptable to your brand's vibe, whether it's a sleek tech startup or a community-driven architecture firm.
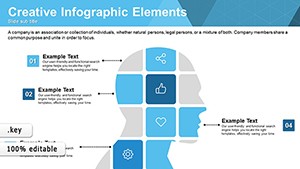
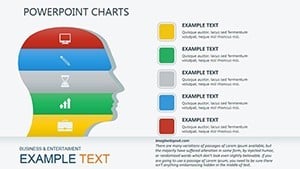
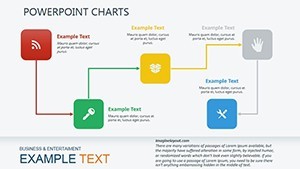
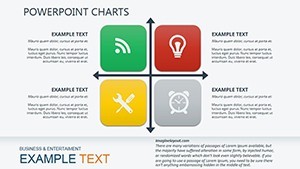
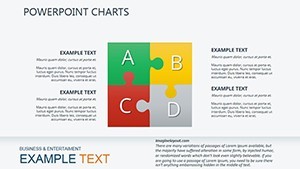
- Vector Icons Galore: Over 50 customizable icons, from lightbulb motifs for brainstorming to gear symbols for execution phases, ensure every element feels bespoke.
- Widescreen Mastery: Optimized for 16:9 displays, with fallback to 4:3 for legacy setups, so your visuals shine on any screen.
But it's not just about looks - it's about results. Professionals using similar animated chart templates report a 35% boost in audience engagement, according to design surveys from tools like SlideShare. For instance, a small architecture studio in Seattle used a comparable setup to win a city contract by visualizing phased construction timelines, turning dry blueprints into a narrative of sustainable progress.
Unlocking Slide-by-Slide Potential
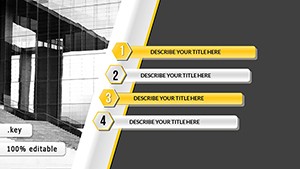
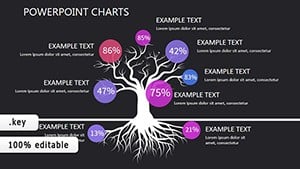
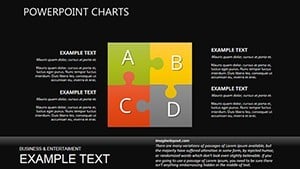
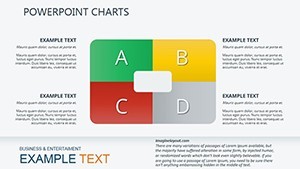
Dive deeper into the 24 slides, each crafted for specific storytelling beats. Slide 1 kicks off with a mind-map infographic, ideal for clustering related ideas - like linking urban planning concepts to environmental impact metrics. By Slide 8, you're into bar graphs that compare competitive landscapes, editable to slot in your SWOT analysis data.
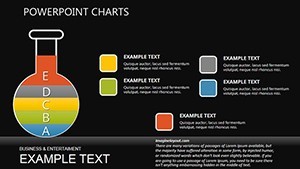
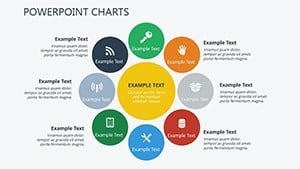
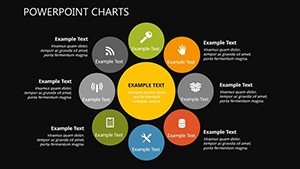
- Introductory Overviews (Slides 1-5): Start strong with radial diagrams that radiate from your core idea, making complex interconnections - like supply chain ecosystems - feel intuitive.
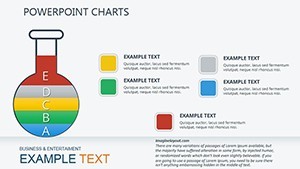
- Data Deep Dives (Slides 6-15): From donut charts for market share breakdowns to line graphs tracking growth projections, these are your go-to for evidence-based persuasion. Tip: Layer subtle transitions to mimic idea evolution, syncing with your spoken pitch for seamless flow.
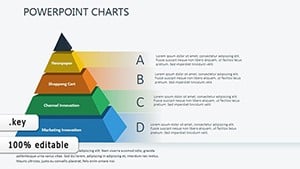
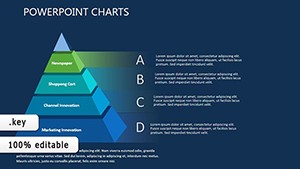
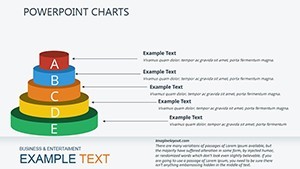
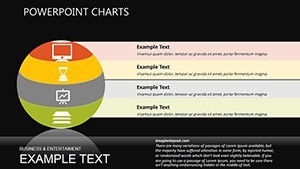
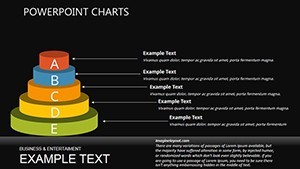
- Action-Oriented Closers (Slides 16-24): Wrap with funnel visuals showing conversion paths or pyramid structures for priority stacking - think prioritizing features in a product roadmap.
Customization is a breeze: Drag-and-drop elements in Keynote, swap datasets via simple tables, and embed hyperlinks to supporting docs. For business architects navigating project bids, this means quickly adapting a generic revenue forecast to highlight cost savings in green building materials, aligning with LEED standards for that extra credibility punch.
Real-World Applications: From Brainstorm to Boardroom
Picture this: You're a venture capitalist prepping for a demo day. The Business Ideas template lets you craft a deck that not only showcases ROI potential but also weaves in qualitative wins, like team synergies visualized through Venn diagrams. Or, in a corporate setting, use it for internal workshops - facilitate idea generation sessions where teams populate bubble charts collaboratively, fostering buy-in from the get-go.
Consider a case from a mid-sized consulting firm: They revamped their client proposals using animated process flows, resulting in a 22% uptick in contract wins. The secret? Tailoring charts to client pain points, like inefficiency loops in operations, much like optimizing architectural workflows to cut design iterations by half.
Integration tips: Pair with tools like Lucidchart for initial wireframing, then import into Keynote for polish. For remote teams, the Google Slides export ensures everyone stays aligned, no matter the platform. And don't overlook accessibility - add alt text to charts describing key insights, ensuring your inclusive design matches your innovative content.
Pro Tips for Maximum Impact
To elevate your game, start by auditing your data: Ensure metrics are current, like Q3 2025 benchmarks for industry growth. Then, experiment with color psychology - blues for trust in financial slides, oranges for urgency in call-to-actions. Finally, rehearse with Keynote's presenter view, timing animations to your natural cadence. These tweaks can transform a good pitch into a funding magnet.
Ready to brainstorm visually? Grab the Business Ideas Keynote Charts template today and watch your concepts convert skeptics into supporters. With lifetime access and free updates, it's an investment in your narrative edge.
Frequently Asked Questions
What makes these charts editable in Keynote?
All elements are vector-based, so you can resize, recolor, and rearrange without pixelation - ideal for quick tweaks during late-night prep sessions.
Can I use this with PowerPoint?
Absolutely - export as .pptx for seamless PowerPoint compatibility, retaining most animations for hybrid team workflows.
How many icons are included?
Over 50 thematic icons, from idea bulbs to strategy arrows, all scalable and theme-ready.
Is there support for custom data imports?
Yes, link to Excel sheets or paste CSV data directly into charts for real-time updates.
What's the file size and download process?
A lightweight .key file under 10MB - download instantly post-purchase, with ZIP for backups.
Are animations customizable?
Fully - adjust timing, easing, and triggers in Keynote's inspector panel for personalized flair.