Learning Process Keynote Charts: Unlock Analytical Clarity


Type: Keynote Charts template
Category: Relationship, Illustrations
Sources Available: .key
Product ID: KC00313
Template incl.: 28 editable slides
In the realm of knowledge dissemination, understanding processes through methods like exclusive, inclusive, and eventual analysis is key to insightful outcomes. Our Learning Process Keynote Charts Template, with 28 editable slides, is your gateway to visualizing these concepts effortlessly in Keynote. Tailored for educators, researchers, and business strategists, it turns abstract methodologies into tangible diagrams, fostering deeper comprehension. Envision a workshop where you dissect reaction products with complete data using exclusive methods - this template makes it vivid, saving time and enhancing retention. From classroom lectures to corporate training, it addresses the need for structured, engaging content that resonates with diverse learners.
Essential Features for Effective Visualization
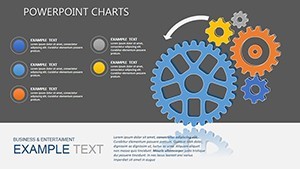
This template shines with its adaptable design, featuring clean layouts optimized for Keynote's ecosystem. Slides include dynamic diagrams for process flows, with animations that reveal steps sequentially, ideal for building suspense in explanations. Vector graphics ensure crisp visuals at any scale, and you can infuse your brand's palette - perhaps earthy tones for educational themes or bold contrasts for analytical depth. Compatibility extends to adding multimedia, like embedding tutorial videos or audio narrations, turning static charts into interactive experiences. The 28 slides cover a spectrum, from basic overviews to intricate breakdowns, all editable with intuitive tools.
In-Depth Exploration of Slide Components
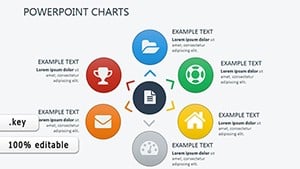
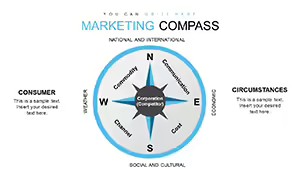
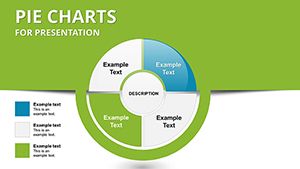
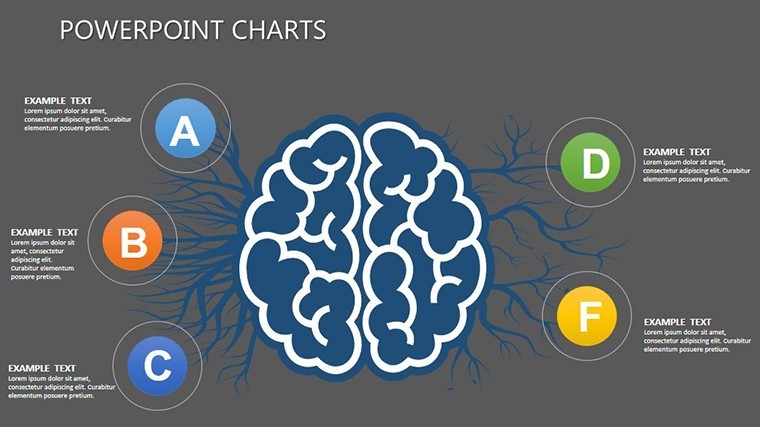
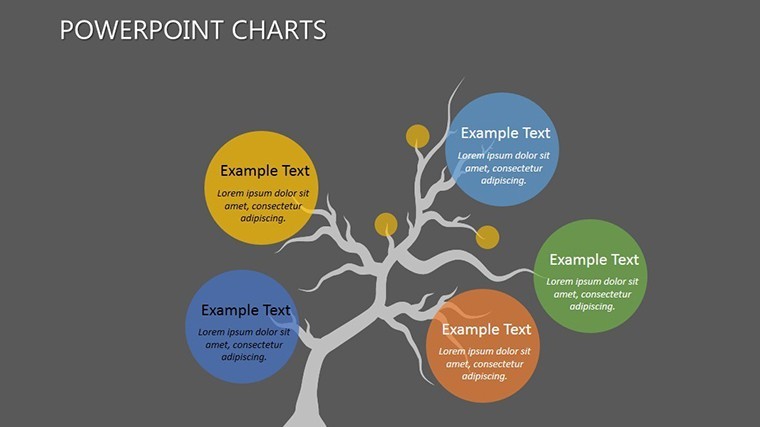
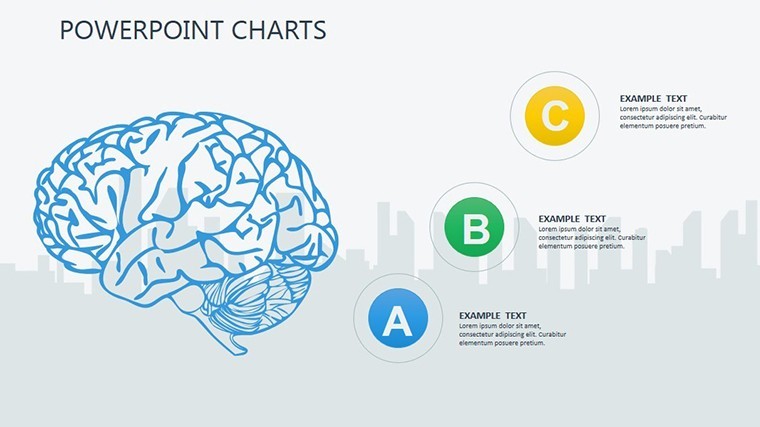
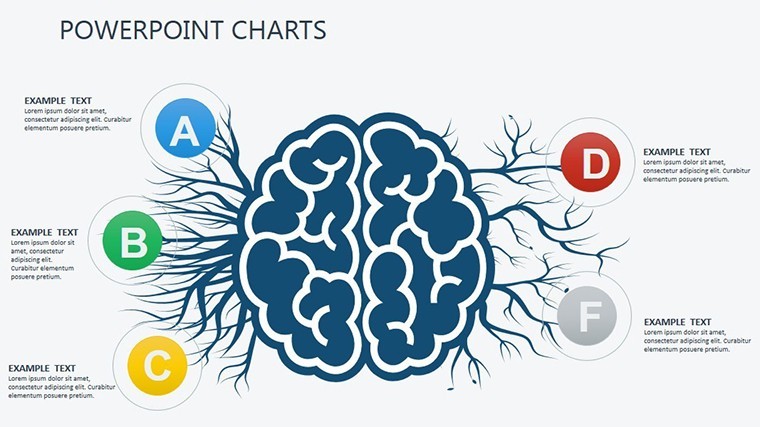
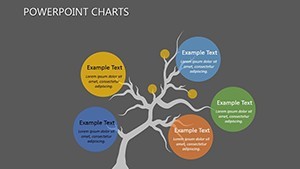
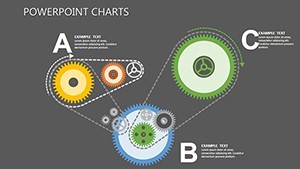
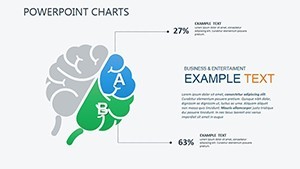
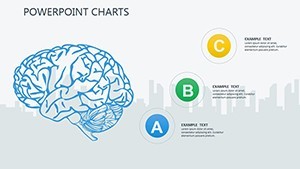
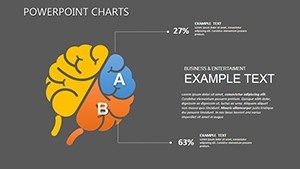
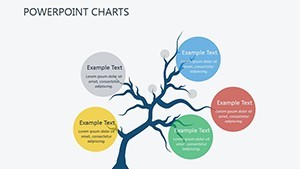
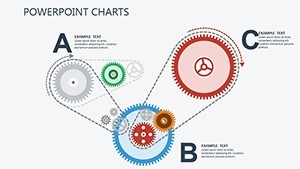
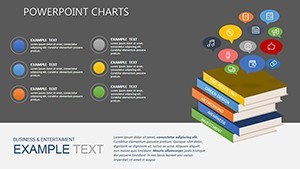
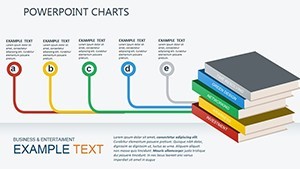
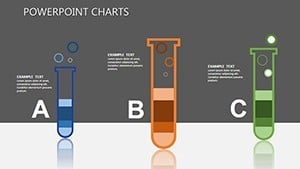
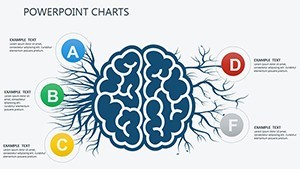
Break it down: Introductory slides present overarching frameworks, such as Venn diagrams for inclusive vs. exclusive methods, animating overlaps for emphasis. Core slides delve into eventual analysis with flowcharts that branch based on data completeness, customizable with your datasets. You'll encounter matrix charts for comparing process impacts, Gantt-style timelines for sequential learning stages, and radar plots for multifaceted evaluations. For example, in a chemistry context, map reaction pathways; in business, analyze decision trees. Each slide supports data import from spreadsheets, ensuring accuracy.
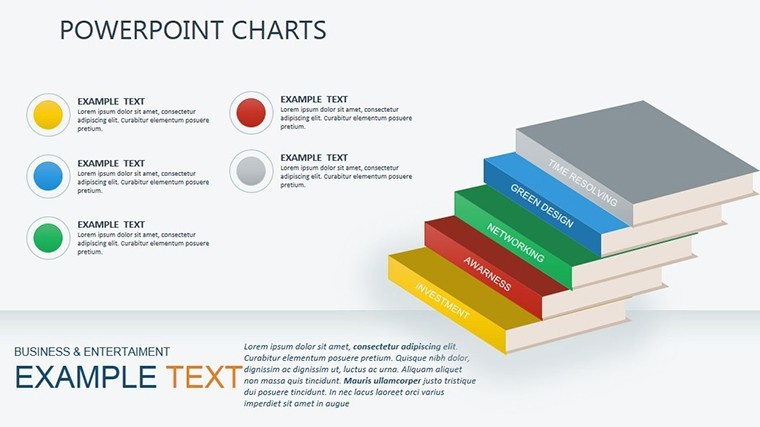
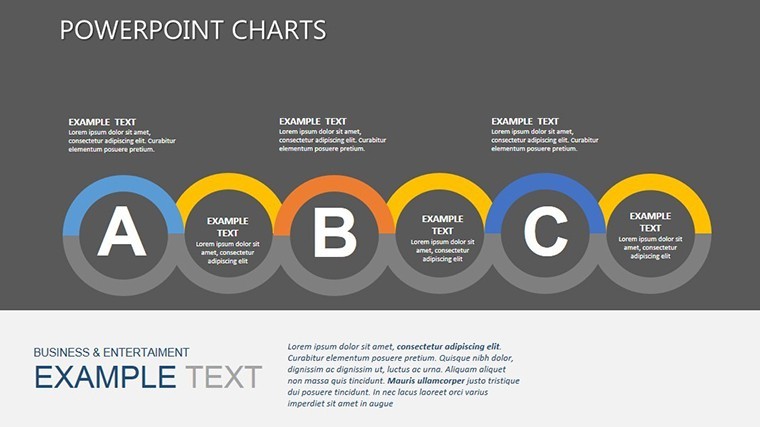
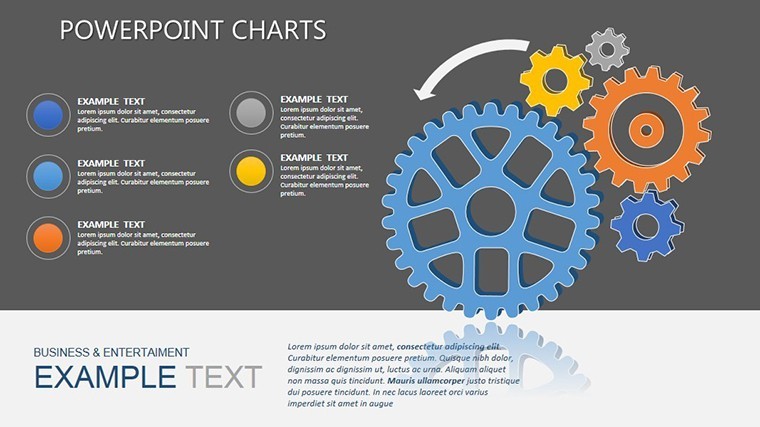
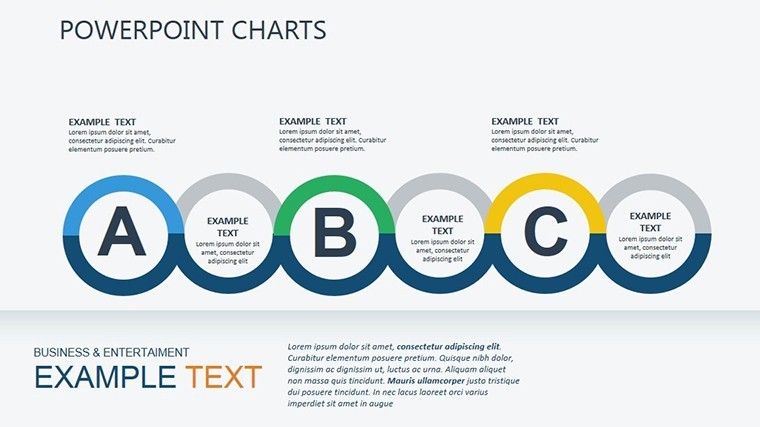
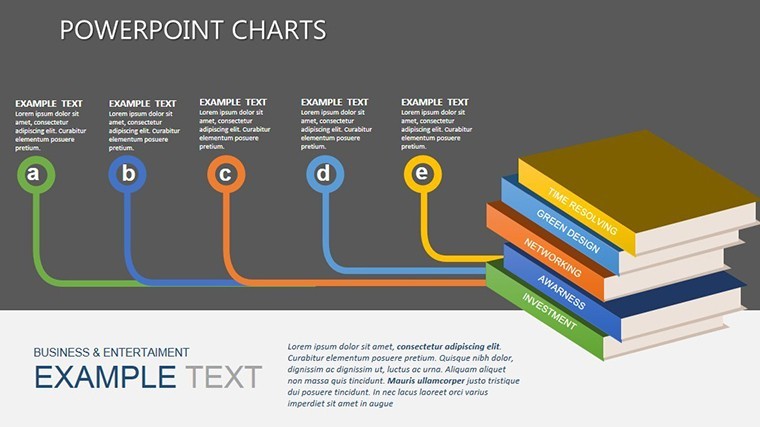
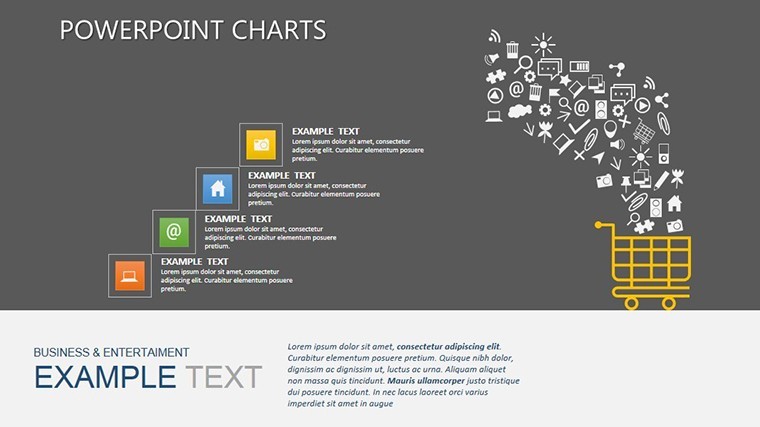
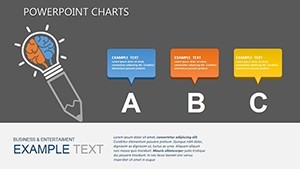
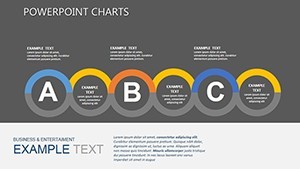
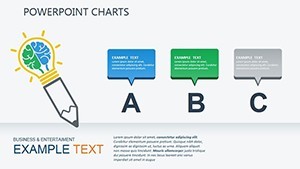
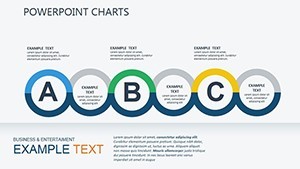
- Process Mapping Slides: Flowcharts for step-by-step analyses, perfect for exclusive method breakdowns.
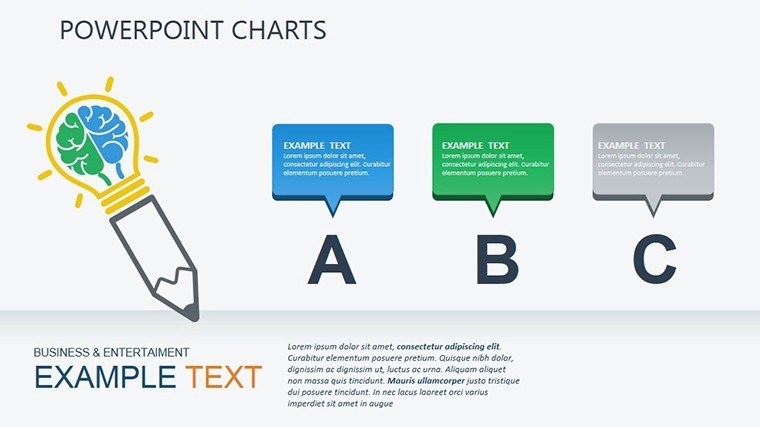
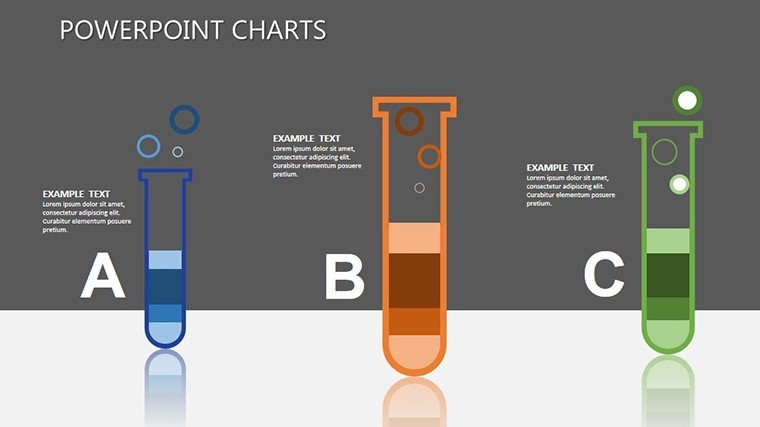
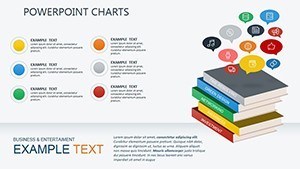
- Comparative Tools: Side-by-side matrices highlighting inclusive integrations.
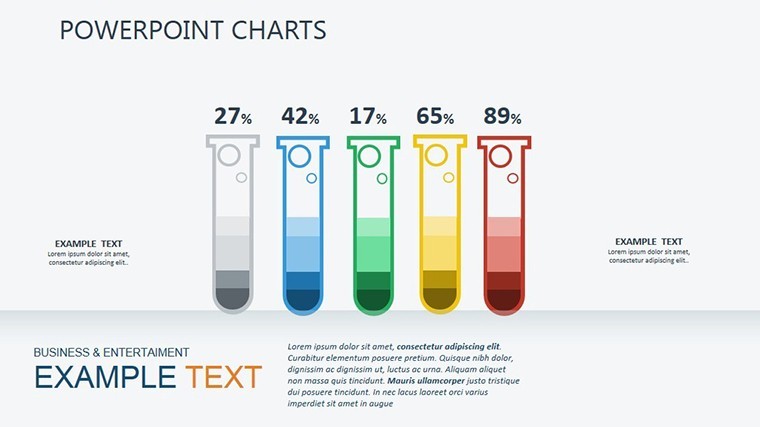
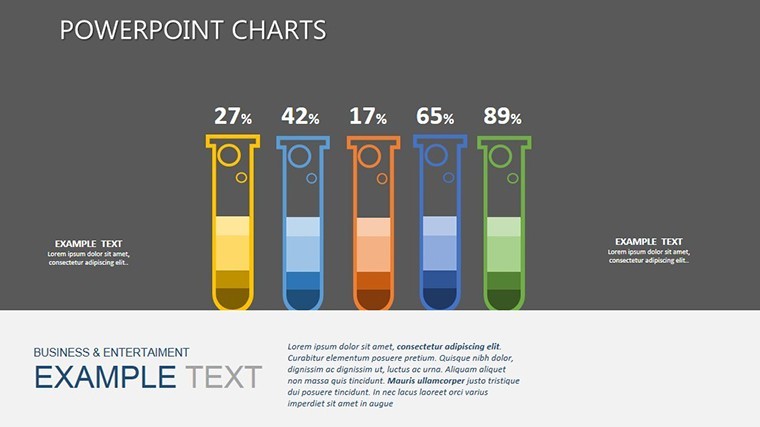
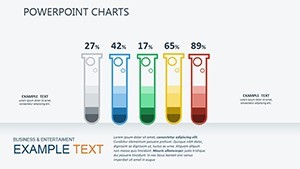
- Outcome Visuals: Bar and line graphs for eventual results, with trend lines for predictions.
- Interactive Elements: Hyperlinked diagrams for non-linear navigation in presentations.
Drawing from pedagogical principles like Bloom's Taxonomy, these charts promote higher-order thinking, aligning with educational standards from bodies like the American Educational Research Association.
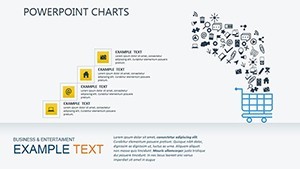
Practical Use Cases Across Fields
Apply it in real scenarios: An educator uses the template to teach scientific methods, customizing flowcharts to illustrate hypothesis testing, engaging students visually. In corporate settings, a consultant employs matrix slides to evaluate business processes, leading to optimized strategies and cost savings. Researchers can adapt for paper presentations, using radar charts to display multivariate data on learning outcomes. Non-profits might visualize program impacts, like skill acquisition in training workshops, to secure funding. The template's versatility supports hybrid formats, with slides optimized for virtual platforms like Zoom integration in Keynote.
Customizing for Your Audience: A Guided Approach
- Open in Keynote and choose a foundational slide.
- Enter your process data, such as variables in inclusive analyses.
- Modify aesthetics: Adjust line weights or add shadows for depth.
- Animate elements: Set fades for method reveals to maintain attention.
- Enhance with extras: Insert images of real-world applications, like lab setups.
- Rehearse and share: Export to PDF or video for broader reach.
This methodical customization mirrors the template's theme, empowering you to create polished outputs efficiently.
Advantages Over Standard Charting
Unlike Keynote's default options, this template offers pre-themed elements for learning processes, reducing design fatigue. Animations are more nuanced, with path-based motions for process flows, enhancing narrative flow. Users appreciate the scalability for complex datasets, avoiding the limitations of basic tools. Studies from learning science, like those in the Journal of Educational Psychology, show visual aids like these improve comprehension by 40%. Our design team, with backgrounds in instructional design, ensures alignment with best practices.
Complement with related templates for comprehensive kits, and tap into our expert support for tailored advice.
Expert Tips for Process Visualization
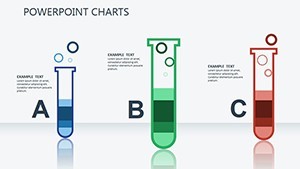
Maximize impact: Simplify complex methods with color coding - greens for positives, reds for exclusions. Use legends consistently for clarity. Test accessibility with screen readers, adding descriptive texts. Weave in stories: Frame charts as journeys, e.g., "From Input to Insight." Gather feedback post-presentation to refine future uses.
Empower your analyses - start customizing this template now.
Frequently Asked Questions
What analysis methods does this template support?
It covers exclusive, inclusive, and eventual methods with dedicated diagrams for each.
Can I add my own data easily?
Yes, editable tables allow seamless data import from Excel or CSV.
Is it suitable for beginners?
Absolutely, with intuitive interfaces and included guides for quick starts.
How do animations enhance presentations?
They reveal information progressively, aiding audience understanding without overload.
Are updates available?
Yes, purchasers get notifications for free updates to slides.