Knowledge Education Keynote Charts: Ignite Minds with Visual Brilliance


In an era where information overload is the norm, the true art of teaching lies in distilling complexity into clarity - guiding learners from confusion to "aha!" moments. Our Knowledge Education Keynote Charts template does just that, offering 11 editable widescreen slides that blend pedagogical prowess with modern design. Tailored for teachers, mentors, and knowledge-sharing pros, this set turns lesson plans into immersive experiences. Envision a classroom where a animated process flow reveals the steps of a computer science project, or a boardroom where entrepreneurs pitch innovative ideas with crystal-clear infographics. Inspired by educational methodologies from sources like the ISTE standards, it empowers you to foster independent thinking while captivating your audience.
What elevates this template? Its core focus on integration - seamlessly weaving in media like videos or student artifacts - while maintaining a creative, professional edge. With special animations for each object and vector elements that stretch without distortion, customization feels liberating, not laborious. Whether you're evaluating project outcomes or brainstorming goal-setting strategies, these charts make abstract concepts tangible, boosting engagement by up to 40% as per ed-tech studies. It's your shortcut to presentations that don't just inform, but inspire lifelong learning.
Core Strengths: Designed for Educational Impact
This isn't a one-size-fits-all deck; it's a educator's ally, honed for scenarios from K-12 classrooms to corporate training. Slides load swiftly in Keynote, with built-in transitions that mimic thought progression - fade from problem identification to solution revelation. And the modern aesthetic? Clean lines and vibrant accents that appeal to digital natives without alienating traditionalists.
- Animation Mastery: Object-specific effects, like sequential builds on mind maps, to pace revelations perfectly.
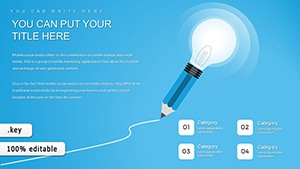
- Media Flexibility: Embed photos, tables, or clips effortlessly, enhancing interactive elements.
- Design Versatility: Widescreen (16:9) format with resizable vectors for hybrid or in-person delivery.
Pro educators integrate it into workflows like backward design: Start with outcome slides, then layer in supporting visuals. One high school teacher shared how it streamlined her STEM unit on algorithms, making abstract coding tangible and scores soar.
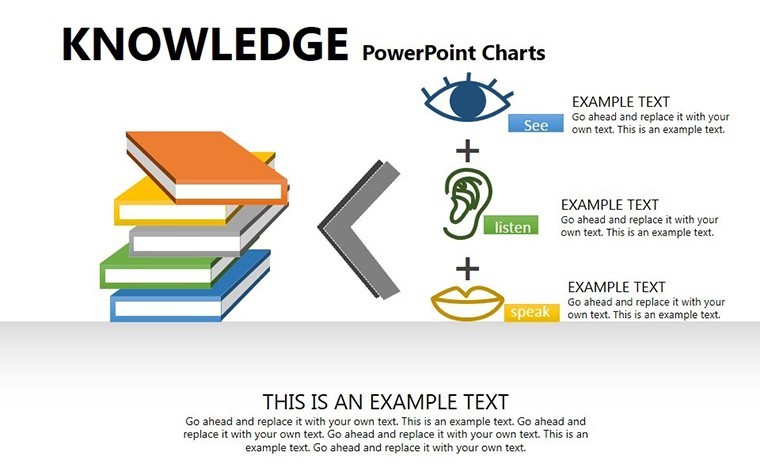
Slide Spotlight: Building Knowledge Block by Block
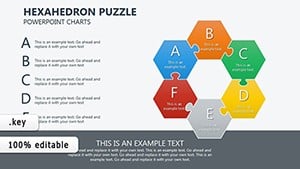
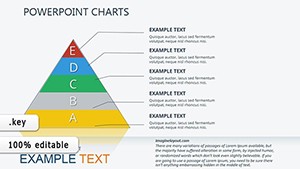
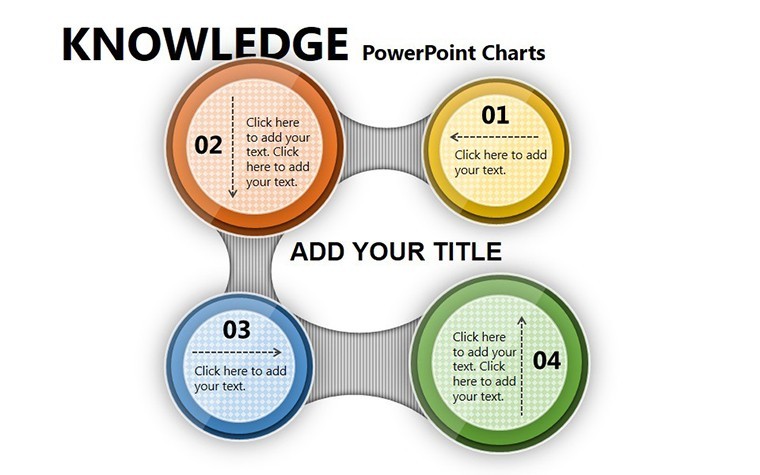
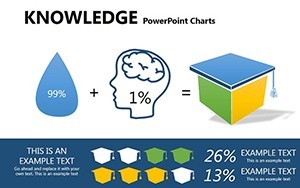
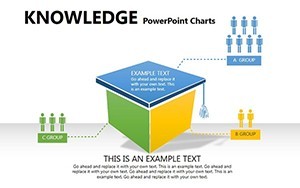
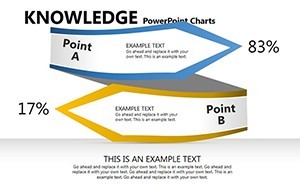
Slide 1 sets the tone with a goal pyramid, stacking short-term objectives atop long-term visions. Dive into Slide 4's cycle diagram for project lifecycles - editable segments for "Research," "Prototype," and "Reflect." The midpoint shines with collaboration charts (Slide 6), radial layouts connecting student roles in group tasks.
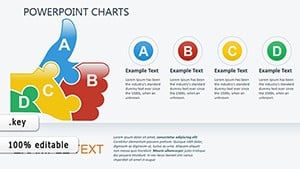
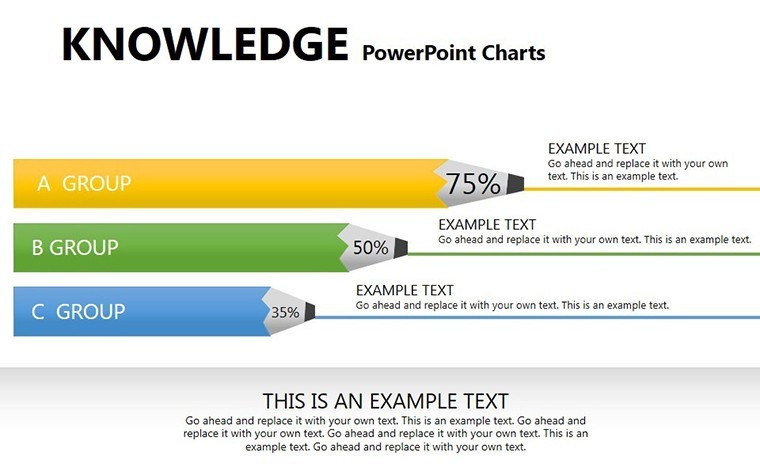
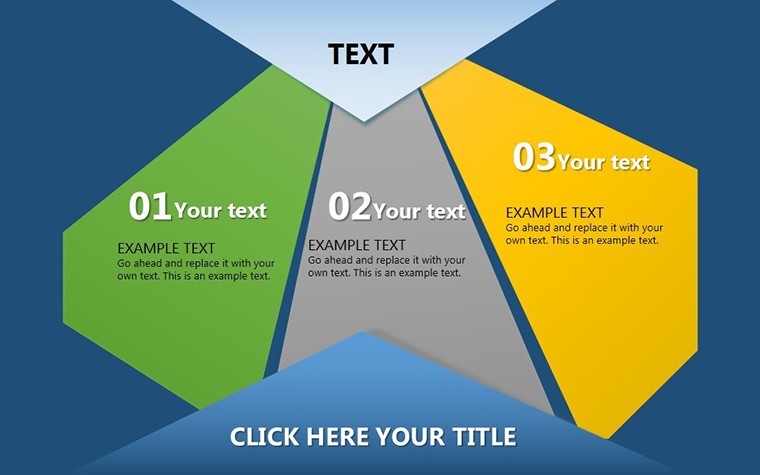
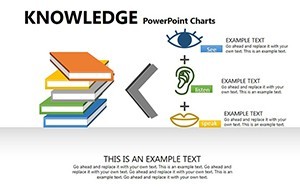
- Foundation Builders (Slides 1-3): Hierarchy trees for knowledge frameworks, animated to grow branch by branch.
- Project Powerhouses (Slides 4-7): Gantt timelines for action planning, with dragable milestones.
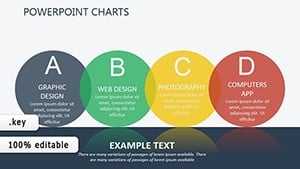
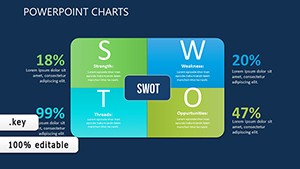
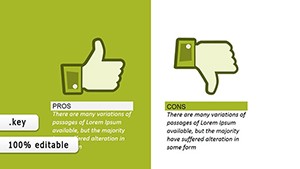
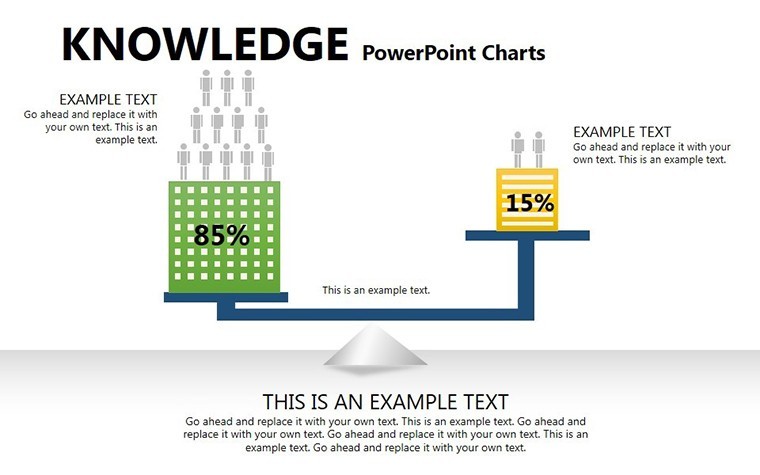
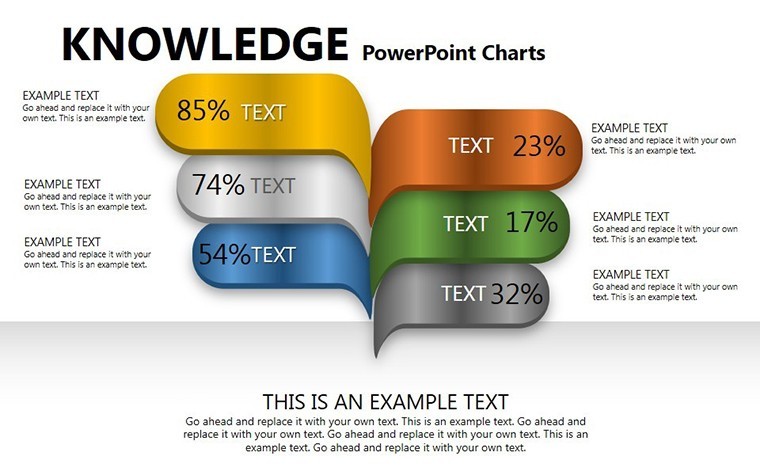
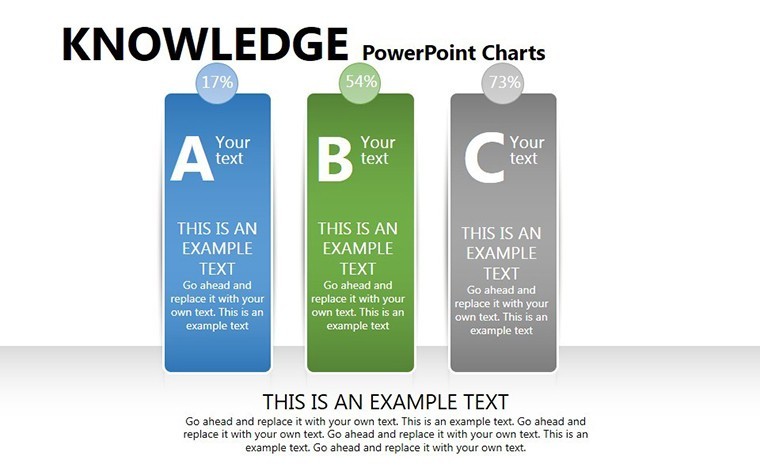
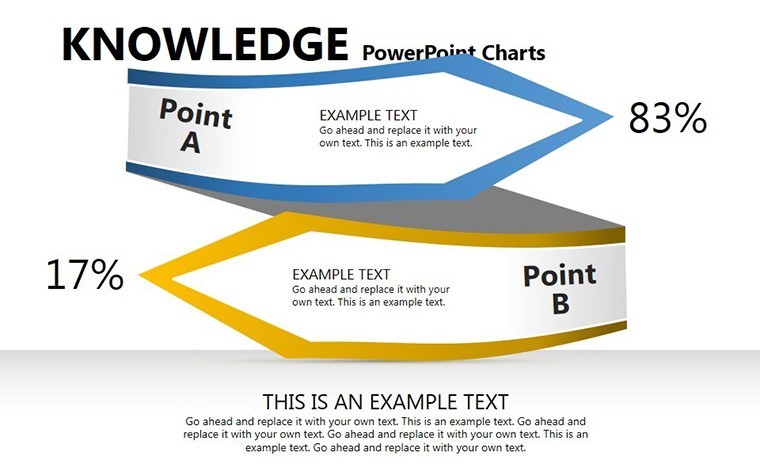
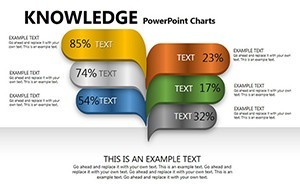
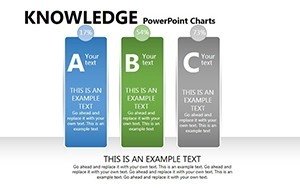
- Insight Illuminators (Slides 8-9): Comparative matrices evaluating methods, color-coded for quick scans.
- Wrap-Up Wizards (Slides 10-11): Feedback funnels and achievement radars, prompting reflection.
Enhance with tips: Sync animations to voiceover scripts for flipped classrooms, or hyperlink to rubrics for self-paced modules. This adaptability has made it a staple for edupreneurs flipping ideas into online courses.
Versatile Applications: From Classroom to Conference
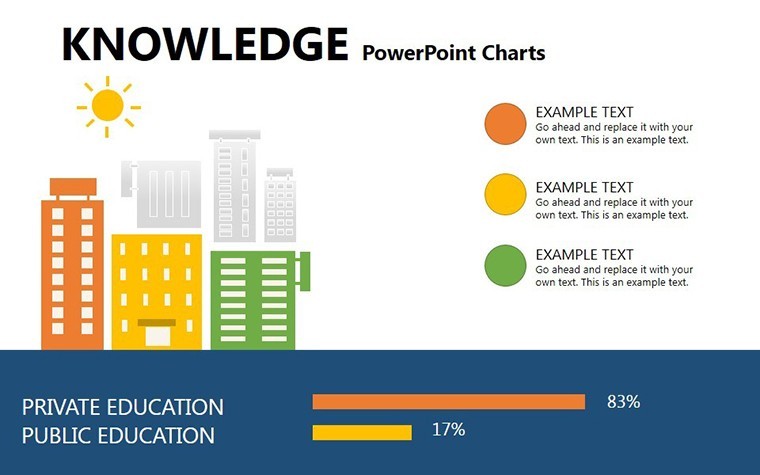
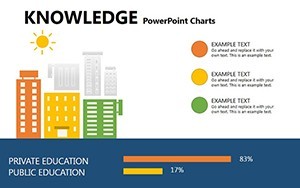
Teachers use it for interdisciplinary projects, like mapping historical events via timeline infographics, aligning with Common Core emphases on critical thinking. Mentors in professional development? Craft sessions on skill-building with progress trackers that mirror real growth arcs. Entrepreneurs pitching ed-tech solutions find the evaluation slides invaluable for ROI breakdowns, echoing successes at events like ISTE conferences.
A case in point: A university lecturer revamped her online syllabus reveal with these charts, reporting doubled participation rates. Versus generic Google Slides, this Keynote gem offers superior transitions and scalability, ensuring your educational narratives flow as smoothly as the knowledge they impart.
Expert Tweaks for Maximum Engagement
Layer in accessibility: Add alt text to visuals and high-contrast modes for inclusivity. Experiment with theme variations - pastels for younger audiences, neons for creative workshops. For depth, embed quizzes via hyperlinks, turning passive viewing into active learning. The payoff? Audiences not just informed, but empowered.
Step Into Smarter Sharing Today
Why settle for dry lectures when you can spark curiosity? Secure your Knowledge Education Keynote Charts now and redefine how you disseminate wisdom. The classroom - or boardroom - awaits your transformation.
Frequently Asked Questions
How do these charts support project-based learning?
With dedicated flows for planning, execution, and evaluation, they mirror PBL cycles for hands-on guidance.
Are the animations suitable for young learners?
Yes, gentle and customizable to avoid overstimulation, focusing on smooth, educational reveals.
Can I integrate videos or audio?
Effortlessly - placeholders support multimedia embeds for richer, interactive content.
What's the file compatibility?
Native .key for Keynote, with export options to PDF or video for broader sharing.
Is it editable on iPad?
Fully, via Keynote app, with touch-friendly vector handling.
Any design tips for beginners?
Start with master slides for consistency, then populate one section at a time.