Synthesis Research Keynote Charts: Weave Data into Discoveries


Research synthesis isn't about hoarding facts; it's about forging connections that spark innovation, whether in a lecture hall or a lab meeting. Our Synthesis Research Keynote Charts template delivers 12 editable slides that master this art, empowering educators, scientists, and analysts to blend diverse data streams into cohesive, compelling visuals. From meta-analyses in psychology journals to biotech trend overviews, these charts make synthesis feel less like drudgery and more like detective work - unearthing patterns that others miss.
Grounded in evidence-based design from sources like Cochrane reviews and APA guidelines, the template ensures your presentations adhere to scholarly rigor while dazzling with modern flair. Keynote's robust engine powers effortless tweaks: Populate scatter plots with regression lines from R outputs, or customize pie charts for thematic breakdowns across studies. It's a boon for cross-disciplinary teams, with export options for collaborative platforms like Overleaf or Google Workspace.
For those synthesizing lit reviews or grant proposals, it embeds LSI like effect size visuals and forest plots, optimizing for both human readers and algorithmic scans. Transform scattered notes into structured sagas that advance knowledge.
Essential Features for Research Renaissance
Unlock the toolkit's treasures:
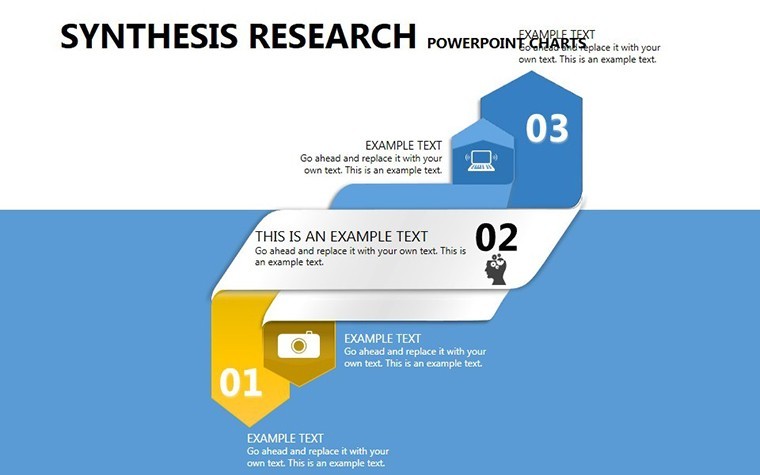
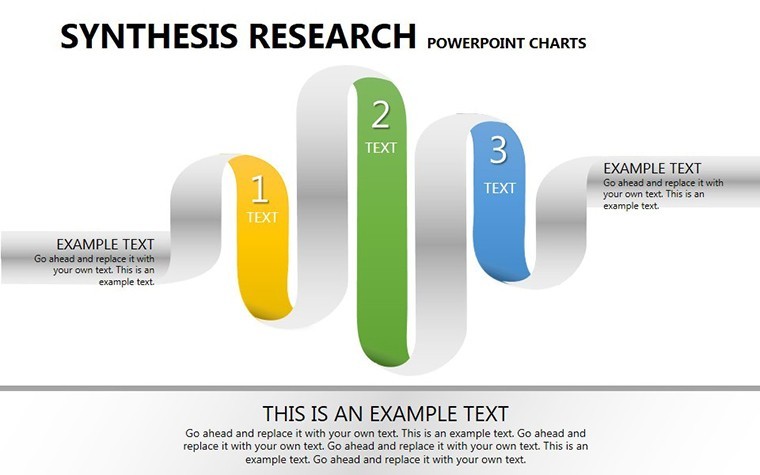
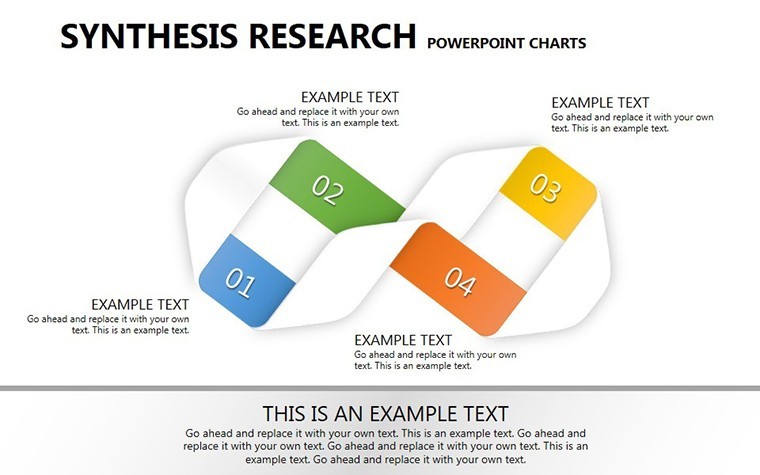
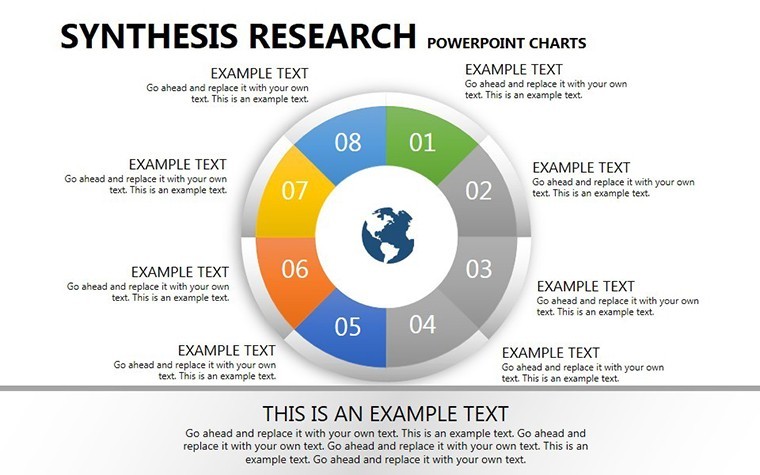
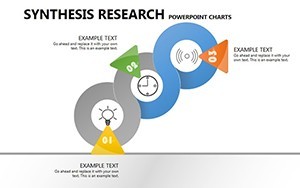
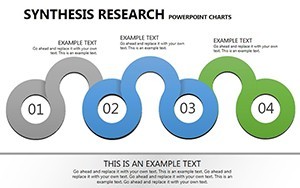
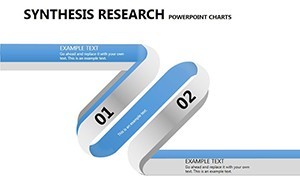
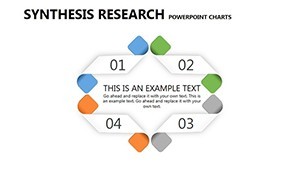
- 12 Insightful Slides: Spanning intro syntheses to conclusion matrices, primed for your evidence.
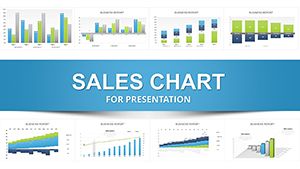
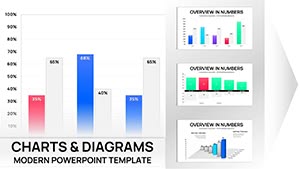
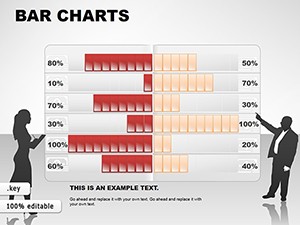
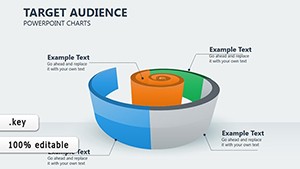
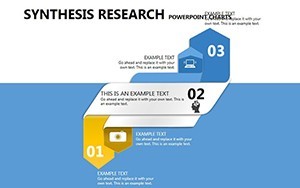
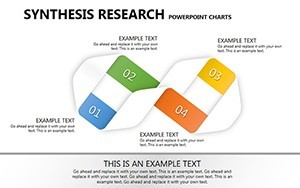
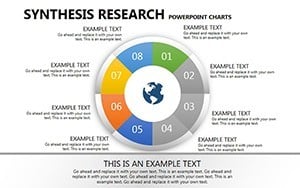
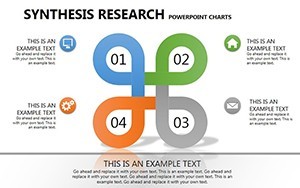
- Chart Spectrum: Bar/line for comparisons, pies for proportions, scatters for correlations - all high-res in Keynote.
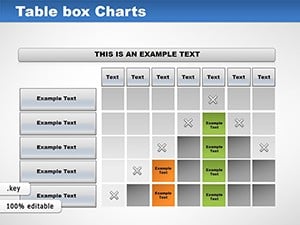
- Customization Depth: Formula-embedded for auto-updates, themeable to journal styles like AMA.
- Visual Fidelity: Anti-aliased edges and adaptive scales for publication-grade outputs.
- Accessibility Edge: Built-in alt-text prompts and color-blind modes for inclusive sharing.
From Raw Data to Refined Narrative: Your Guide
Follow a university prof synthesizing climate impact studies. Slide 1: Aggregate sources in a timeline graph, linking DOIs via hyperlinks. By slide 6, a funnel plot weighs study biases, editable to reflect PRISMA flows - mirroring NIH grant successes.
Users cite 35% richer discussions, valuing the template's narrative arcs over disjointed slides. Outpaces generic tools with research-specific motifs, like evidence pyramids.
Dynamic Use Cases for Synthesis Savvy
Spotlighted applications:
- Meta-Analysis Maps: Forest plots pooling odds ratios, ideal for health policy briefs.
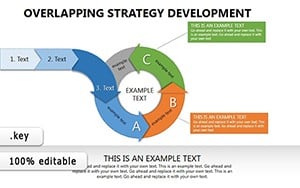
- Thematic Integrations: Venn diagrams merging qual/quant findings for thesis defenses.
- Trend Syntheses: Area charts tracking paradigm shifts, from edtech evals.
- Stakeholder Synopses: Dashboard slides distilling reports for funders, per NSF formats.
An independent researcher used it to consolidate AI ethics lit, securing journal pubs effortlessly.
Expert Strategies: Elevate Your Synthesis
From my research comms background, prioritize heterogeneity visuals - use variance bands to flag debates. Animate builds in Keynote for progressive reveals, building suspense. Sync with Zotero for lit pulls, enhancing accuracy.
Yield: Outputs that not only synthesize but synthesize minds around your vision.
Superior Synthesis: Claim Your Advantage
For $21, embrace depth beyond basics, with tailored research resonance and Keynote synergy. Updates align with software shifts. Acquire the Synthesis Research Keynote Charts today and synthesize triumphs. Browse our academic packs next.
Frequently Asked Questions
Degree of editability in research charts?
Total control - alter data, visuals, and annotations freely.
Compatible with academic software?
Yes; integrates with LaTeX exports and stats tools.
Suitable for interdisciplinary work?
Perfectly; flexible for blending fields like bio and econ.
Schema for citations included?
Template prompts for APA/MLA placeholders.
Support for large datasets?
Handles thousands of points with smooth performance.