Temple Column Keynote Charts: Elevate Business Narratives with Customizable Visuals


Type: Keynote Charts template
Category: Relationship, Flow, 3D
Sources Available: .key
Product ID: KC00240
Template incl.: 26 editable slides
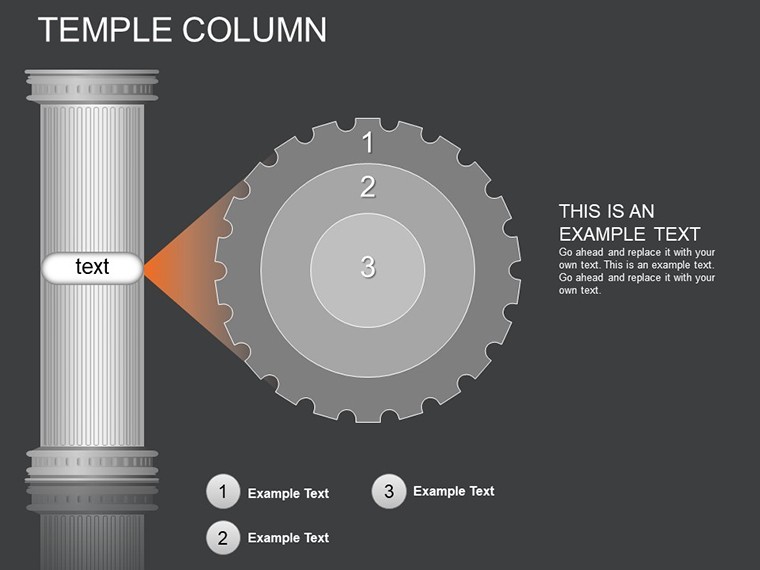
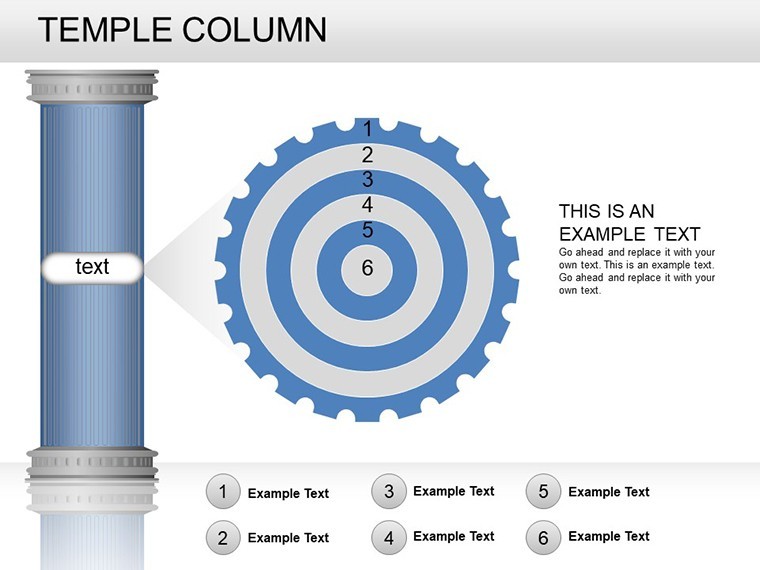
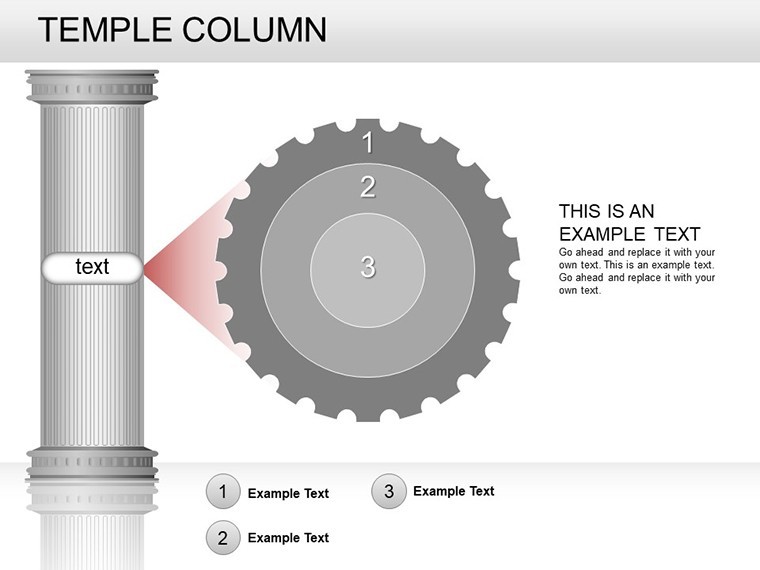
Picture this: You're in a high-stakes boardroom, unveiling your latest strategy, and instead of yawns, you get nods of approval. That's the magic of the Temple Column Keynote Charts template. Crafted for discerning professionals, this collection boasts 26 editable slides that weave relationship flows and 3D elements into your data stories. Whether you're a consultant mapping client journeys or a business leader illustrating process optimizations, these charts turn raw numbers into relatable insights. Drawing from design principles akin to ancient temple architectures - stable, grand, and timeless - this template ensures your presentations stand tall amid competition.
Compatible exclusively with Keynote, it integrates smoothly, offering flexible layouts that adapt to diverse industries. From finance to healthcare, users appreciate how the flow charts depict interconnected processes, much like columns supporting a grand structure. This isn't about mere aesthetics; it's about building authoritative narratives that resonate, aligning with best practices from bodies like the Project Management Institute for clear visual communication.
Harnessing Flow and Relationship Dynamics in Your Slides
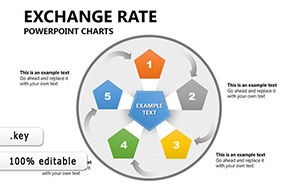
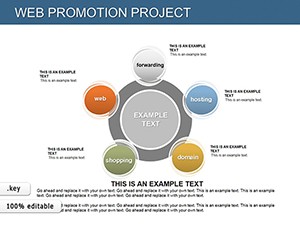
The core strength lies in its relationship and flow-oriented designs, perfect for showing cause-effect scenarios or sequential steps. In architecture firms, for example, column-inspired charts can outline project phases from concept to completion, enhancing proposals with visual hierarchy. Professionals note that such structured visuals reduce miscommunication, fostering better team alignment and client satisfaction.
Standout Features for Seamless Customization
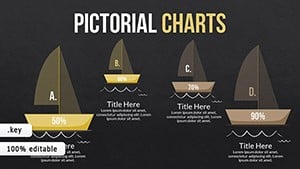
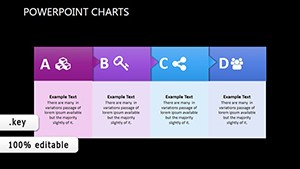
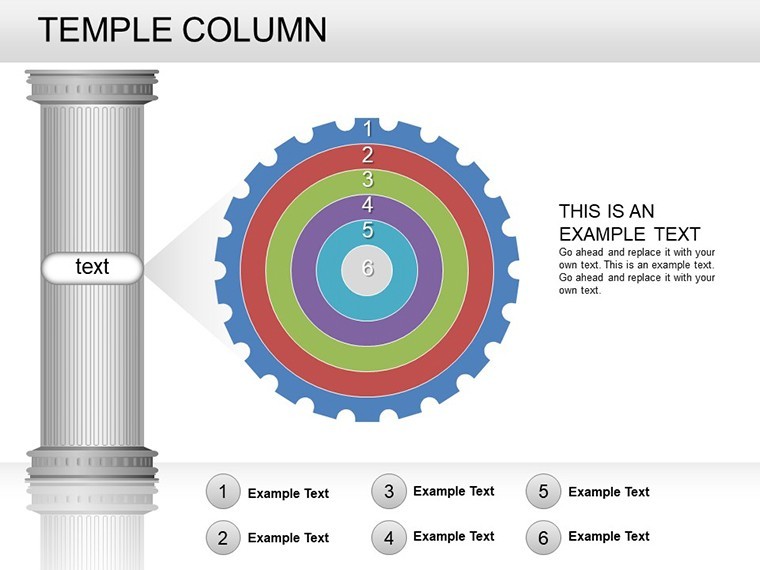
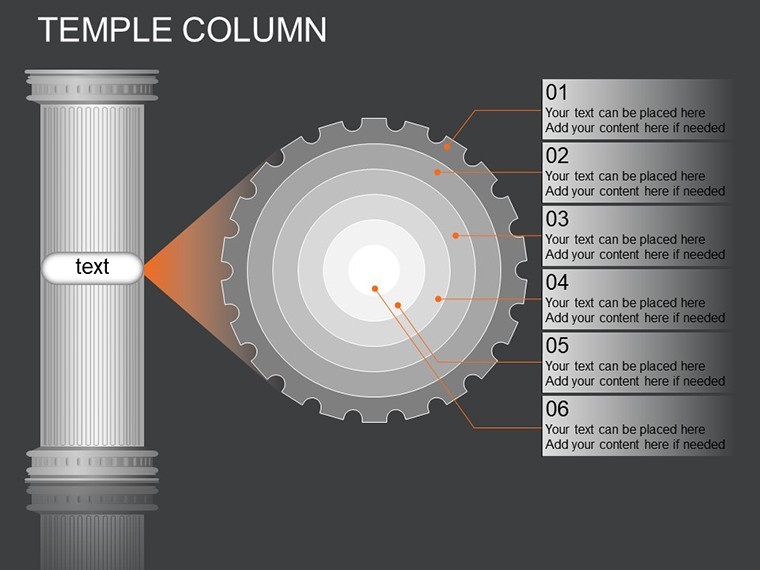
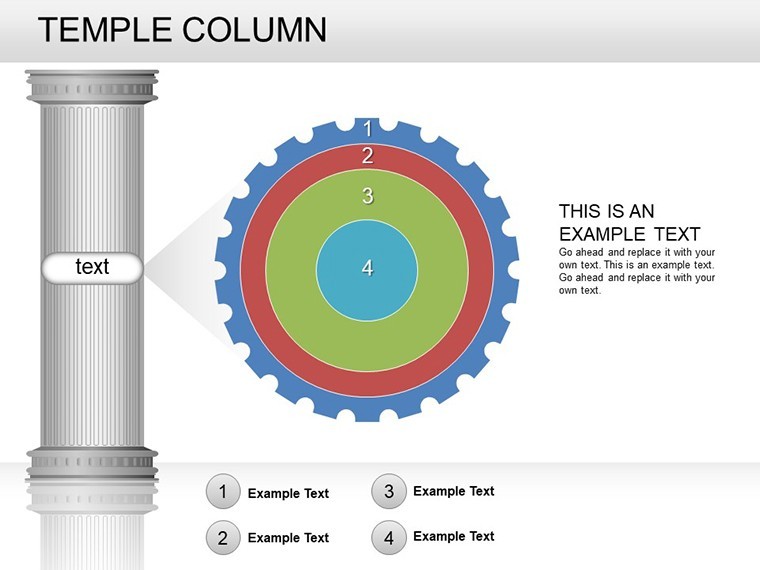
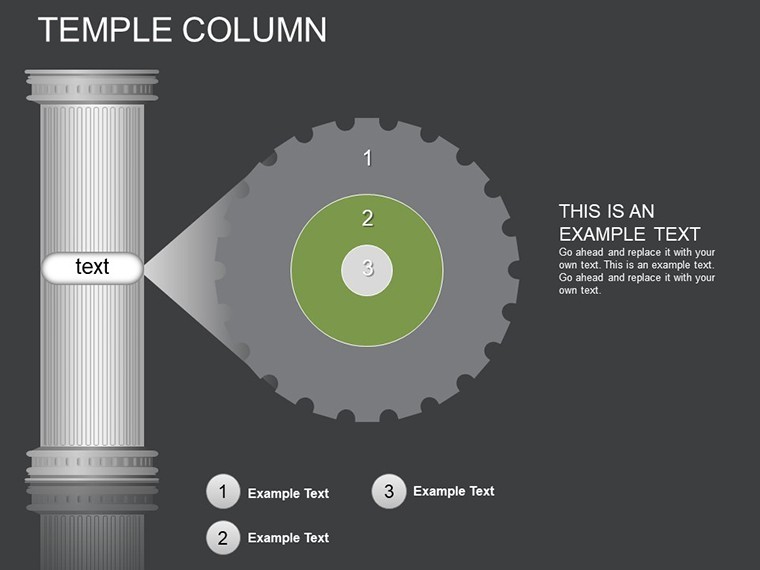
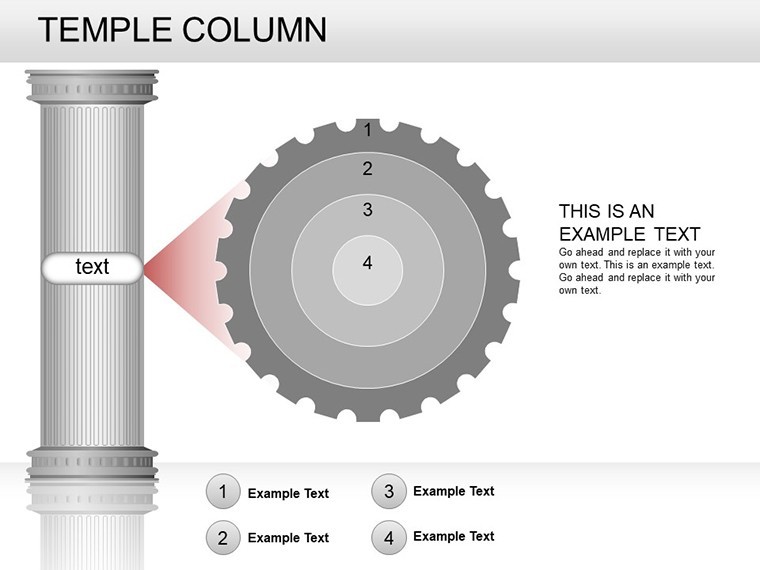
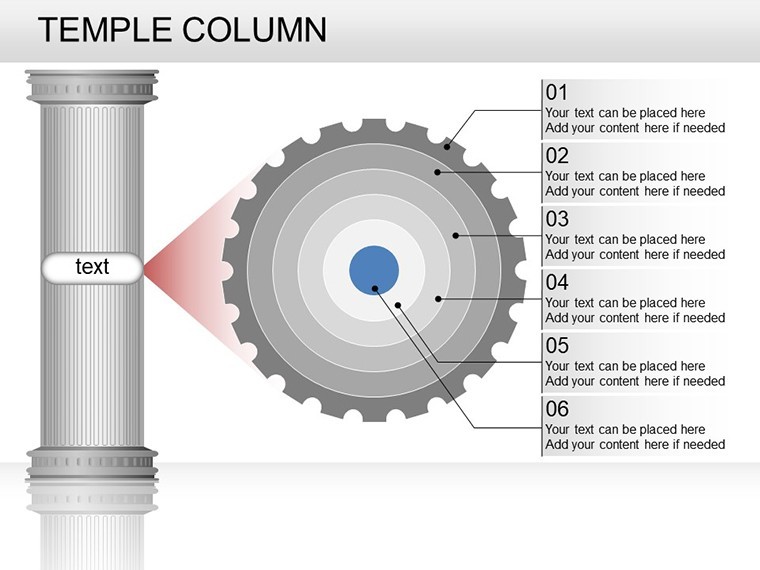
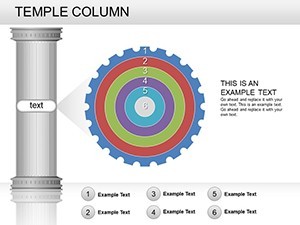
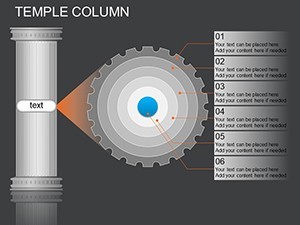
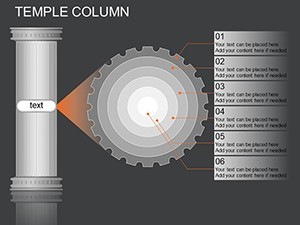
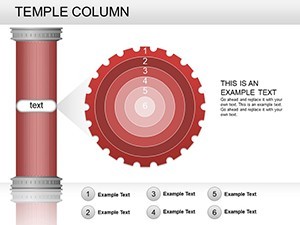
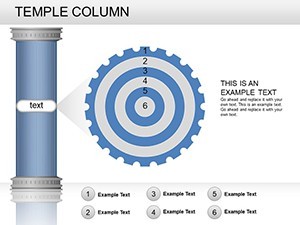
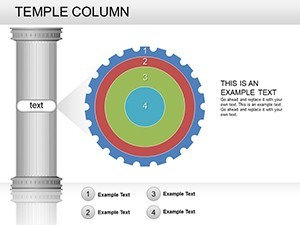
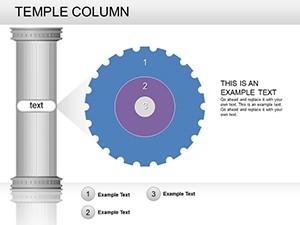
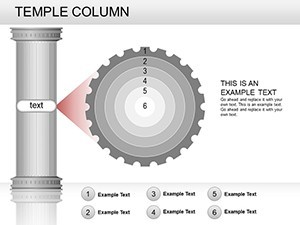
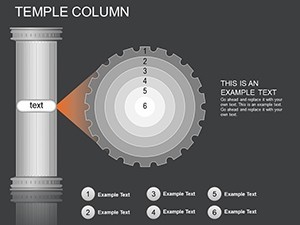
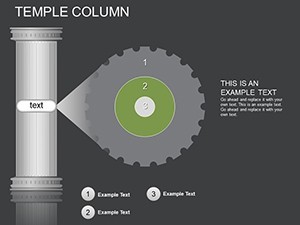
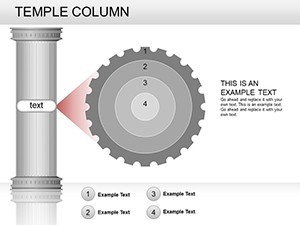
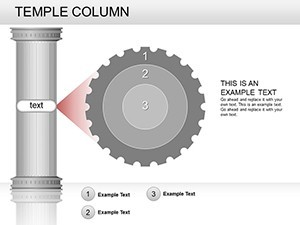
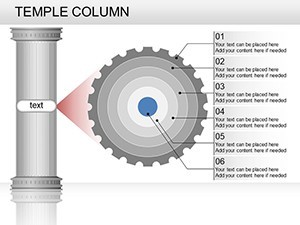
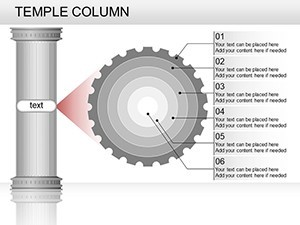
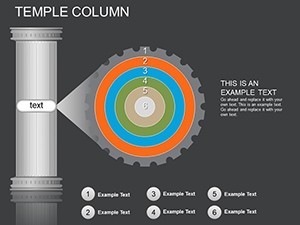
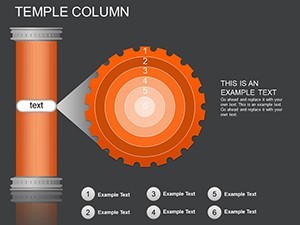
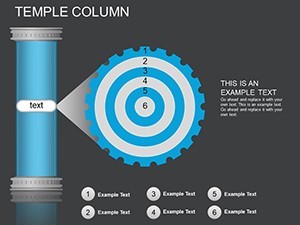
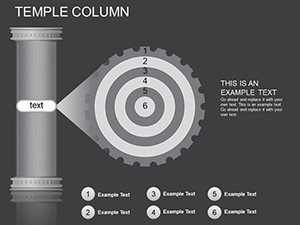
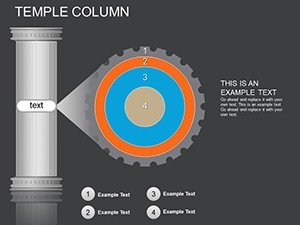
- Diverse Chart Varieties: Includes flow diagrams, relationship maps, and 3D columns for multifaceted data representation.
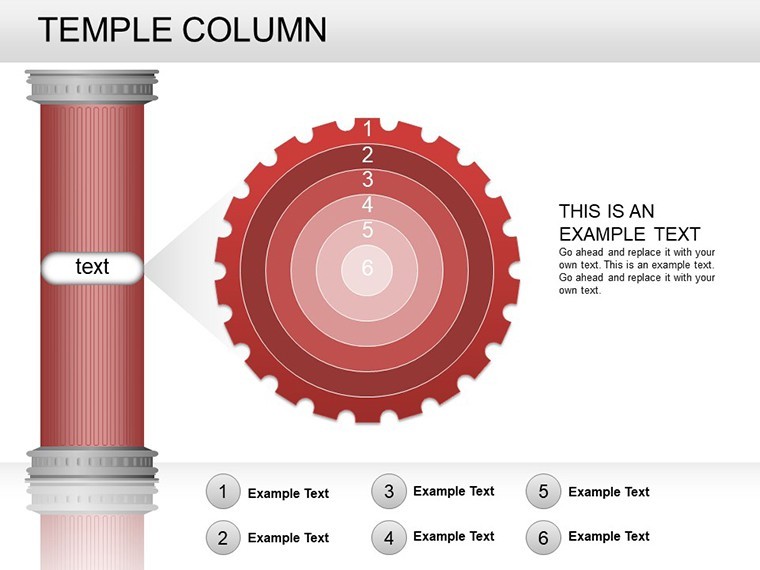
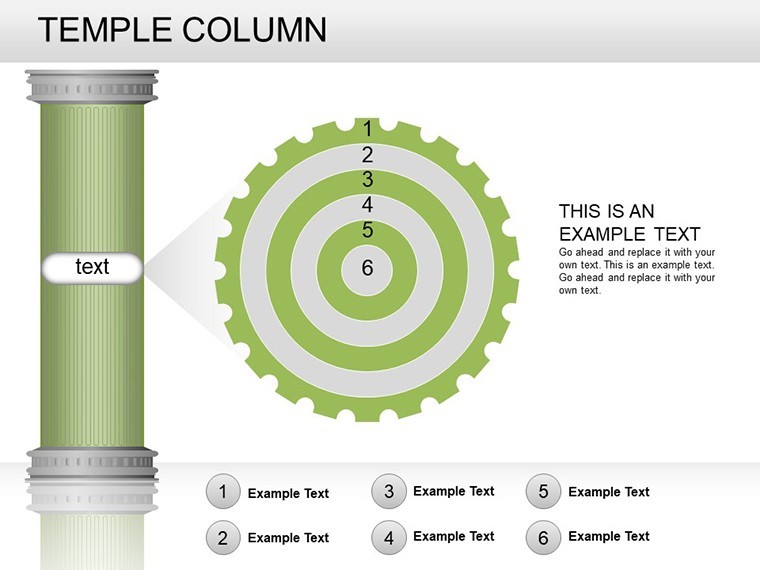
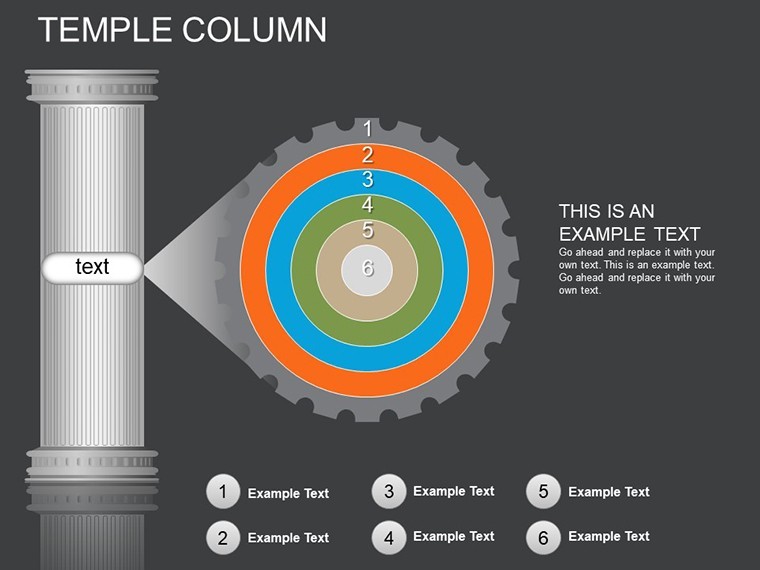
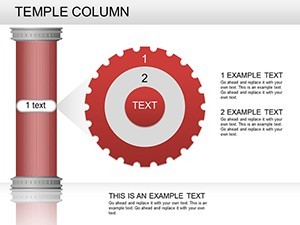
- Brand-Aligned Edits: Modify colors, fonts, and elements to reflect your company's ethos, ensuring consistency across materials.
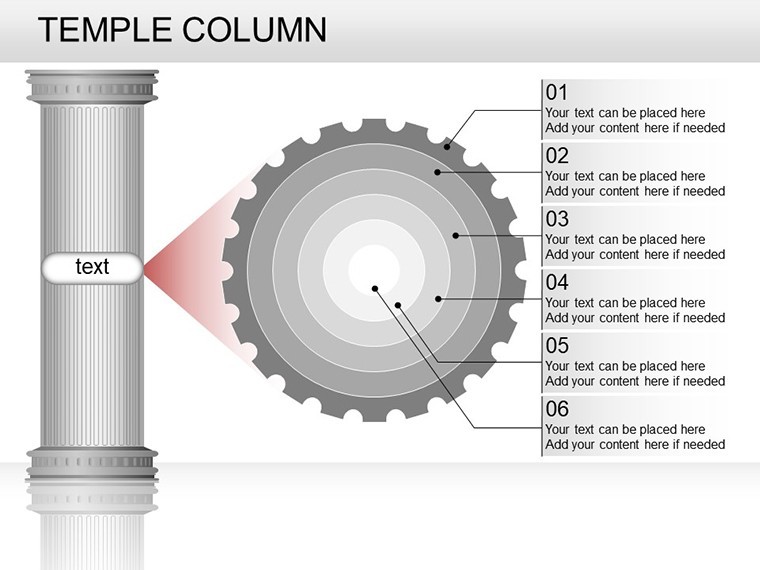
- Readable and Organized: Clean designs promote clarity, making complex info accessible at a glance.
- Multiple Layout Options: From introductory overviews to detailed breakdowns, catering to short pitches or in-depth reviews.
- Integration Ease: Import data from spreadsheets; add animations for dynamic reveals.
A case study from a tech consultancy highlights success: Using flow charts to map software development cycles, they shortened client onboarding by 20%, crediting the template's intuitive structure.
Tailored Use Cases Across Industries
Explore practical applications: In marketing, relationship charts can illustrate customer touchpoints, aiding strategy refinement. For entrepreneurs, 3D columns visualize growth trajectories, impressing investors with solid projections. Educators might employ flow diagrams to teach business processes, making abstract theories concrete.
Getting started is simple: Download the .key file, select a slide, populate with your data, tweak visuals, and preview. Unlike generic tools, this template's pre-set harmonies save design time, letting you focus on content.
Integrating Icons and Graphics for Added Depth
Enhance with included graphics that echo columnar strength - think icons of pillars for stability themes. In an urban planning pitch, pair these with flow charts to depict infrastructure evolutions, creating a narrative that's both informative and inspiring.
Slides vary from basic column bars for comparisons to intricate relationship webs for ecosystem analyses, all editable for precision.
Superior to Basic Keynote: Why It Matters
Basic charts lack the sophistication; Temple Column adds layers of professionalism, leading to higher engagement rates. Feedback from business forums suggests visuals like these increase retention by up to 40% in presentations.
Incorporate into workflows: Use for quarterly reviews or ad-hoc reports, adapting quickly to needs.
Expert Tips for Optimal Use
- Start with data mapping to choose the right chart type.
- Balance visuals with text for uncluttered slides.
- Leverage Keynote's collaboration for team inputs.
- Export to PDF for sharing beyond Apple ecosystems.
- Iterate based on audience feedback for refinement.
These strategies ensure your presentations not only inform but inspire action.
Ultimately, the Temple Column Keynote Charts template empowers you to construct presentations as enduring as its namesake. For consultants crafting client strategies or leaders driving change, it's the foundation you need. Step up your game - grab this template now and build presentations that endure.
Frequently Asked Questions
- How many chart types are available?
- Multiple, including flows, relationships, and 3D columns, all customizable.
- Can I integrate this with other Apple tools?
- Yes, it pairs well with Numbers for data and Pages for reports.
- Is it suitable for beginners?
- Absolutely, with intuitive edits and no steep learning curve.
- What if I need more slides?
- Duplicate and modify existing ones for expansion.
- Does it support animations?
- Yes, add Keynote animations to enhance dynamism.
- Are updates provided?
- Check the site for any future enhancements.