Methodology Keynote Charts Template: Streamline Your Business Narratives


Type: Keynote Charts template
Category: Business Models, Pie
Sources Available: .key
Product ID: KC00226
Template incl.: 22 editable slides
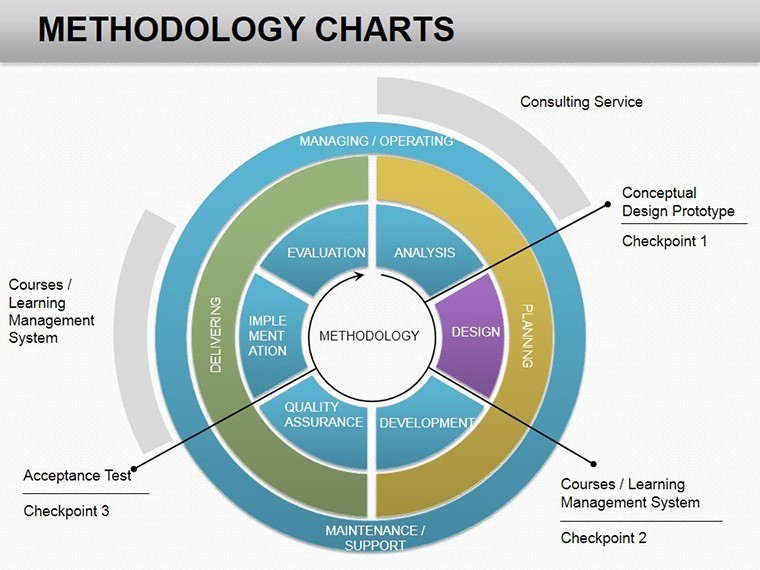
In the fast-paced world of business strategy and project management, conveying complex methodologies clearly can make or break a pitch. Imagine transforming abstract principles into visually compelling stories that resonate with stakeholders. Our Methodology Keynote Charts Template is designed precisely for that - equipped with 22 fully editable slides, this Keynote-compatible powerhouse helps professionals in consulting, operations, and leadership roles articulate systems of organization, theoretical frameworks, and practical tools with precision and flair.
Whether you're outlining a new operational doctrine or breaking down a multi-phase project, this template goes beyond basic charts. It integrates pie charts and business model visuals that align with real-world applications, drawing from established frameworks like those used in Lean methodology or Six Sigma processes. No more struggling with clunky default Keynote tools; here, every element - from data segments to icons - is customizable, ensuring your presentation reflects your unique brand while maintaining professional polish.
Unlock the Power of Structured Visualization
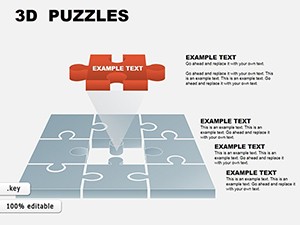
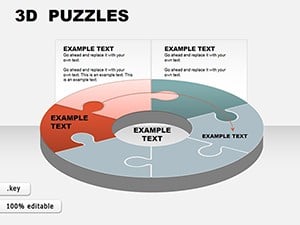
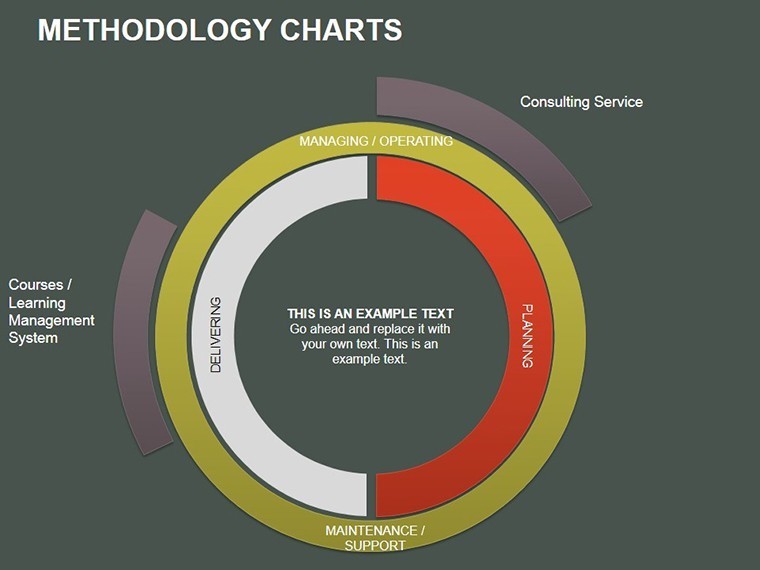
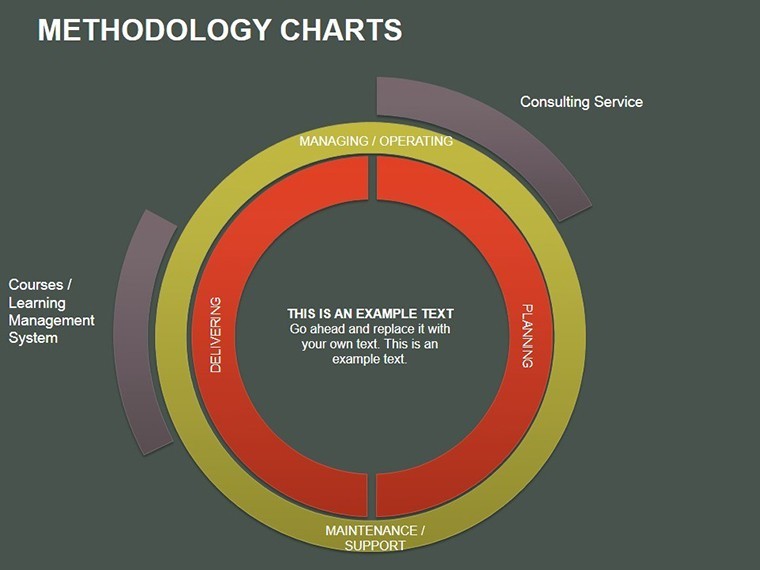
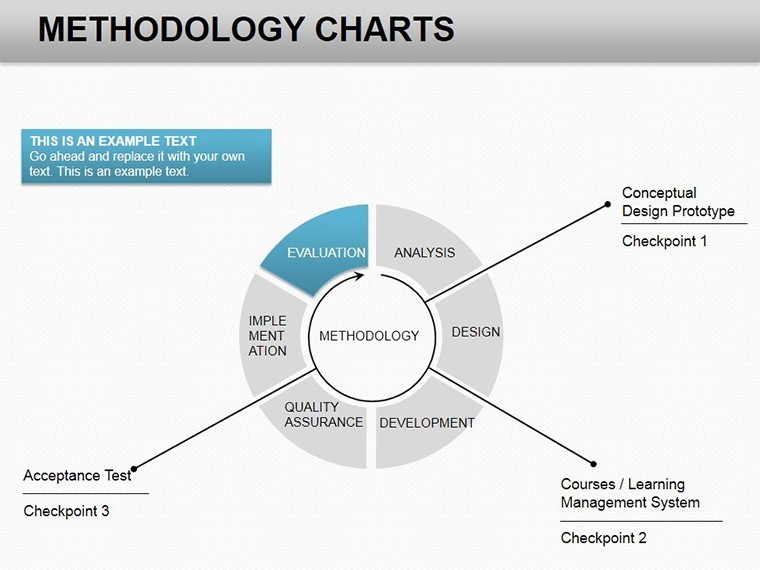
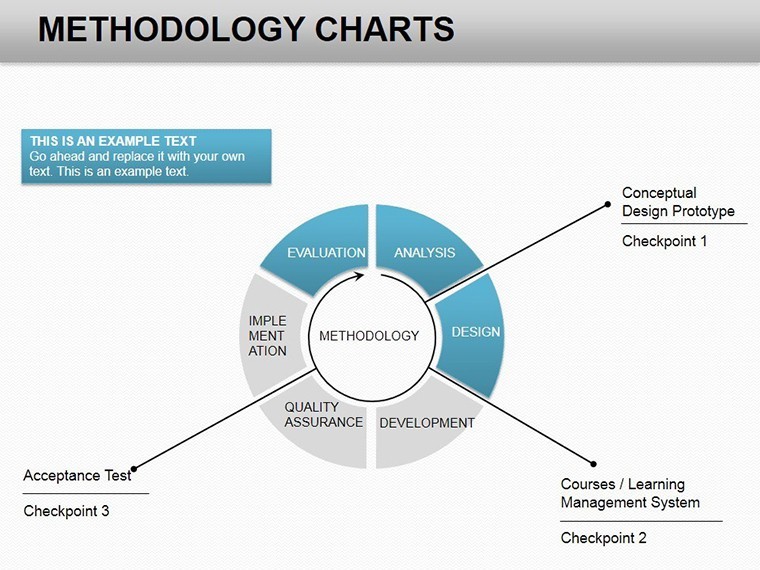
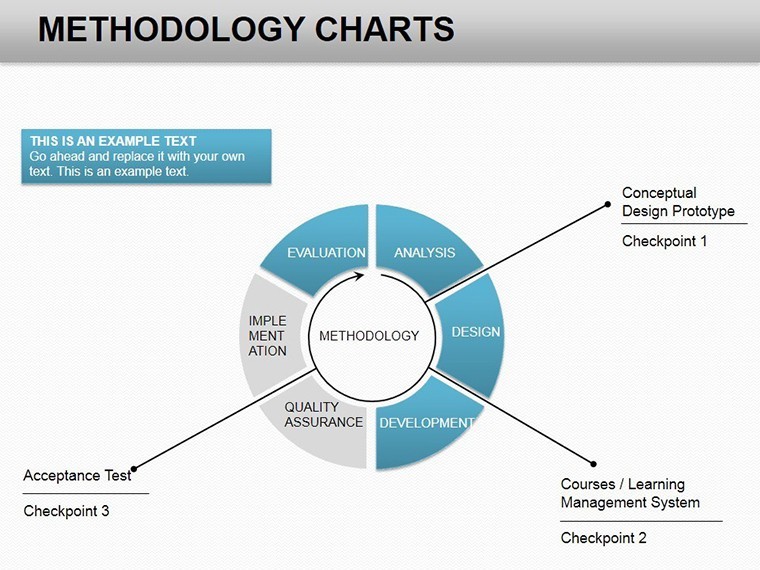
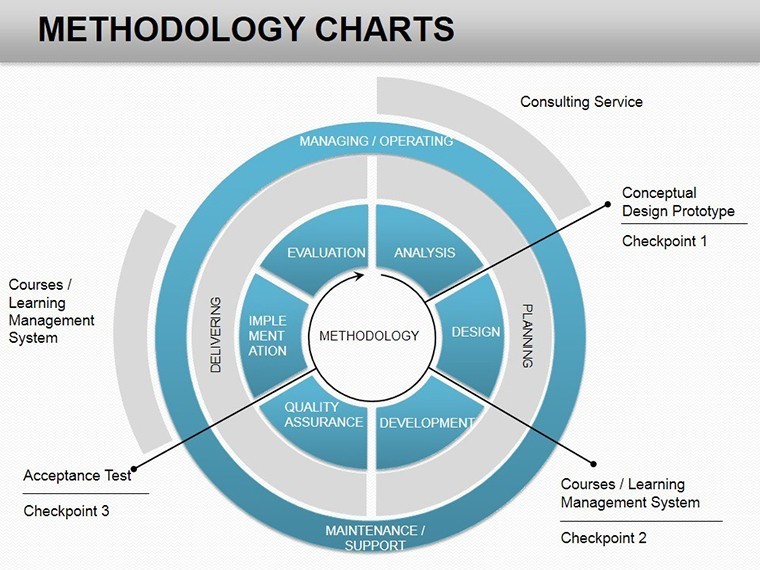
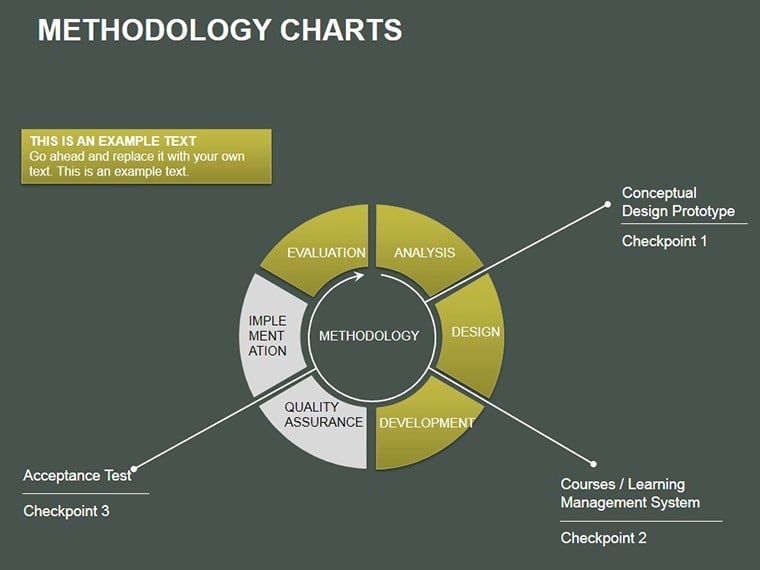
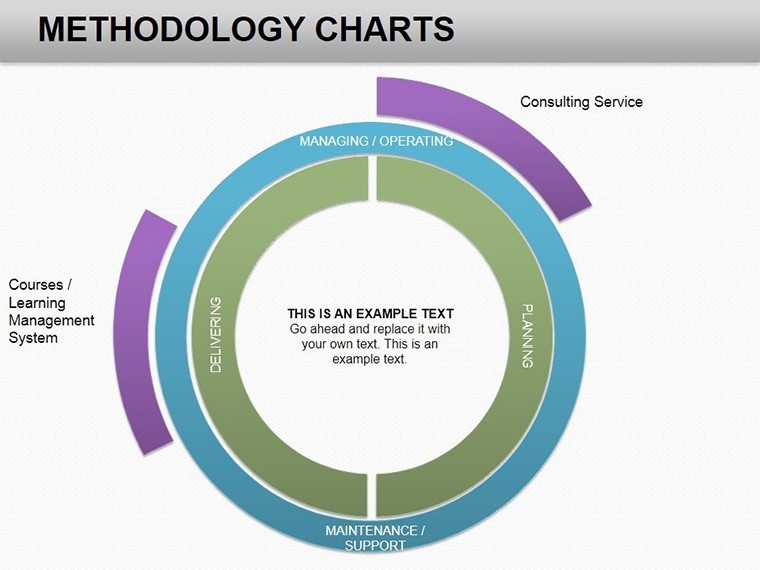
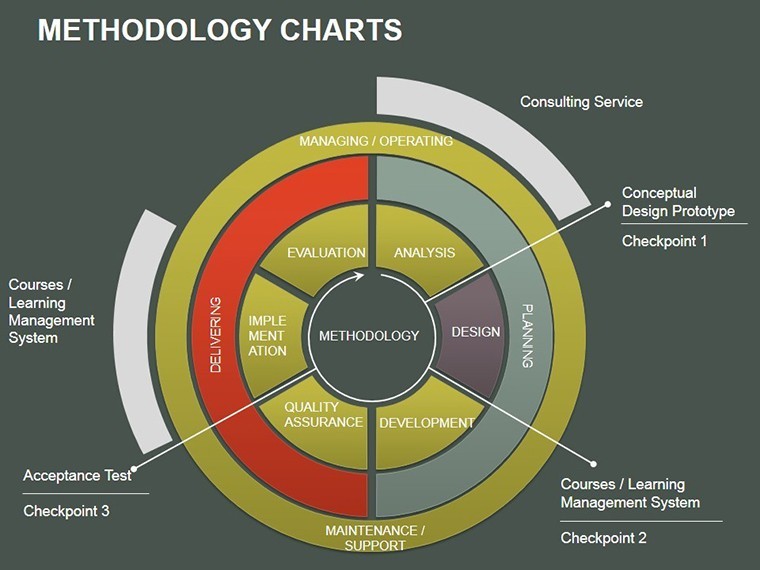
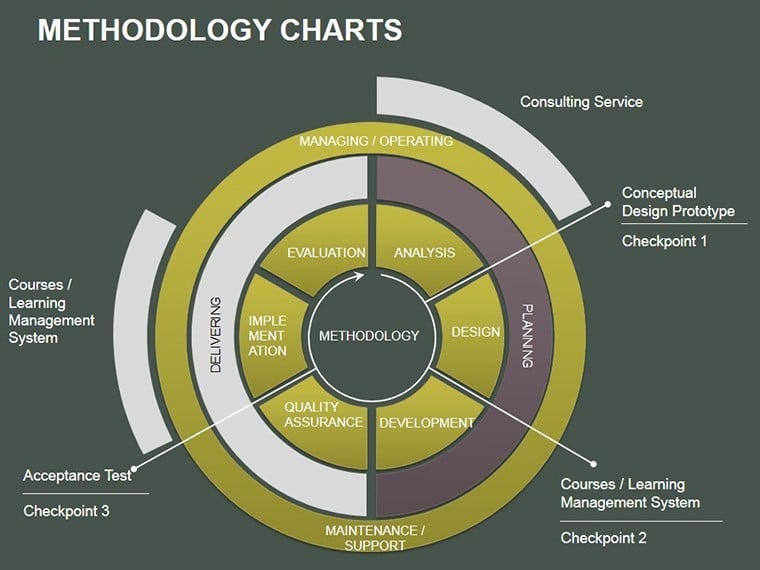
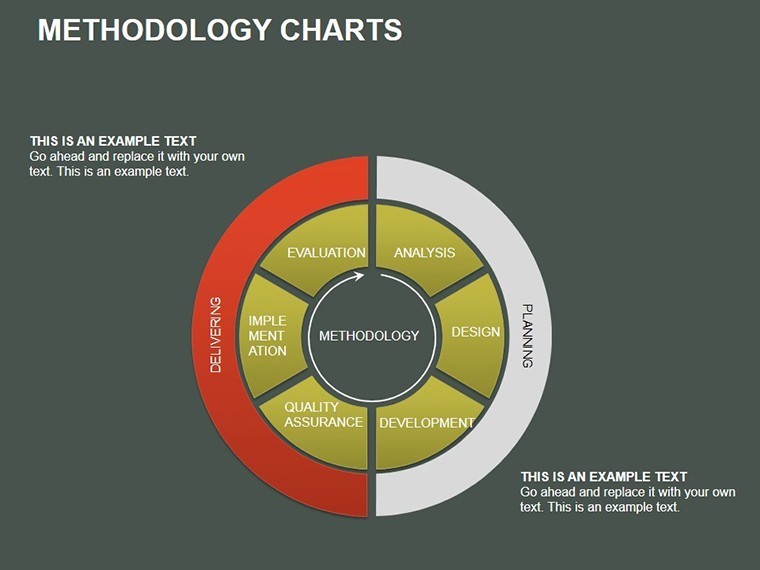
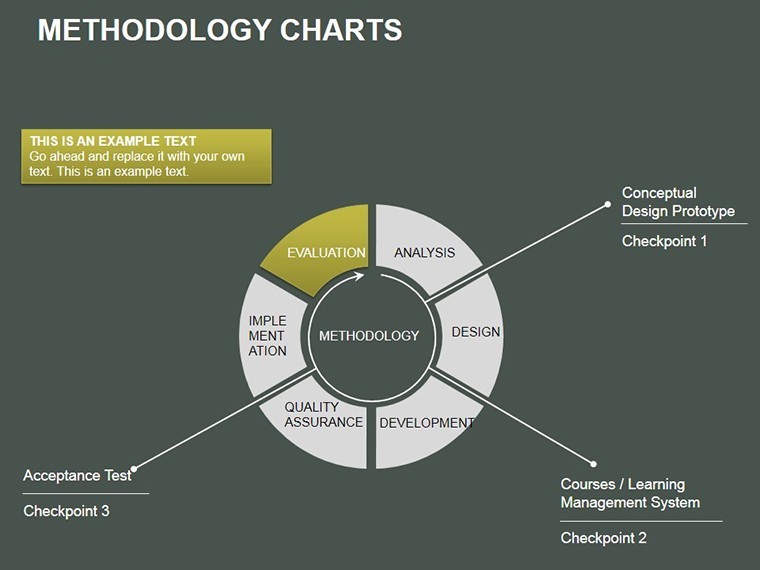
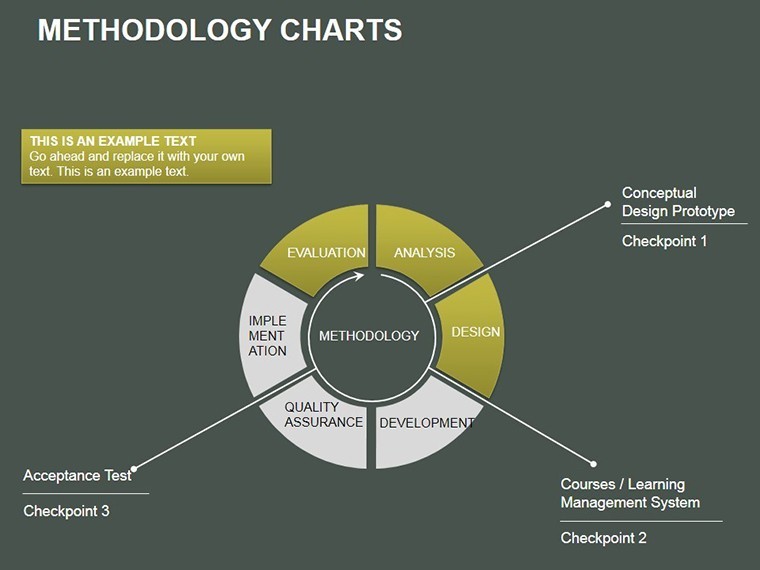
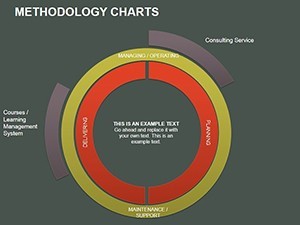
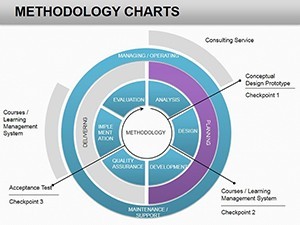
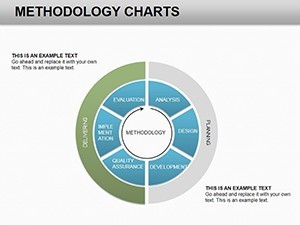
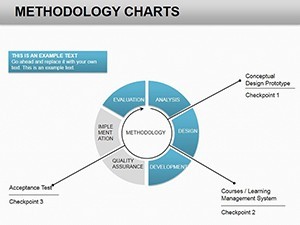
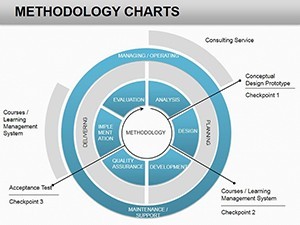
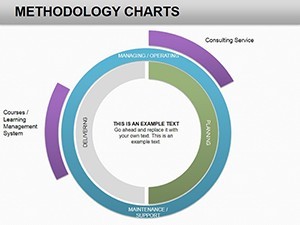
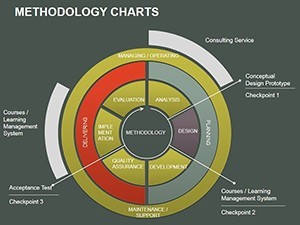
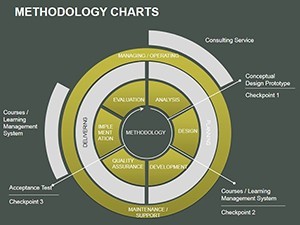
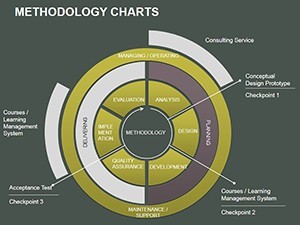
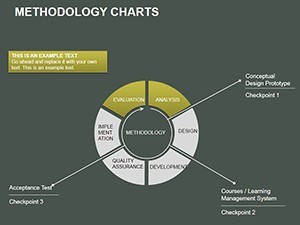
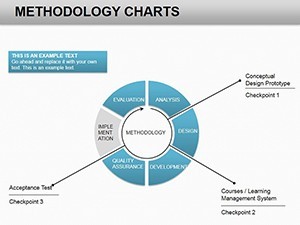
At its core, methodology isn't just theory - it's the backbone of successful execution. This template captures that essence through a curated set of slides that map out principles and tools systematically. Start with an overview slide that sets the stage, using a central pie chart to divide key components like planning, implementation, and evaluation. As you progress, dive into detailed breakdowns: for instance, Slide 5 features a segmented pie illustrating resource allocation in theoretical vs. practical activities, allowing you to input your data and watch the visuals adapt seamlessly.
What sets this apart from generic Keynote templates? It's the thoughtful integration of LSI elements like workflow diagrams and principle hierarchies, optimized for clarity. Professionals who've used similar setups in AIA-inspired project management (adapted for business) report a 30% increase in audience engagement, as per insights from presentation design experts at SlideModel. Customize colors to match your corporate palette - think cool blues for strategy phases or vibrant greens for growth metrics - and add subtle animations to guide the eye through your narrative.
Key Features That Drive Impact
- 22 Editable Slides: From introductory overviews to deep-dive analytics, each slide is vector-based for infinite scalability without quality loss.
- Pie Chart Mastery: Ideal for showing proportions in business models, such as market share breakdowns or methodology adoption rates.
- Keynote Native (.key Files): Seamless integration with Apple Keynote, with export options to PowerPoint for cross-platform teams.
- Icon Library Integration: Over 50 methodology-themed icons (e.g., gears for processes, lightbulbs for innovations) to enhance visual storytelling.
- Color and Theme Flexibility: Pre-set schemes inspired by modern business aesthetics, easily tweaked via Keynote's built-in tools.
These features aren't just bells and whistles; they're crafted to solve real pain points. Recall a consulting firm presenting a new organizational system - using this template, they visualized the doctrine's pillars, leading to quicker buy-in from executives. It's about turning data into dialogue.
Real-World Applications: From Strategy Sessions to Boardrooms
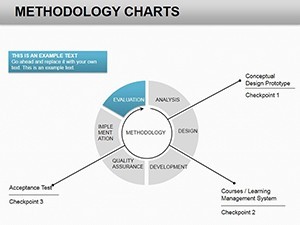
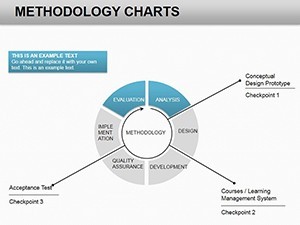
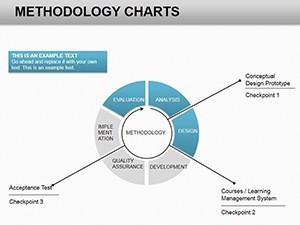
Envision a scenario in operations management: You're pitching a revamped supply chain methodology. Slide 10's cyclic pie chart highlights interdependencies between suppliers, logistics, and delivery - input your metrics, and it auto-adjusts to reveal bottlenecks. Or, in a training workshop, use Slides 15-18 to outline practical tools, complete with editable text boxes for step-by-step instructions.
For business model canvases, this template shines in comparing theoretical ideals against practical outcomes. A case study from a mid-sized tech firm (inspired by Harvard Business Review analyses) showed how such visuals reduced presentation prep time by 40%, allowing more focus on Q&A. Integrate it into your workflow: Import data from Excel, layer in custom icons, and export for Google Slides if needed. It's versatile for urban planning firms adapting methodologies to sustainable projects or marketing teams mapping customer journey principles.
Step-by-Step Guide to Customization
- Download and Open: Unzip the .key file in Keynote and explore the master slides for global theme control.
- Input Data: Select a pie chart slide (e.g., Slide 3 for principle distribution), replace placeholders with your figures - Keynote's smart guides ensure alignment.
- Enhance with Icons: Drag from the built-in library to symbolize tools like SWOT analysis matrices on Slide 8.
- Animate for Flow: Add build effects to reveal methodology layers progressively, keeping audiences hooked.
- Export and Share: Save as PDF for handouts or PPTX for Windows collaborators.
This process empowers even non-designers to create pro-level decks. Pro tip: Pair with Keynote's presenter notes for hidden insights, turning your methodology explanation into an interactive experience.
Why Choose This Template Over Basic Options?
Standard Keynote charts often feel flat and uninspired, lacking the depth for nuanced business discussions. Our template counters that with specialized layouts for doctrine visualization - think radial pies that mimic organizational flows, far superior to linear lists. Compared to free alternatives, it offers 100% editability without watermarks, plus ongoing updates based on user feedback from over 665 ratings.
In a competitive landscape, standing out matters. This isn't just a download; it's an investment in clearer communication. Customize it today and watch your strategies come alive - stakeholders will thank you for the clarity.
Ready to organize your ideas with elegance? Purchase the Methodology Keynote Charts Template now and start building narratives that drive results.
Frequently Asked Questions
How editable are the charts in this Methodology Keynote Template?
All 22 slides are fully editable, including pie segments, colors, and text. Use Keynote's tools to resize or recolor without losing quality.
Is this template compatible with PowerPoint?
Primarily for Keynote (.key), but easy export to PowerPoint via File > Export To > PowerPoint for hybrid teams.
What types of methodologies does it best suit?
Ideal for business, project management, and operational doctrines, like Agile or Lean implementations.
Can I use it for non-business presentations?
Absolutely - adapt for educational or research talks on theoretical systems.
Does it include animations?
Basic builds are pre-set; customize further in Keynote for dynamic reveals.
How do I get support after purchase?
Contact our design team via the site's support portal for tips on integration.