Promo code "00LAYOUTS"
Conceptual Plan Charts for Keynote: Piece Together Complex Ideas
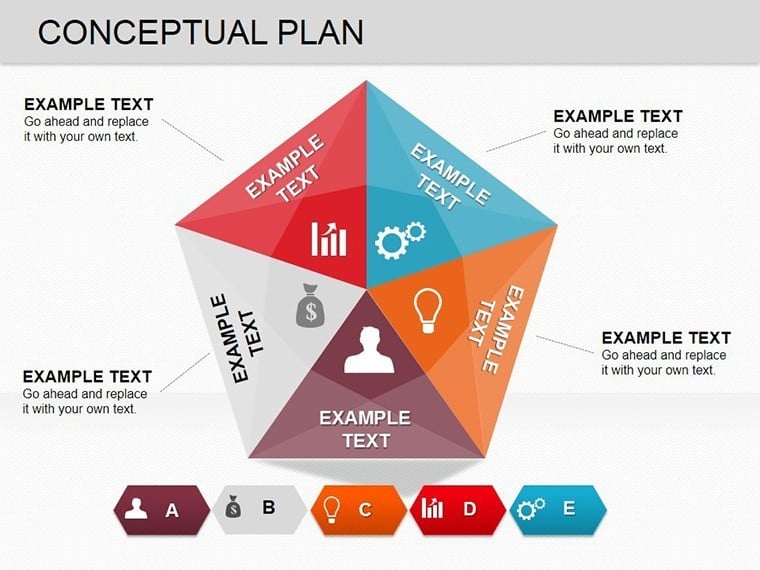
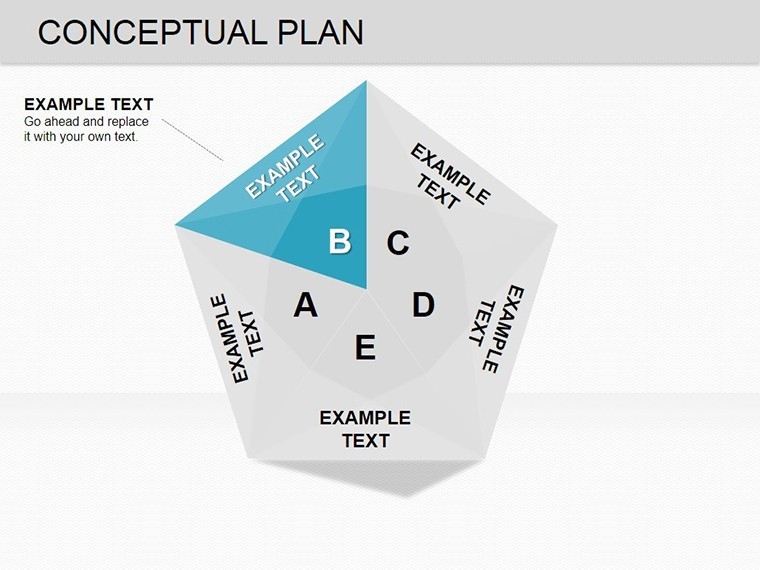
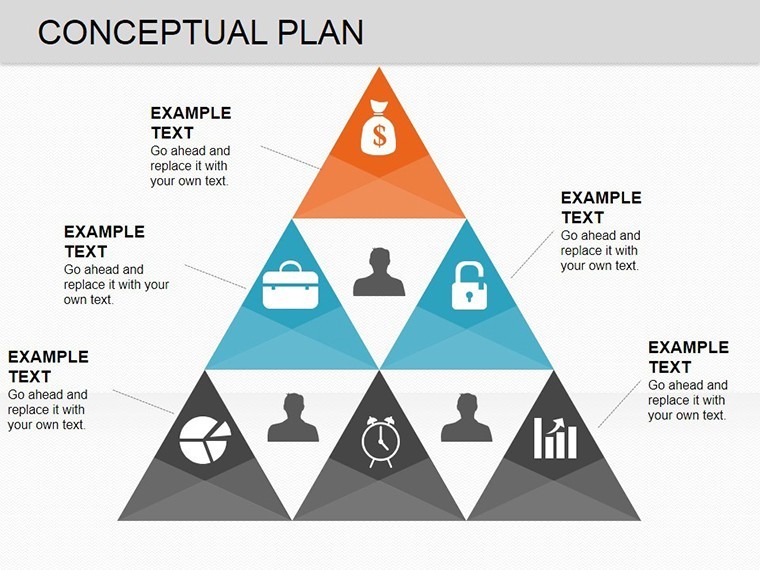
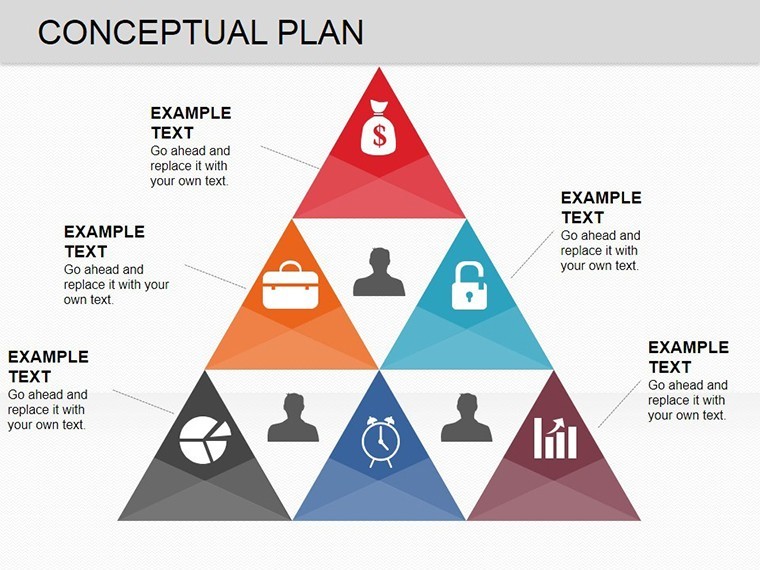
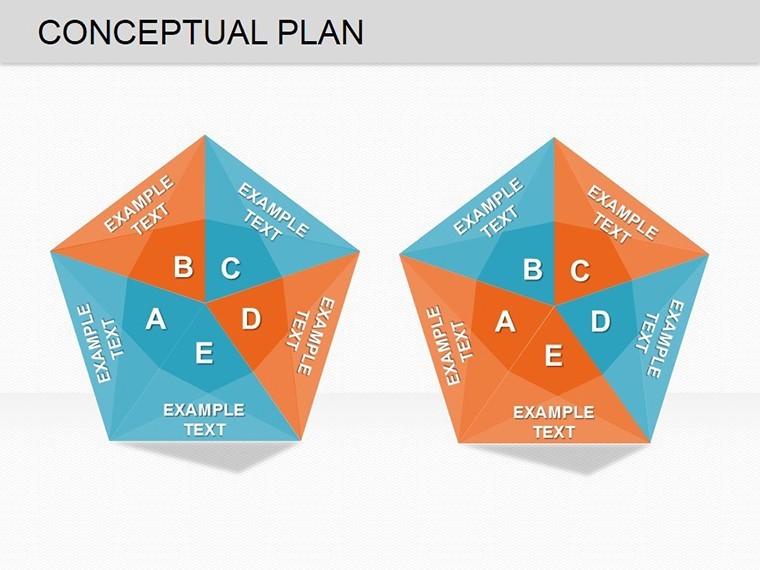
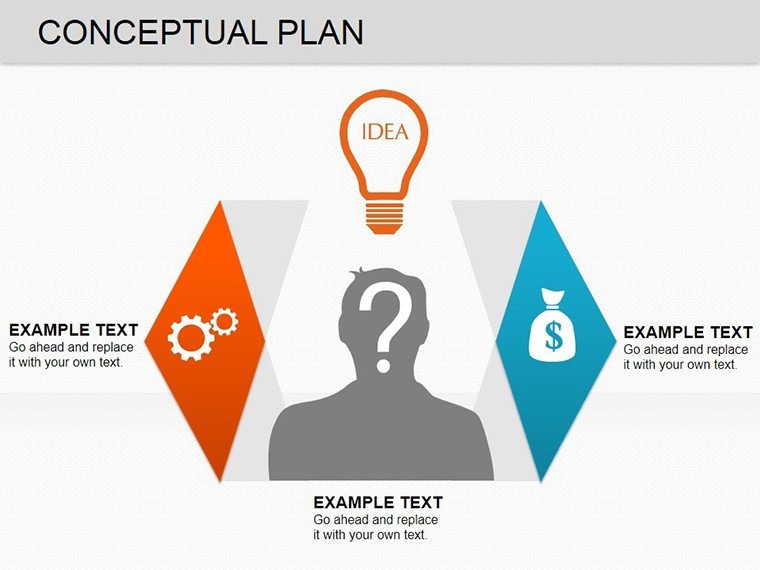
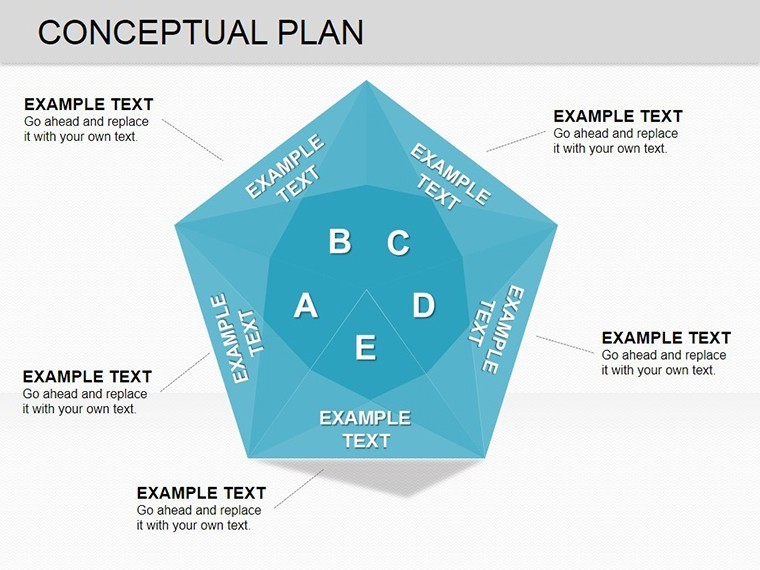
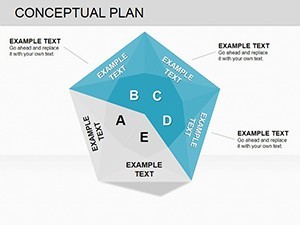
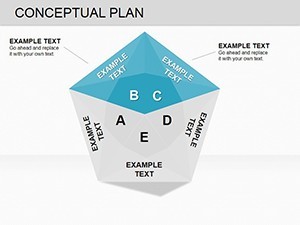
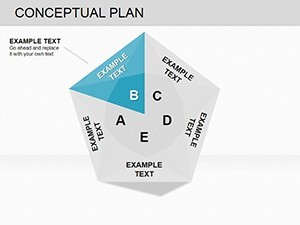
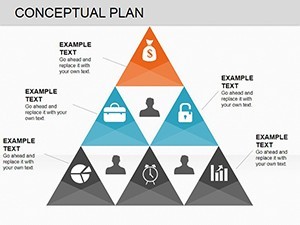
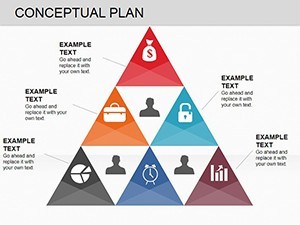
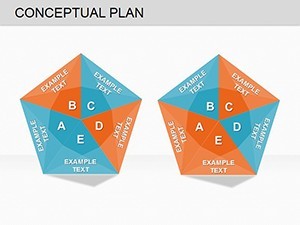
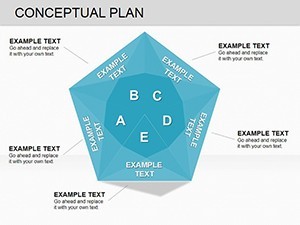
When dealing with intricate data sets, the challenge is revealing hidden connections without overwhelming your audience. Our Conceptual Plan Keynote charts template addresses this with 10 editable slides combining pyramids for hierarchies and puzzles for interrelations. Suited for planners, analysts, and creatives on Mac, it includes color variations, custom animations, vector icons, and PNGs. Fully editable, change colors, text, or photos effortlessly in iWork Keynote.
Inspired by Gestalt principles of perception, these charts help viewers see the 'whole' in data puzzles. For urban planners, assemble a pyramid of development phases, then puzzle in stakeholder inputs. This template transforms raw numbers into narrative visuals, enhancing comprehension and retention.
Highlighting Standout Features
10 slides provide a mix of pyramid builds and puzzle assemblies, all vector-based for quality.
- Pyramid Structures: Layered for hierarchical data, editable levels.
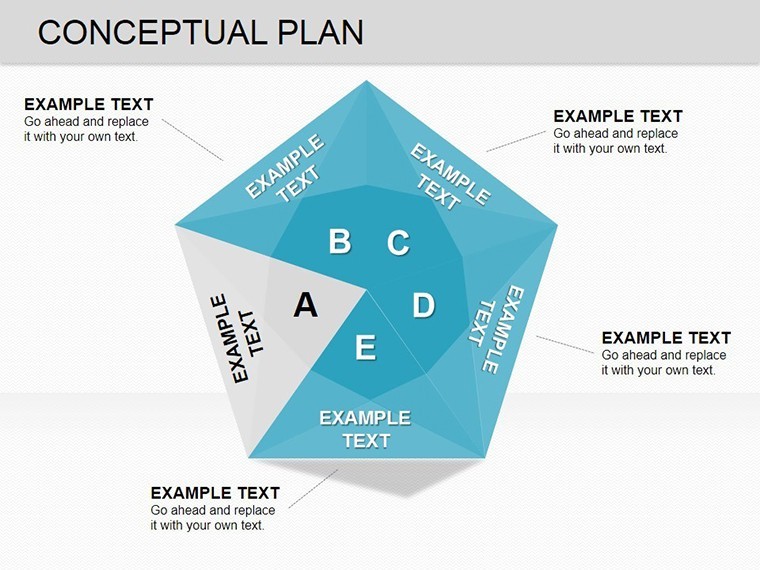
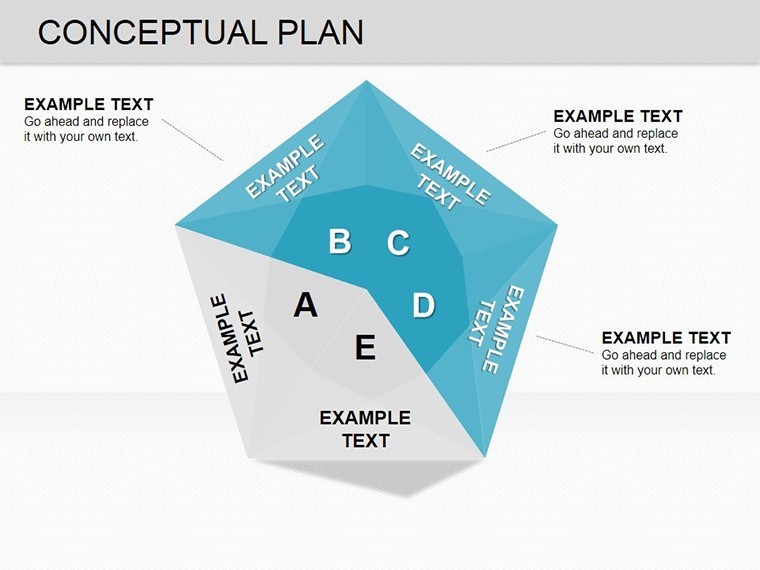
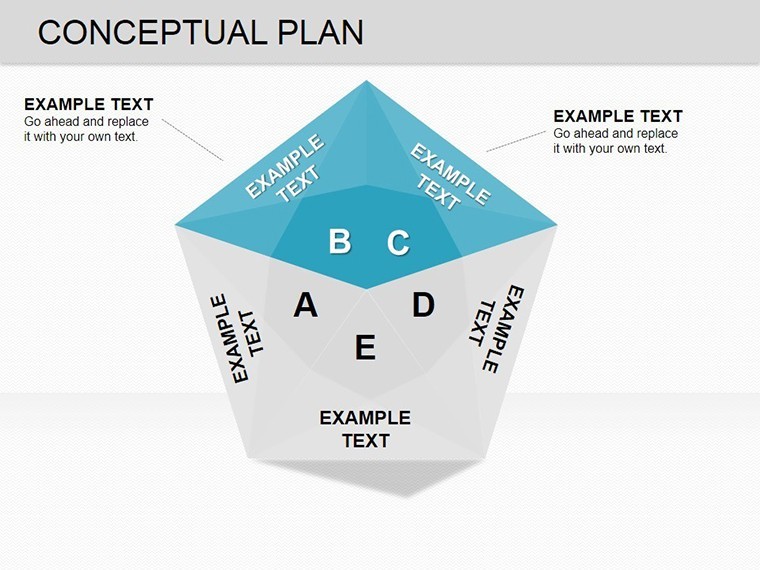
- Puzzle Pieces: Connectable shapes showing relationships.
- Animation Effects: Custom builds for piece-by-piece reveals.
- Icon Library: Vectors and PNGs for thematic enhancement.
- Edit Ease: Quick tweaks to suit any concept.
Adheres to UX design norms, ensuring intuitive navigation.
Use Cases That Fit Perfectly
Apply in varied contexts for conceptual clarity.
Strategic Frameworks
Build business models like Maslow's hierarchy in pyramid form, puzzling in market factors.
Data Analysis
Visualize correlations in large datasets, e.g., economic indicators.
Creative Brainstorming
Puzzle ideas for innovation sessions, animating connections.
Setup: Open .key, use Media pane for photos, animate via Build inspector.
Pro Tips for Conceptual Mastery
Balance colors for harmony, use animations sparingly, integrate with data tables. Outperforms basic shapes with pre-connected puzzles.
Assemble your concepts - download this template and plan with precision.
Frequently Asked Questions
How do animations work?
Pre-set custom effects; adjust in Keynote's animator.
Can I insert photos?
Yes, drag and drop into placeholders.
Icons editable?
Fully, as vectors.
File compatibility?
Mac Keynote only.
Slide variations?
Colorful options included.

