Constructor Solutions Keynote Charts: Blueprint Your Path to Project Wins


Construction isn't just about bricks and mortar - it's about constructing confidence in every stakeholder, from site foremen to C-suite funders. Our Constructor Solutions Keynote Charts template rises to that challenge, delivering 11 robust, editable slides that frame your builds with architectural acuity. Optimized for Keynote on Mac, this template channels the precision of CAD software into presentation prowess, ideal for contractors bidding on urban developments or engineers demoing sustainable structures. Say goodbye to sketchy sketches; hello to polished visuals that erect trust and topple competitors.
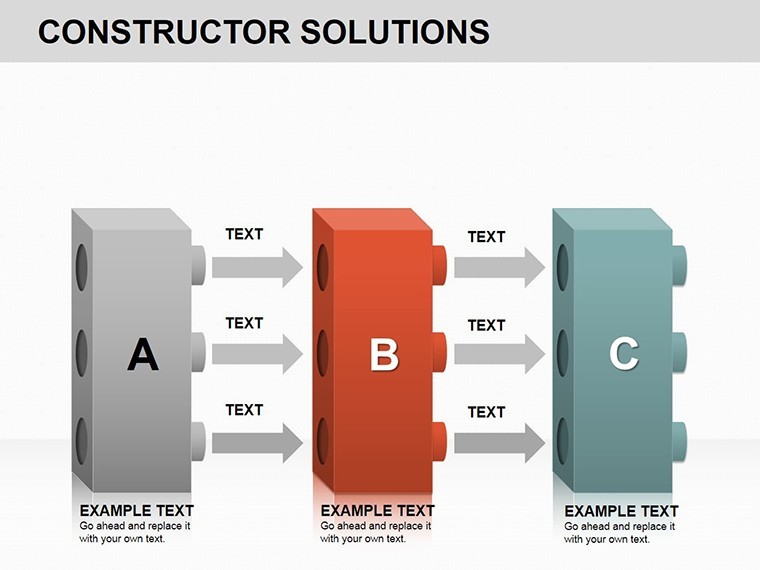
Crafted with insights from the American Institute of Architects (AIA), it emphasizes clarity in chaos - think Gantt charts that scaffold timelines or 3D cube breakdowns for material allocations. Each slide is a structural beam: load-bearing yet flexible, with drag-and-drop cubes for volumetric data and isometric views that pop in Retina displays. For firms navigating LEED certifications, these charts spotlight green metrics, turning compliance into competitive edges.
Structural Features: The Pillars of Professional Presentation
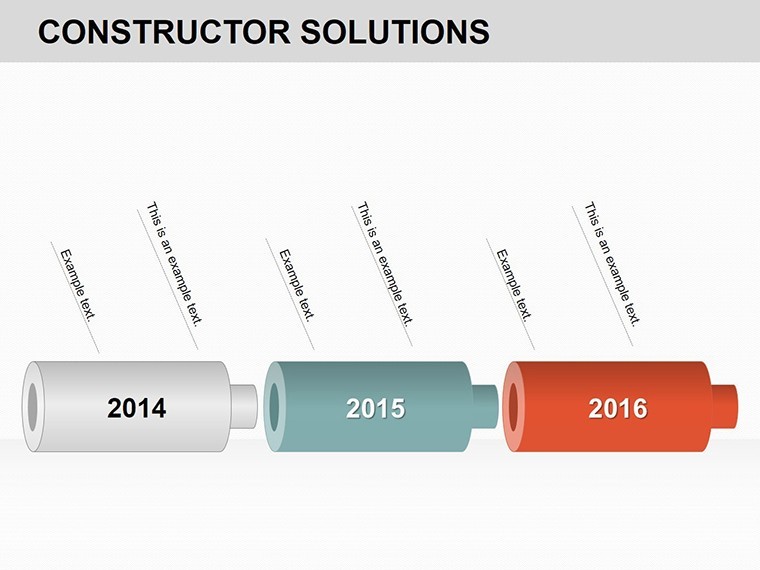
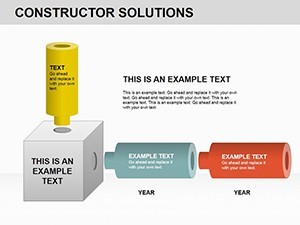
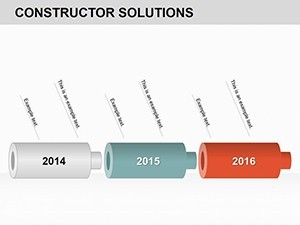
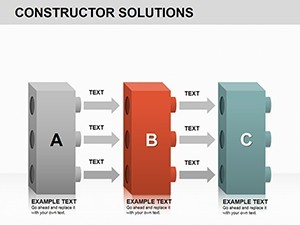
Engineered for endurance, the template's features stand tall. The Project Timeline Gantt Slide erects milestones with adjustable bars, factoring delays like weather variances for realistic forecasts. Meanwhile, the Budget Cube Breakdown stacks costs in 3D layers - demolition at base, finishes on top - revealing overruns before they foundation-crack your profits.
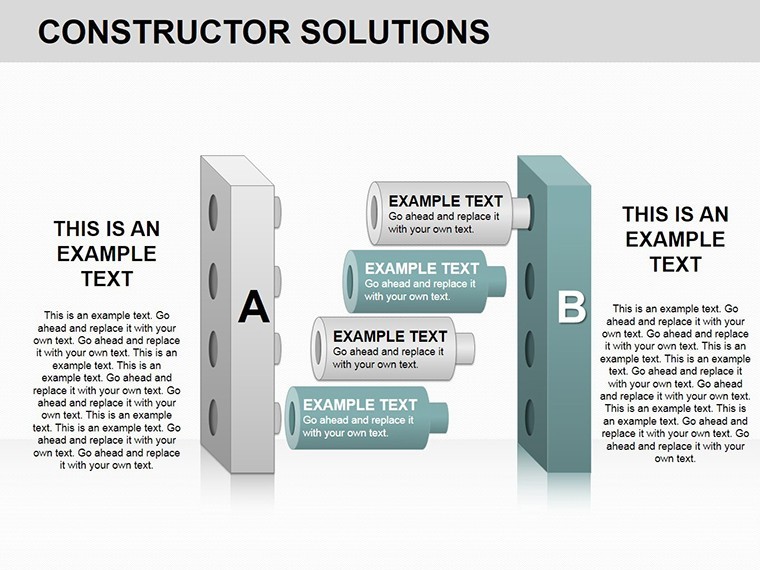
- Fully Customizable Vectors: Scale blueprints without distortion, integrating your logos seamlessly.
- 3D Isometric Projections: Rotate views for dynamic angles, enhancing spatial understanding.
- Data-Linked Graphs: Pull from Numbers spreadsheets for auto-updates, keeping bids bid-ready.
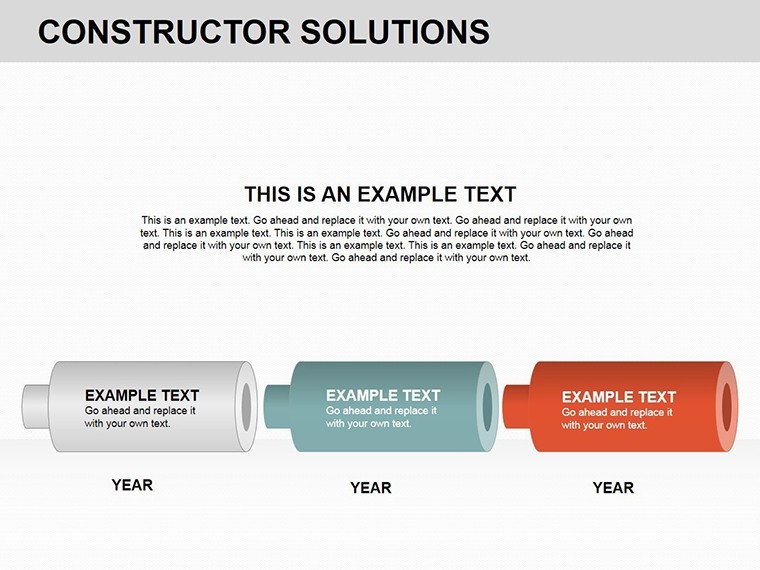
- Theme-Consistent Palettes: Earth tones and steel grays, evoking site reliability.
Seamless with Keynote 13+, it exports to interactive PDFs for client walkthroughs, bridging digital and on-site reviews.
Site-Specific Scenarios: Constructing Case Studies
Envision a high-rise developer in Manhattan. They wielded our Risk Matrix Slide to layer hazards - structural, environmental, financial - in a cube grid, mitigating a $2M delay through preemptive visuals. Echoing Turner Construction's playbook, this approach secured permits faster. For residential remodels, a boutique firm used the Resource Allocation Pie to divvy labor hours, optimizing crews and clinching a 15% under-budget finish.
In green builds, visualize carbon footprints via the Sustainability Dashboard, stacking LEED points like scaffold levels - proving ROI in energy savings that swayed eco-investors.
Foundation-to-Finish Workflow: Erect Your Deck
- Site Setup: Launch in Keynote, import site plans as backgrounds for contextual anchoring.
- Frame Data: Input specs into cubes - e.g., 10,000 sq ft of concrete - watching auto-renders build.
- Reinforce Narrative: Add callouts for variances, like "Phase 2: +5% for seismic upgrades."
- Inspect Interactivity: Test rotations and zooms, ensuring smooth navigation on touch devices.
- Pour and Share: Output to video for virtual tours, solidifying remote approvals.
This build sequence fortifies efficiency, surpassing AutoCAD exports that Keynote renders clunkily.
Head-to-Head: Why This Outbuilds Basics
Generic charts collapse under pressure; ours reinforce with depth. Forums like ArchDaily hail 3D integrations for 45% better comprehension in bids. At $22, it's foundational value for towering results.
Build Tip: Embed drone footage hyperlinks in timeline nodes for immersive site flies - elevating pitches sky-high.
Industry Blueprints: Charting Construction's Future
With McKinsey eyeing $1.6T in digital transformation by 2025, visuals like these digitize decisions. For AIA-compliant decks, layer RFI logs into flowcharts, streamlining subs. Inspired by Zaha Hadid's parametric flair, our cubes twist data into innovative forms, fostering "aha" moments in feasibility studies.
Adhering to data viz bests from "The Visual Display of Quantitative Information," minimize clutter for maximal impact. Your turn: Download Constructor Solutions Keynote Charts today and lay the groundwork for groundbreaking presentations.
Frequently Asked Questions
How customizable are the 3D elements in this template?
Totally - rotate, resize, and recolor cubes independently, with smart guides for precise alignments.
Is it geared toward specific construction phases?
Versatile across pre-con, execution, and closeout; tweak for bids or progress reports.
Supports integration with project management tools?
Yes, link to Procore or MS Project via CSV for synced updates.
Best for solo contractors or large firms?
Scales beautifully; solos love simplicity, firms appreciate collaboration embeds.
Export options for non-Mac users?
PDF or PPT exports preserve 90% fidelity, with notes on animation trade-offs.
How does it aid in winning bids?
By clarifying scopes visually, reducing ambiguities that cost 20% of disputes per AGC stats.