Polygon Market Analysis Charts Keynote Template


Type: Keynote Charts template
Category: Matrix
Sources Available: .key
Product ID: KC00189
Template incl.: 19 editable slides
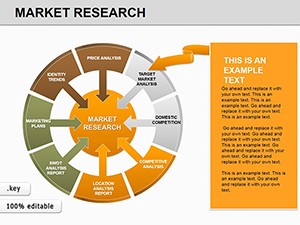
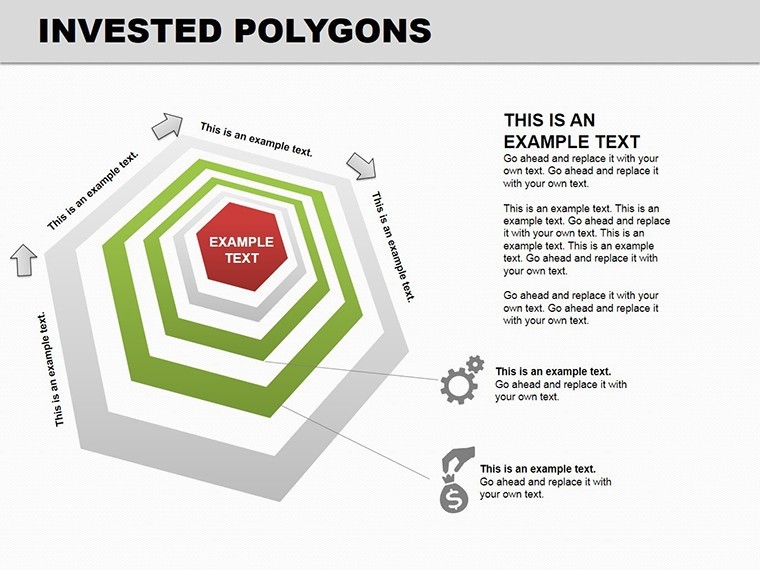
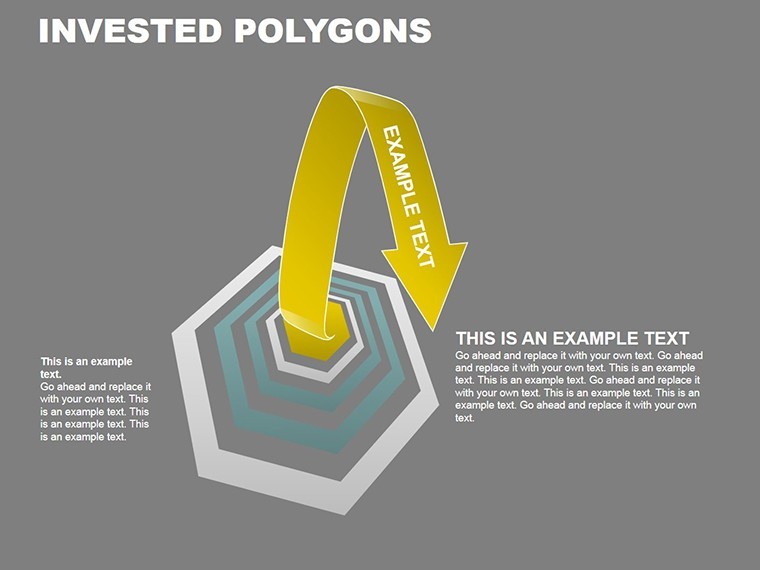
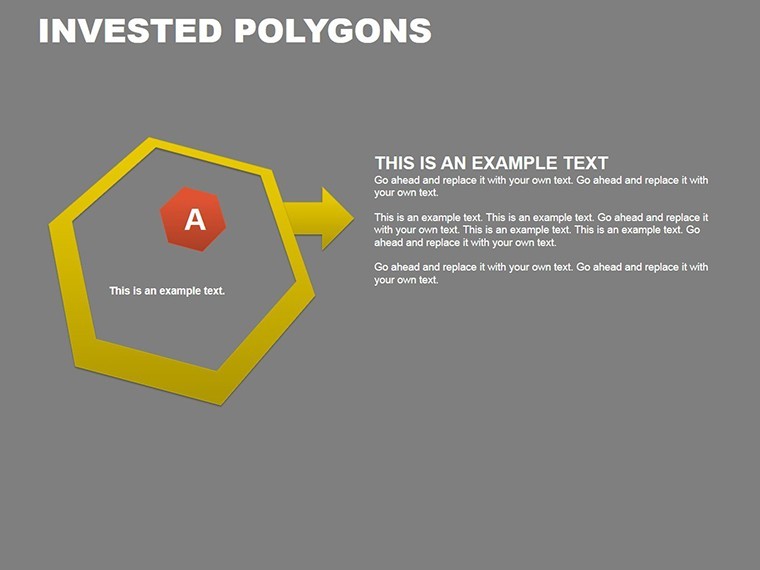
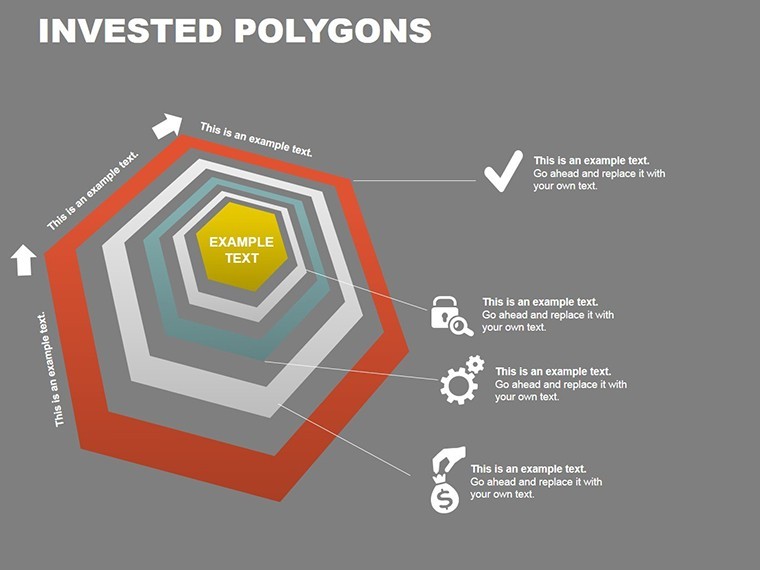
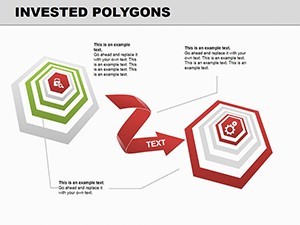
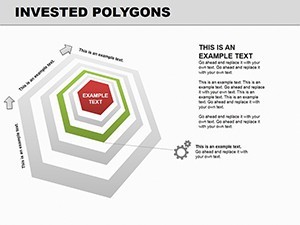
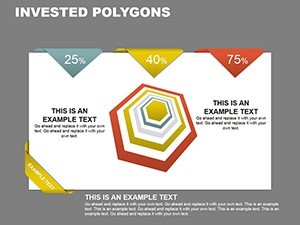
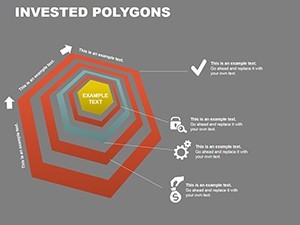
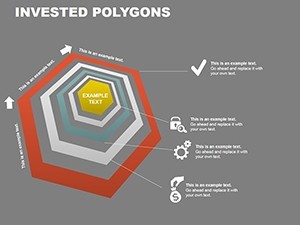
Decode the multifaceted landscape of markets with geometric elegance using the Polygon Market Analysis Charts Keynote Template. Geared toward analysts, design consultants, and architecture strategists navigating investments and trends, this 19-slide suite employs radar-style polygons to dissect variables like shareholder equity, asset acquisitions, and competitive positioning. Visualize a portfolio review where polygonal webs radiate factors - cost, sustainability, scalability - revealing strengths at a glance for smarter bids on landmark developments.
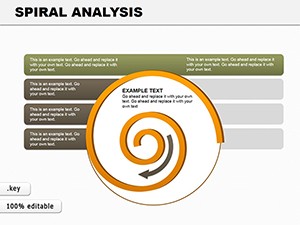
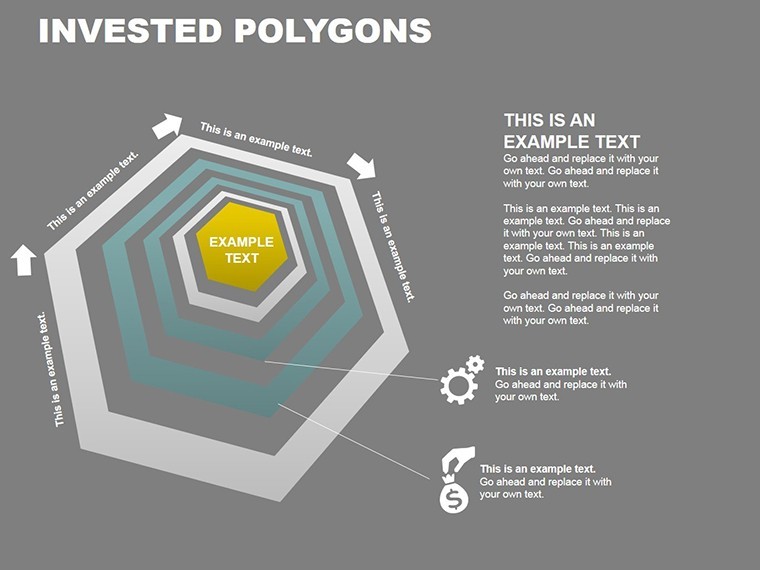
Market analysis in design isn't linear; it's a web of influences, from creditor funds to raw material volatility. This template, inspired by Six Sigma's spider charts for multivariate breakdowns, captures that complexity in editable polygons that stretch and morph without losing integrity. Keynote-optimized with cross-platform exports, it empowers you to integrate photos, videos, and animations, turning static data into immersive stories. For firms eyeing expansion, it's the tool to quantify "total investment pools" into actionable insights.
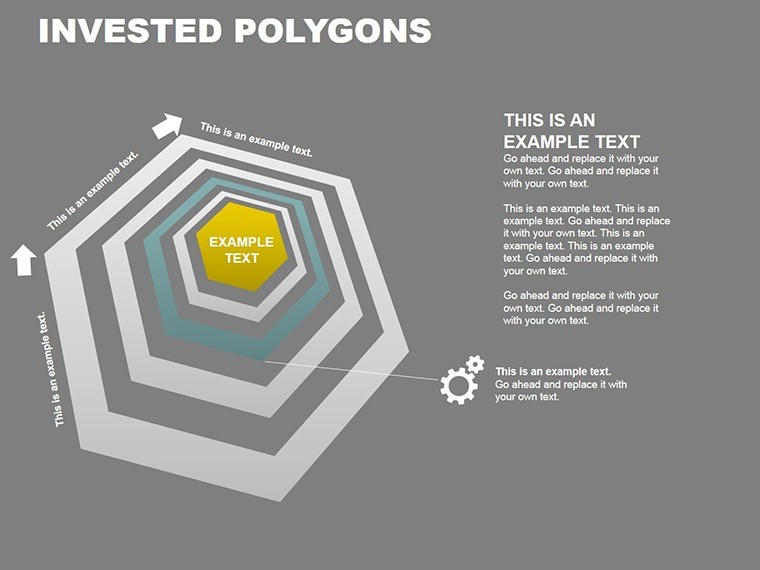
Why polygons? They excel at multi-axis comparisons, per Datylon's 80 chart types, spotlighting imbalances like over-reliance on imported goods. Our design adds professional animations - polygons filling like rising markets - making your analyses not just informative, but influential. Whether for internal audits or client deep-dives, this template bridges numbers and narratives seamlessly.
Standout Features for Sharp Insights
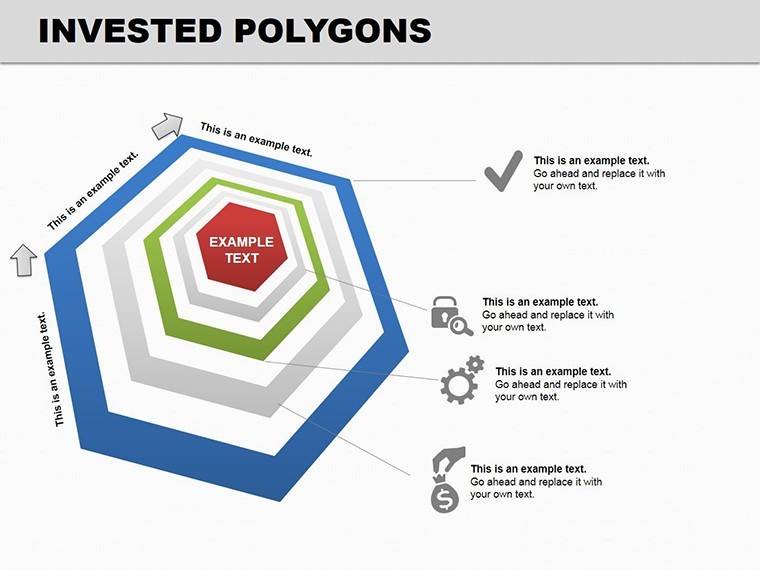
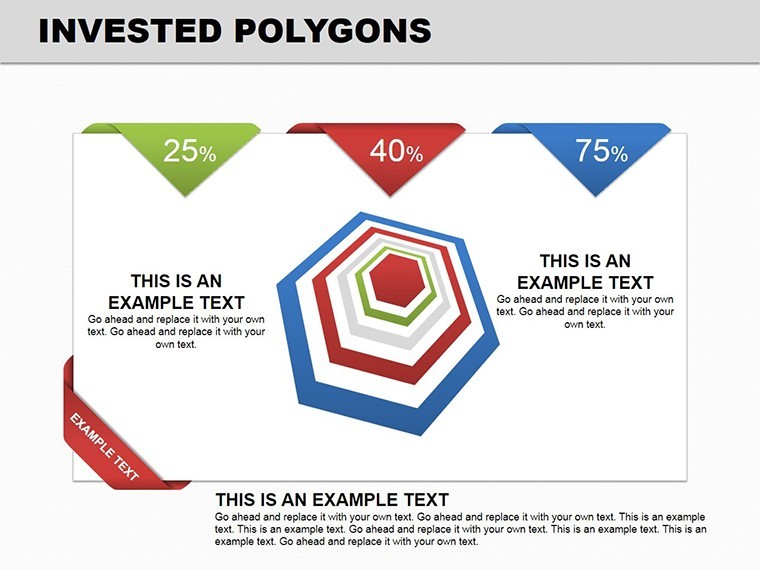
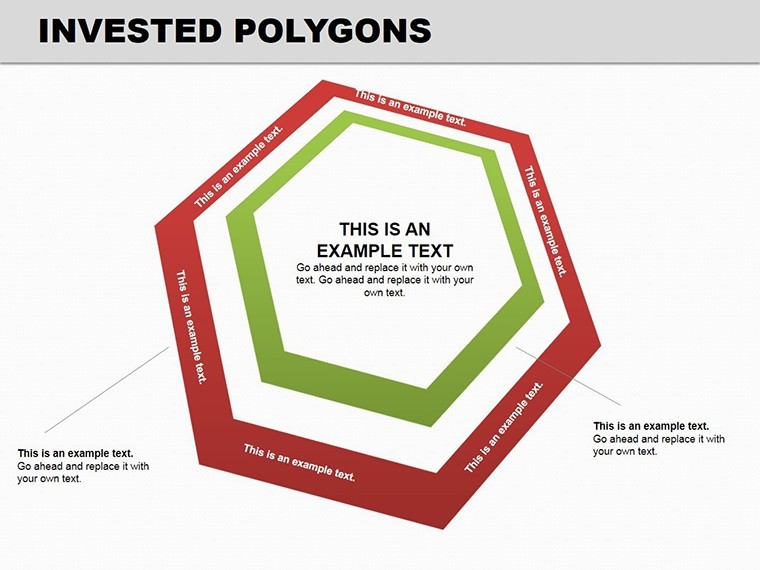
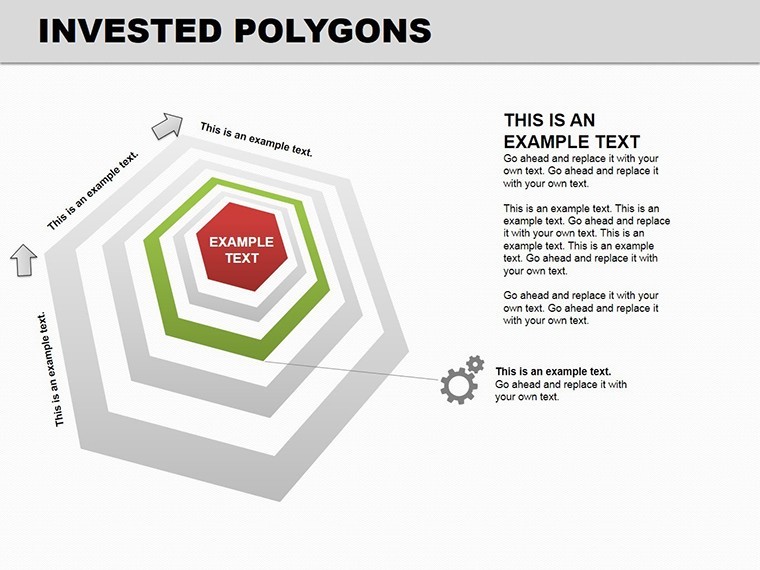
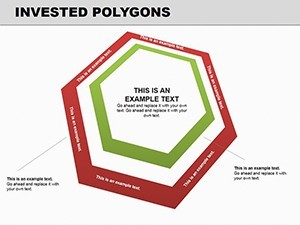
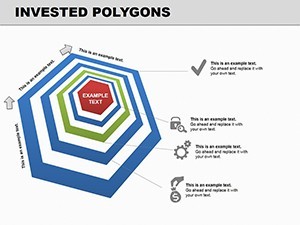
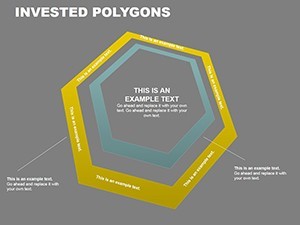
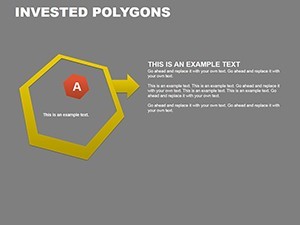
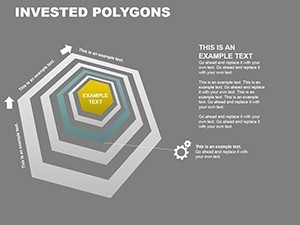
Central to the template is its polygon versatility, starting with basic triangles on Slide 0 for tri-factor overviews, scaling to hexagons for comprehensive scans. Vectors ensure crisp edits, while matrix category links expand to grid hybrids.
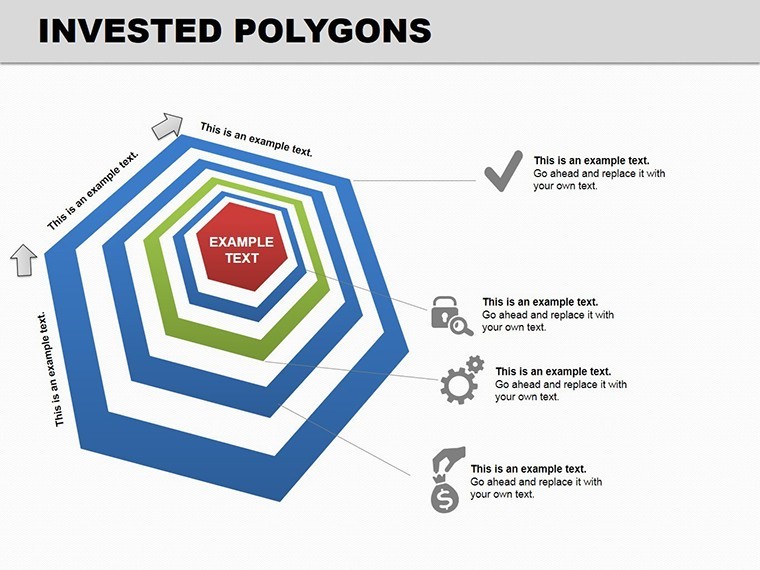
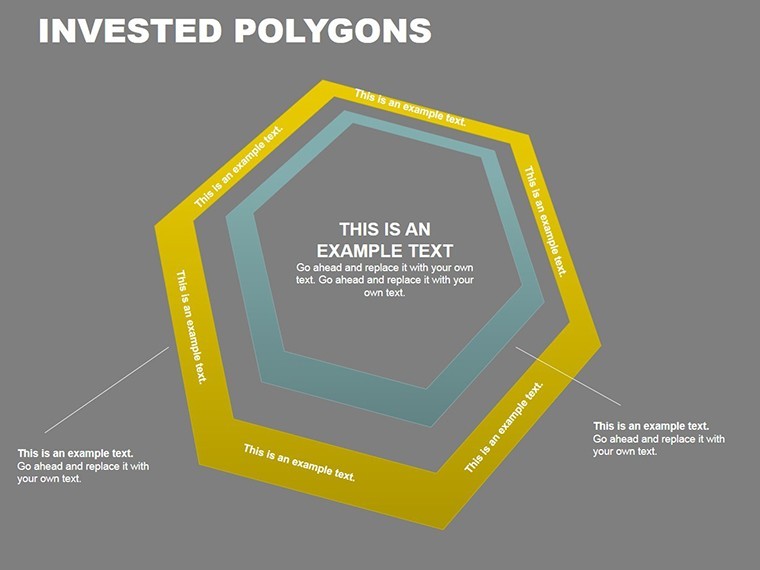
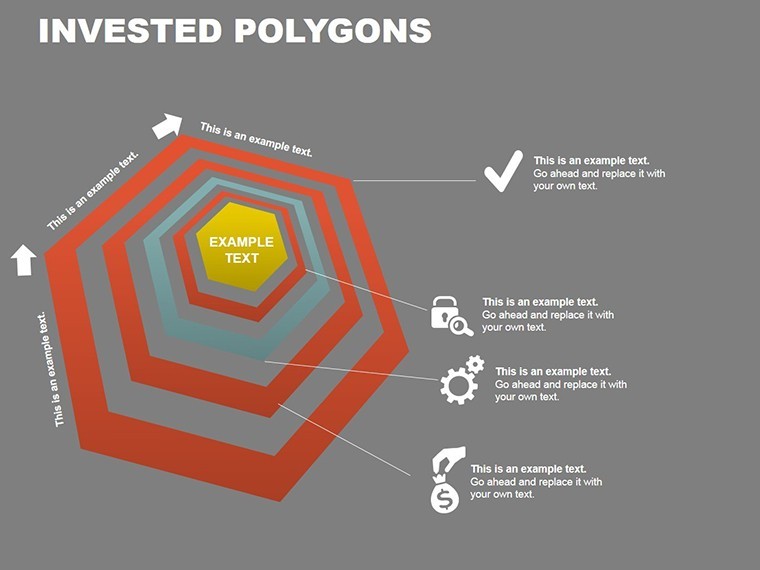
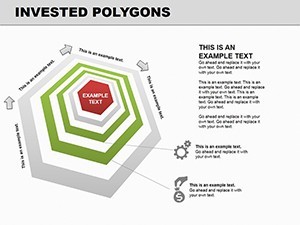
- Multi-Axis Polygons: Plot up to 8 dimensions, like ROI, risk, and innovation scores.
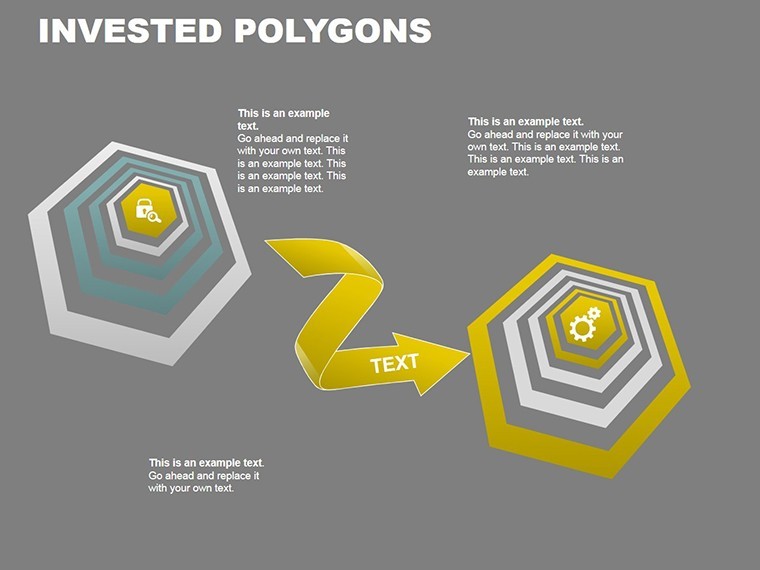
- Editable Overlays: Layer data sets for comparisons, e.g., current vs. projected markets.
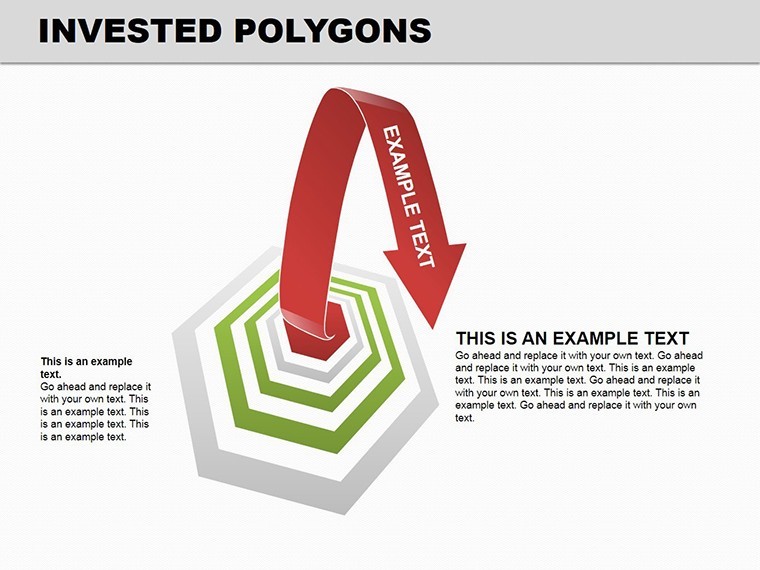
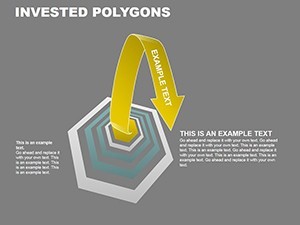
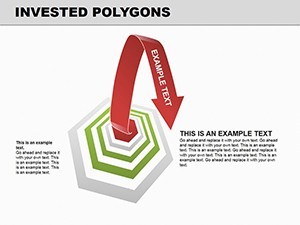
- Animation Effects: Polygons expand on entry, emphasizing key vertices.
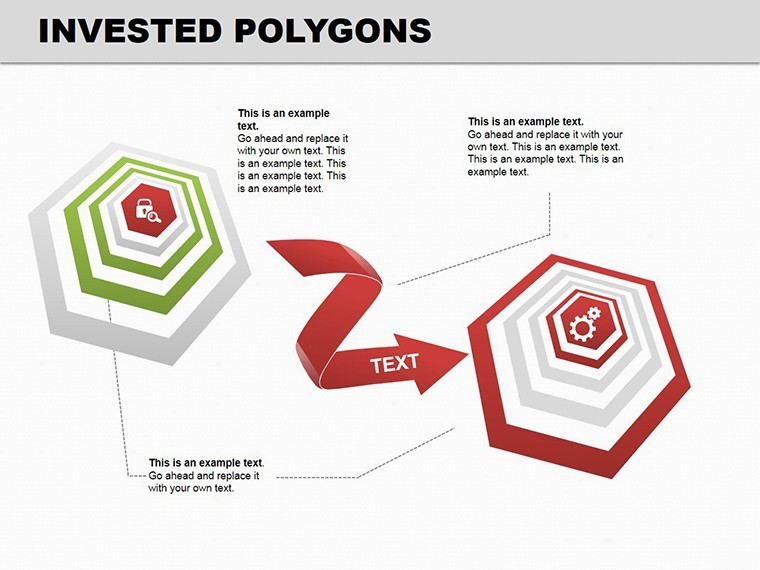
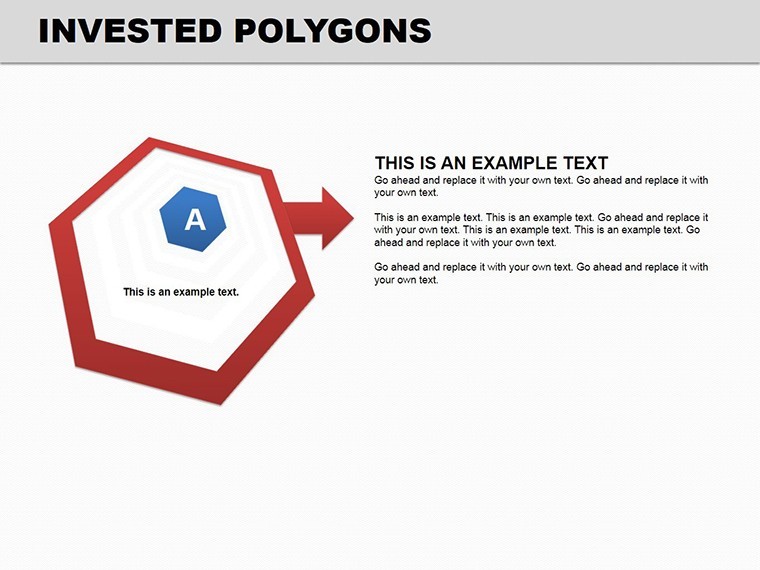
- Media Integration: Embed assets directly into nodes for enriched context.
- Widescreen Vectors: Scalable without blur, fitting any canvas.
These elements, drawn from Highcharts' polygon guides, deliver modern, creative designs that resonate in boardrooms.
Industry Applications: Polygons in Design Dynamics
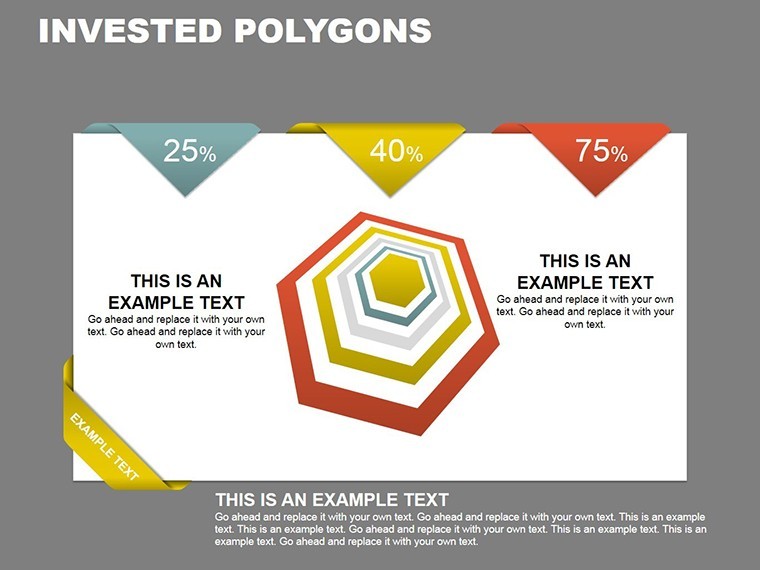
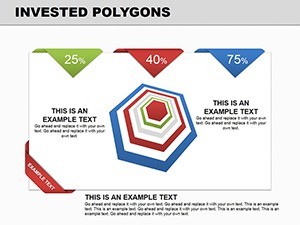
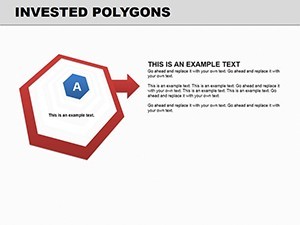
In the design sector, polygons shine for holistic evaluations. Shutterstock's polygon visuals aid marketing breakdowns; adapt Slide 7 for segmenting client types - residential 40%, commercial 60% - highlighting revenue polygons. For architecture, map investment pools: Borrowed funds for equipment vs. equity for R&D, as per template concepts.
6Sigma.us's spider chart focus reveals multivariate dissection; use Slide 13 for competitor analysis, plotting speed-to-market axes. A case: Firms analyzing sustainable trends via polygons identified 20% cost savings in green materials. Datylon examples extend to product knowledge shares - visualize idea viability in pitches, turning abstract experiences into polygonal proofs.
For entrepreneurs, Slides 16-18's advanced webs forecast creditor impacts on builds, fostering data-driven pivots. Real pros use these for L&D alignments, per Watershed parallels, ensuring teams grasp market nuances.
Customize with Confidence: Step-by-Step
Effortless editing awaits. Step 1: Open .key file. Step 2: Select polygon, adjust vertices via data inputs. Step 3: Color-code axes for themes. Step 4: Animate fills for emphasis. Step 5: Add transitions for narrative flow. Pro hack: Stretch for irregular markets, maintaining proportions.
- Compile variables from reports.
- Scale axes uniformly for fairness.
- Annotate peaks with insights.
- Test on varied screens.
Surpasses basic radars - our polygons integrate media, elevating from charts to experiences.
Elevate Analysis with Polygon Precision
This template's prowess? Comprehensive yet accessible multivariate views, boosting decisions per industry standards. Gains: Deeper stakeholder understanding, per Shutterstock apps; credible forecasts; and visually compelling reports. In design, where markets shape visions, it's transformative - like a prism refracting opportunities.
Quip: Polygons prove markets aren't flat - they're full of angles worth exploring! Analysts report 25% faster insights; join them. Download the Polygon Market Analysis Charts Template now and polygon-ize your path to prosperity.
Frequently Asked Questions
What are polygon charts best for in market analysis?
Comparing multiple variables radially, like strengths across dimensions in competitive landscapes.
Can I modify the number of sides in polygons?
Yes, easily adjust from triangles to octagons in Keynote for tailored data sets.
Does the template support video embeds?
Indeed - add clips to nodes for dynamic, multimedia-enhanced analyses.
How editable are the animations?
Fully customizable timings and effects to sync with your presentation rhythm.
Is it geared toward the design industry?
Yes, with examples for investments and trends relevant to architecture and creative fields.