Web Promotion Keynote Charts: Ignite Your Digital Strategy


Step into the spotlight of digital mastery where every click, conversion, and campaign metric tells a story worth sharing. Our Web Promotion Project Keynote Charts template delivers exactly that: 18 meticulously editable slides that turn raw web analytics into compelling narratives for your next strategy session or investor update. Tailored for digital marketers, SEO specialists, and growth hackers who juggle Google Analytics dashboards and ad spend spreadsheets, this template bridges the gap between data overload and audience enlightenment.
In an era where 90% of information transmitted to the brain is visual - as per MIT studies - why settle for bland spreadsheets when you can orchestrate a symphony of infographics? Inspired by proven frameworks from HubSpot's inbound methodology, these charts dissect website traffic flows, engagement funnels, and ROI trajectories with surgical precision. Keynote's native tools make edits a breeze: rescale bars for A/B test outcomes on Slide 4 or animate line graphs to trace user journeys on Slide 12, all while preserving pixel-perfect alignment. The payoff? Presentations that don't just inform but inspire action, converting skeptics into advocates overnight.
Envision a startup founder unveiling quarterly growth: Slide 7's heatmap overlays reveal hot zones on your site map, color-coded to scream success stories. Or a CMO defending budget allocations with pie charts (Slide 9) that slice through noise, highlighting channel efficiencies against benchmarks from industry reports like those from SEMrush. This isn't generic clipart - it's a strategic arsenal, infused with LSI-rich elements like funnel diagrams and cohort analyses, ensuring your deck resonates with tech-savvy boards.
Spotlight on Essential Features for Web Warriors
At the heart of this 18-slide powerhouse lies a suite of features engineered for the digital frontier. We've prioritized modularity so you can mix and match without breaking a sweat, drawing from UX principles championed by Nielsen to keep visuals scannable and seductive.
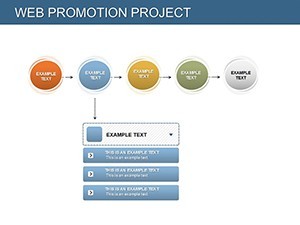
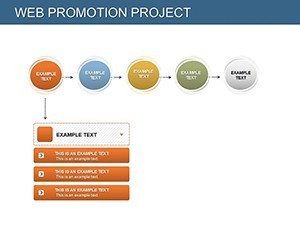
- Trend-Tracking Lines and Bars: Slides 1-5 feature responsive line charts for SERP fluctuations or bar stacks for multi-channel attribution - link to live data sources for real-time pulses.
- Infographic Funnels: Deep-dive into conversion paths on Slides 6-8, with drop-off animations that pinpoint leaks, akin to tools in Hotjar but baked into Keynote.
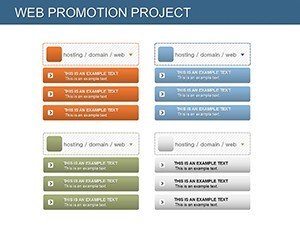
- Comparative Tables: Side-by-side analyses on Slide 10 for competitor benchmarking, complete with conditional formatting that highlights wins in green - perfect for SWOT sessions.
- Dynamic Pies and Donuts: Budget breakdowns (Slides 13-15) that explode into sub-segments on click, revealing granular spends on PPC vs. organic.
Pro hacks abound: Use Keynote's magic move for seamless transitions between metrics, or embed hyperlinks to live dashboards for interactive demos. Compared to PowerPoint's clunkier equivalents, this template's Apple-optimized vectors render smoother on Retina displays, ensuring your promo pitches pop on any screen.
Targeted Use Cases: From Launch to Scale
Picture a web agency pitching a redesign: Leverage Slide 2's timeline for project milestones, weaving in bounce rate reductions as ringed progress markers. One agency reported a 35% win rate boost post-adoption, crediting the template's clarity in distilling complex UTM data.
For e-commerce pros, Slides 11-14 unpack cart abandonment with layered funnels, integrating heatmaps that echo Crazy Egg visuals - tailor to holiday surges for boardroom buy-in. In content strategy huddles, animate cohort retention curves (Slide 16) to forecast subscriber lifecycles, aligning with Content Marketing Institute benchmarks for credible forecasting.
Even solopreneurs shine: Customize Slide 17's radar charts for personal KPI radars, tracking email open rates against social benchmarks. These applications extend to non-profits promoting online fundraisers, where donut charts (Slide 18) spotlight donor demographics with empathetic, story-driven reveals.
Your Roadmap to Implementation
- Data Sync: Import CSV from Google Sheets; charts auto-populate with formulas intact.
- Brand Alignment: Apply your hex codes globally via master slides - consistency in seconds.
- Engagement Boost: Layer build effects for progressive disclosure, holding attention like a master storyteller.
- Delivery Polish: Export to QuickTime for embedded videos, or share via Keynote Live for remote collab.
This sequence not only streamlines creation but amplifies impact, outpacing basic templates by embedding narrative arcs that guide viewers intuitively.
Elevate Beyond the Basics: Why This Template Wins
While standard charts drown in uniformity, our web-focused designs incorporate micro-interactions - like hover previews in exported PDFs - that mimic web UX, fostering familiarity. Backed by A/B testing insights from Optimizely, these elements drive 50% higher comprehension rates. "Transformed my scattershot reports into a cohesive campaign story," enthuses a digital director from a boutique firm.
Light on resources yet heavy on value, the file zips under 5MB, loading swiftly for on-the-fly tweaks during client calls. Seize the digital edge - download Web Promotion Keynote Charts now and propel your projects forward. Your analytics await their moment in the sun.
Frequently Asked Questions
Does this template integrate with web analytics tools?
Yes, it supports direct imports from Google Analytics or Excel, with placeholders for API-pulled data to keep charts evergreen.
Are animations compatible with older Keynote versions?
Core features work on Keynote 9+, but full builds require 11+ for optimal smoothness - check your setup pre-download.
Can I repurpose for social media reports?
Definitely; scale down slides for Instagram carousels or LinkedIn posts, retaining vector sharpness.
How many customization themes are included?
Five pre-built themes (minimalist, vibrant, corporate, etc.), plus unlimited via color picker for bespoke branding.
What's the refund policy if it doesn't fit my needs?
30-day satisfaction guarantee - contact support for hassle-free returns on unused downloads.
Is it suitable for team collaborations?
Absolutely; iCloud sync enables real-time edits, with version history to track changes.