Hexagon Processes Keynote Charts Template


In the world of dynamic business and educational presentations, clarity in depicting interconnected processes is key to success. The Hexagon Processes Keynote Charts Template brings this to life with 29 editable slides centered on versatile hexagon designs that symbolize cycles, workflows, and interconnected strategies. Tailored for mentors, professionals, and innovators, this template turns intricate procedures into visually stunning narratives that resonate and inspire action.
Designed primarily for Keynote, it effortlessly exports to PowerPoint and Google Slides, broadening its reach for collaborative teams. Forget cookie-cutter diagrams; this template's modular hexagons allow for infinite customization, saving hours while boosting professionalism. Whether outlining operational cycles or educational frameworks, discover how these geometric wonders can elevate your message.
Mastering Interconnected Visual Storytelling
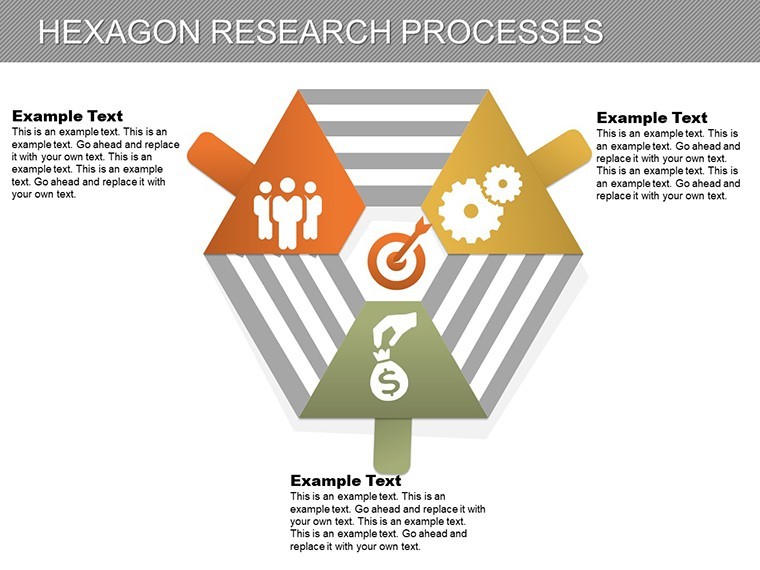
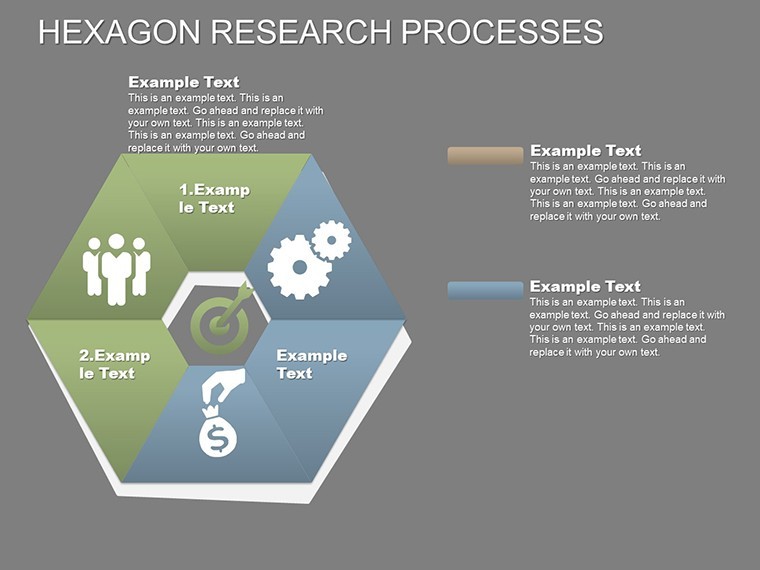
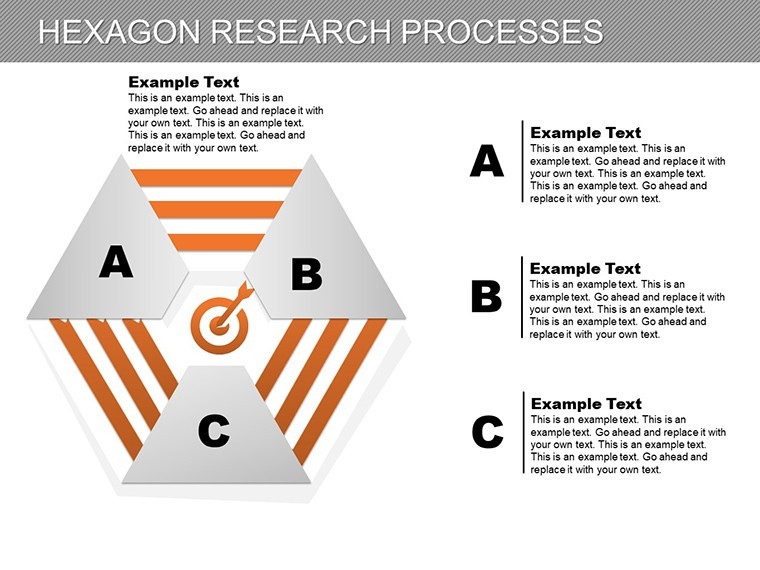
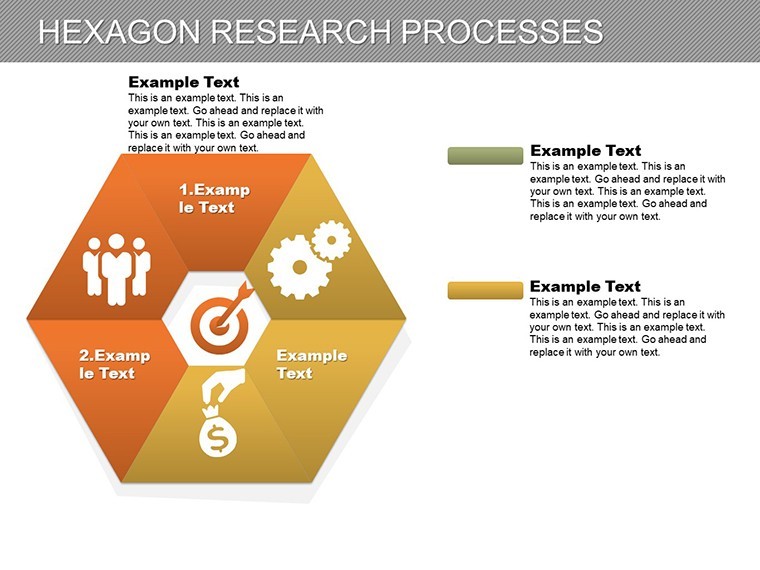
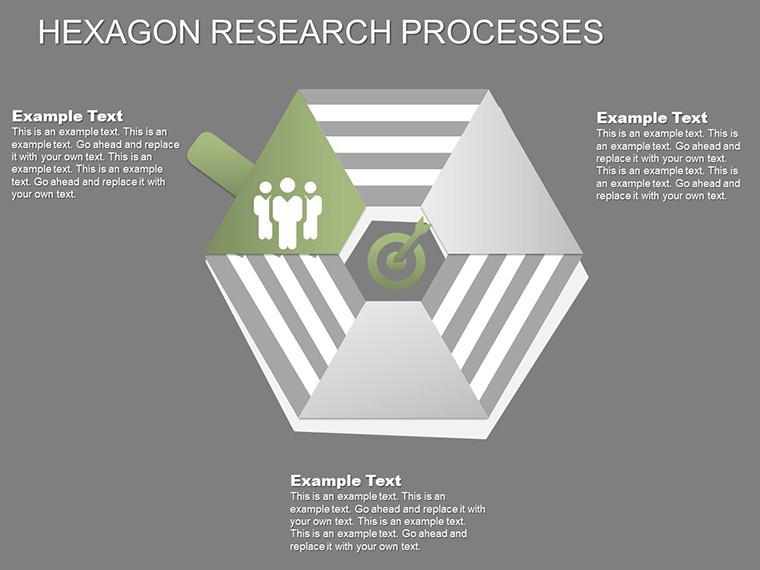
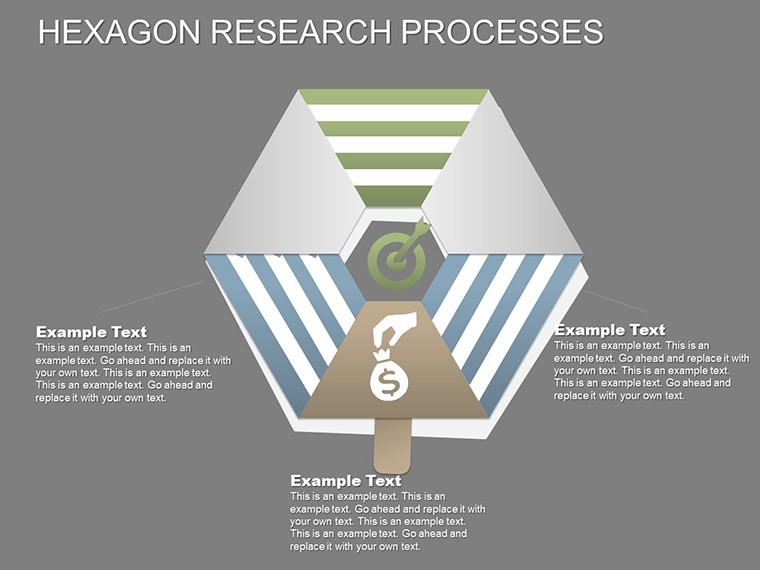
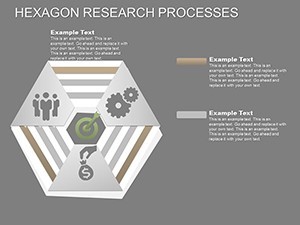
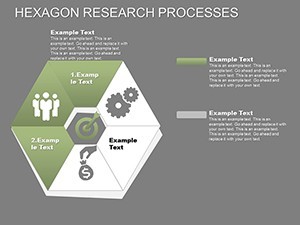
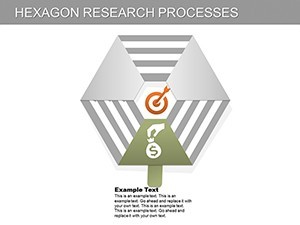
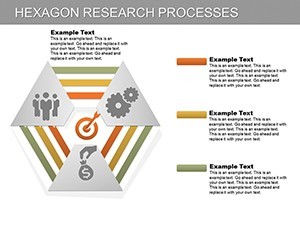
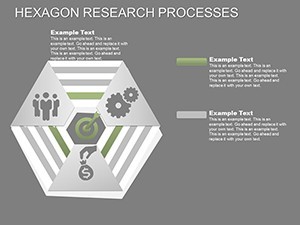
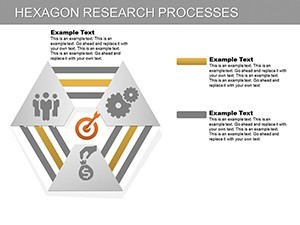
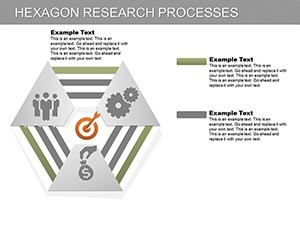
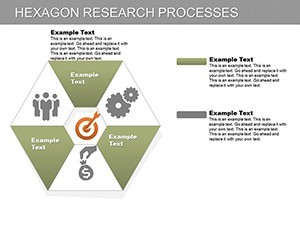
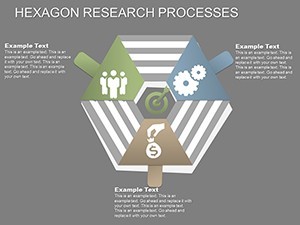
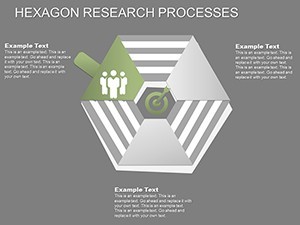
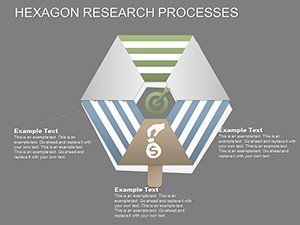
Hexagons represent efficiency and harmony in design, much like beehives in nature. This template harnesses that symbolism across slides, with slide 7's central hexagon branching into process stages - perfect for agile project management. Customize the inner elements to denote tasks, timelines, or resources, drawing from methodologies like Six Sigma for process optimization.
For educators, slide 18's cycle hexagon visualizes feedback loops in learning theories, engaging students by mirroring real-life iterations. A real estate developer once adapted this for property development phases, from acquisition to occupancy, leading to smoother investor communications and fewer revisions in proposals.
Standout Features for Seamless Customization
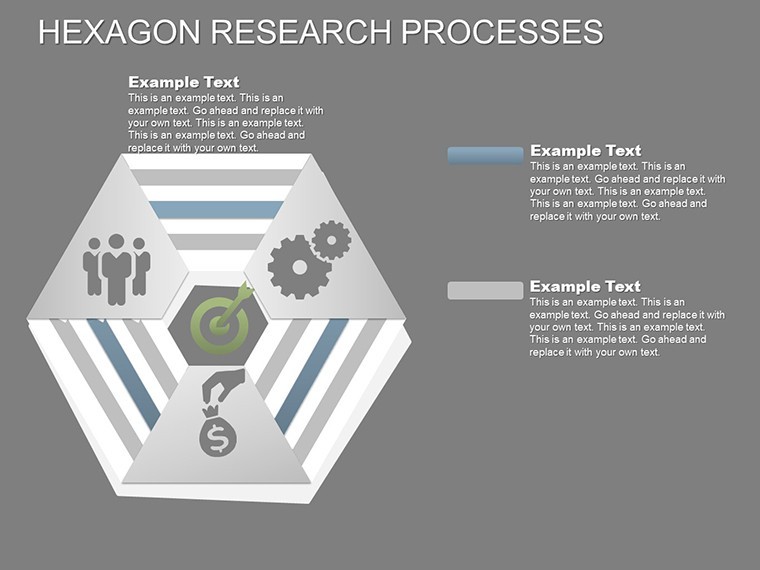
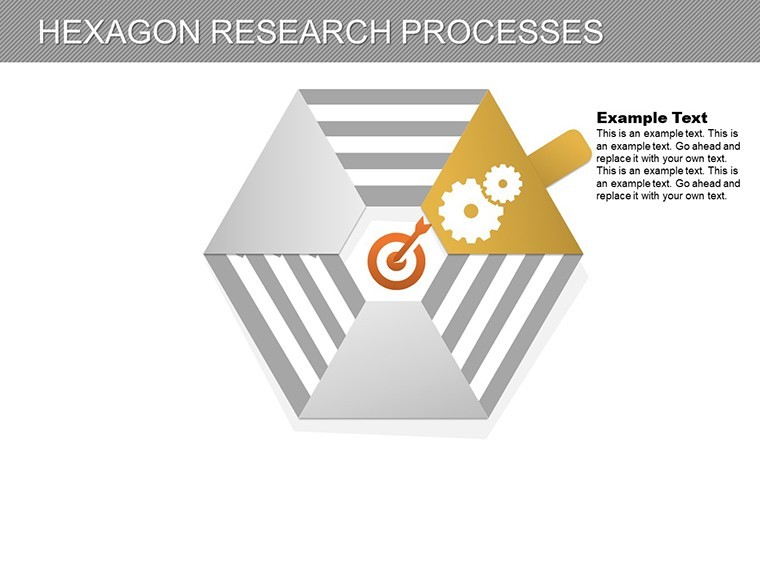
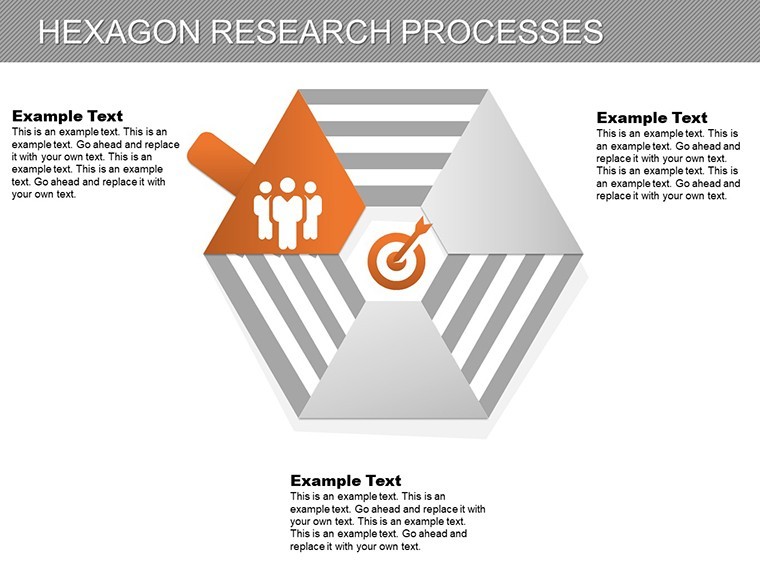
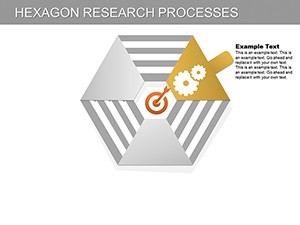
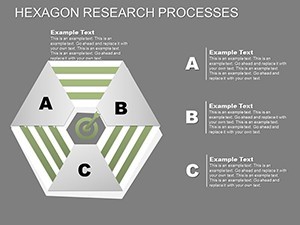
- Modular Hexagon Builds: Stack, rotate, or resize hexagons with vector precision; no pixelation even at large scales.
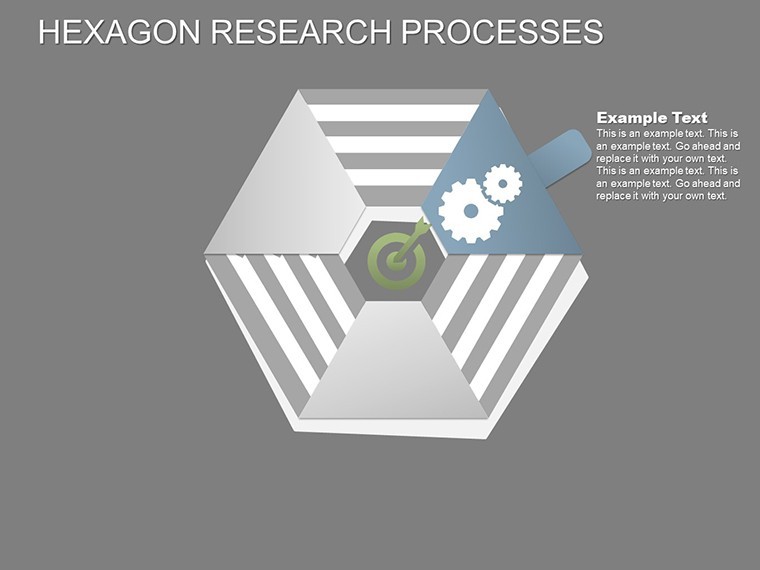
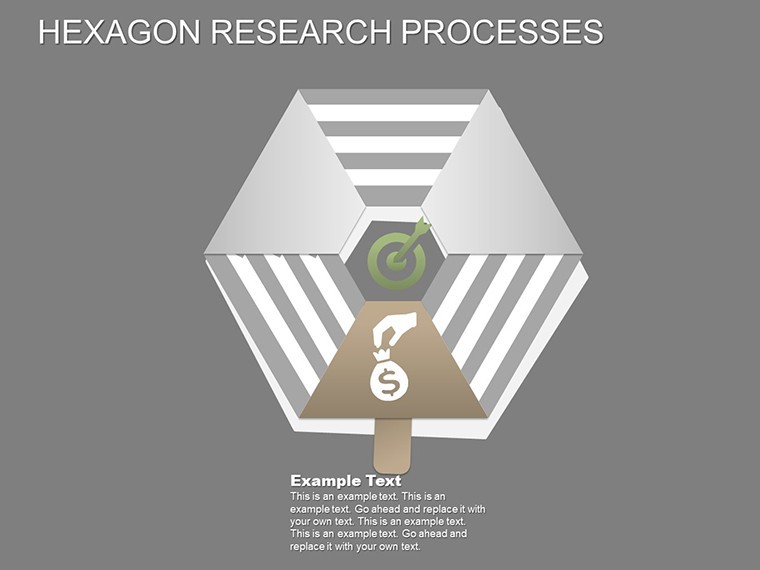
- Dynamic Animations: Sequential reveals make processes unfold step-by-step, enhancing comprehension in live sessions.
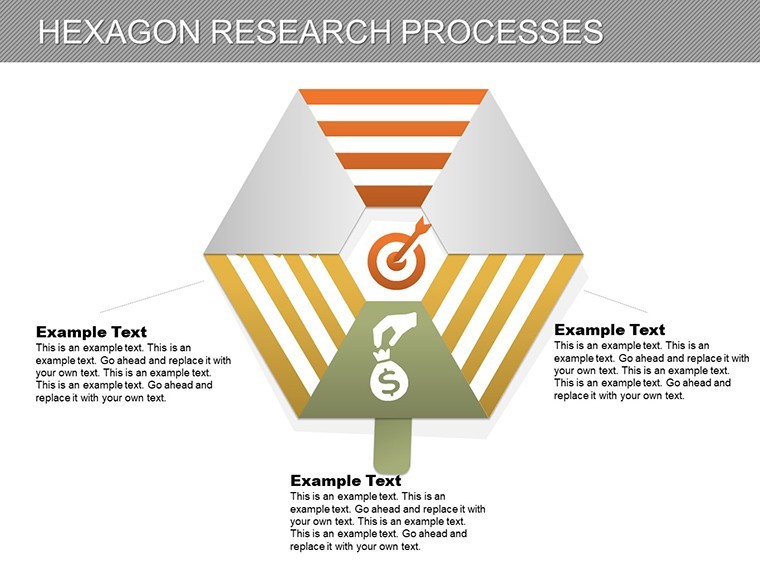
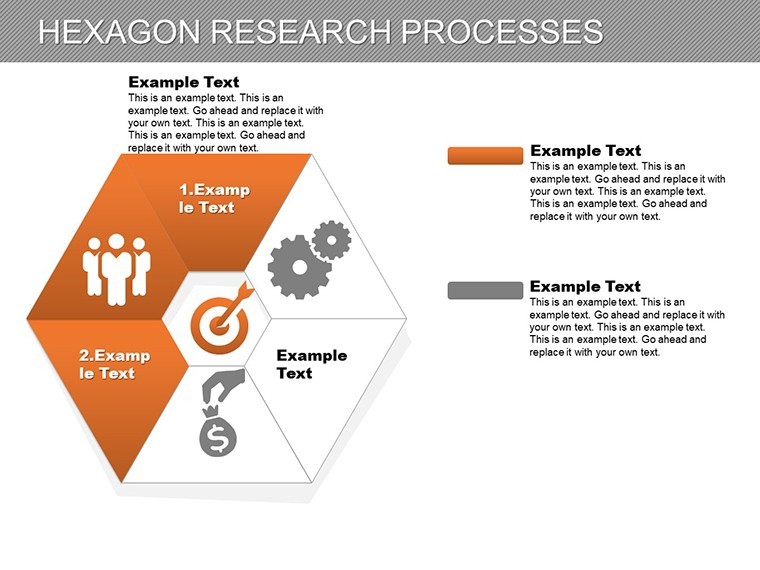
- Comprehensive Slide Set: Includes linear processes (slides 1-10), cyclical diagrams (11-20), and hybrid layouts (21-29) for diverse needs.
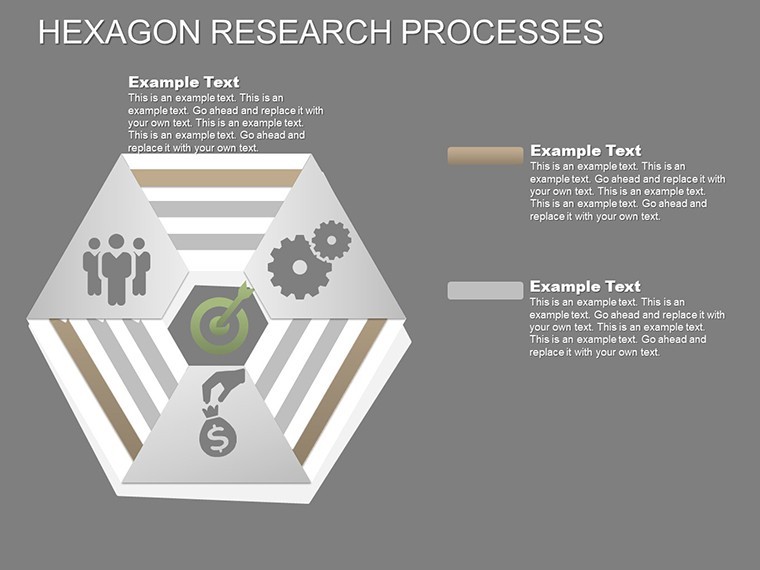
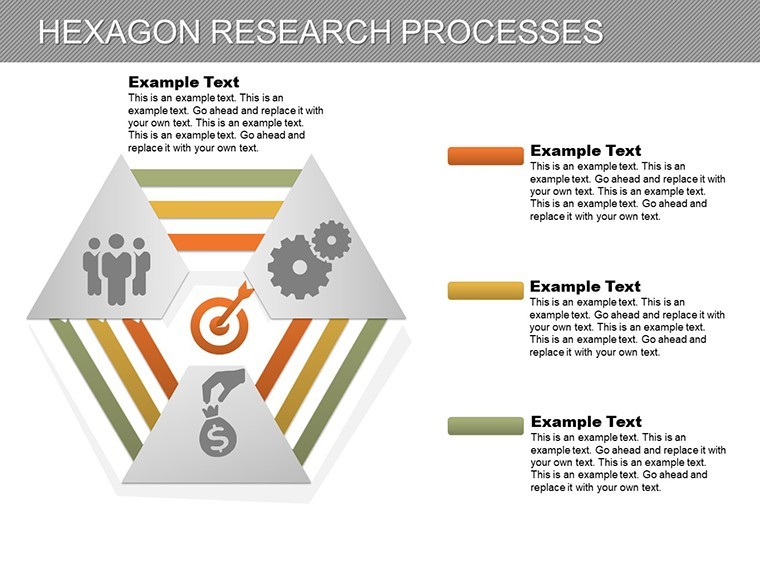
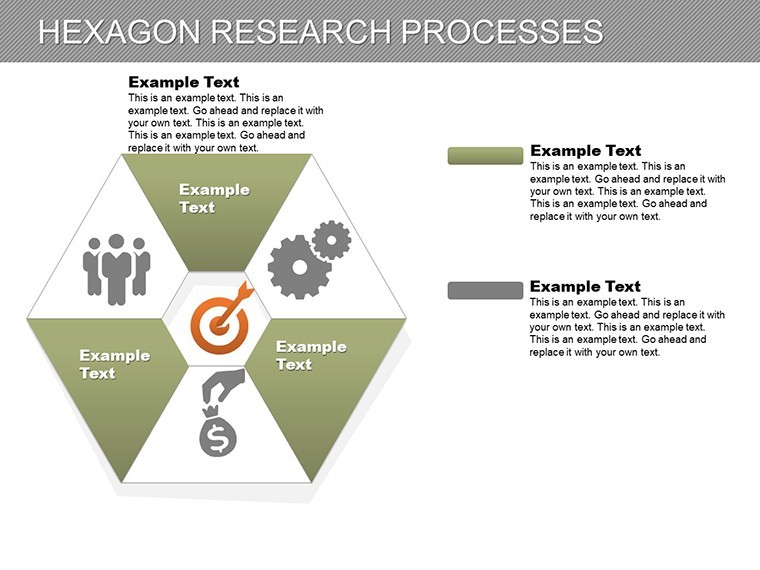
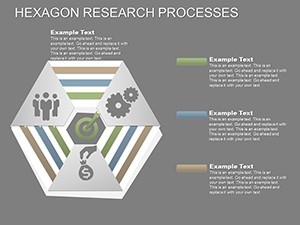
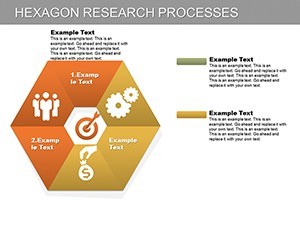
- Adaptive Color Schemes: Earthy tones for grounded processes, or vibrant hues for creative cycles - edit via theme manager.
- Integrated Data Tools: Embed live charts; hexagons overlay perfectly for layered insights.
To integrate, simply duplicate a slide, input your data via Keynote's build tools, and apply global themes for consistency. This approach has helped consulting teams visualize supply chain cycles, reducing presentation prep time by 40% according to user feedback.
Practical Use Cases Across Industries
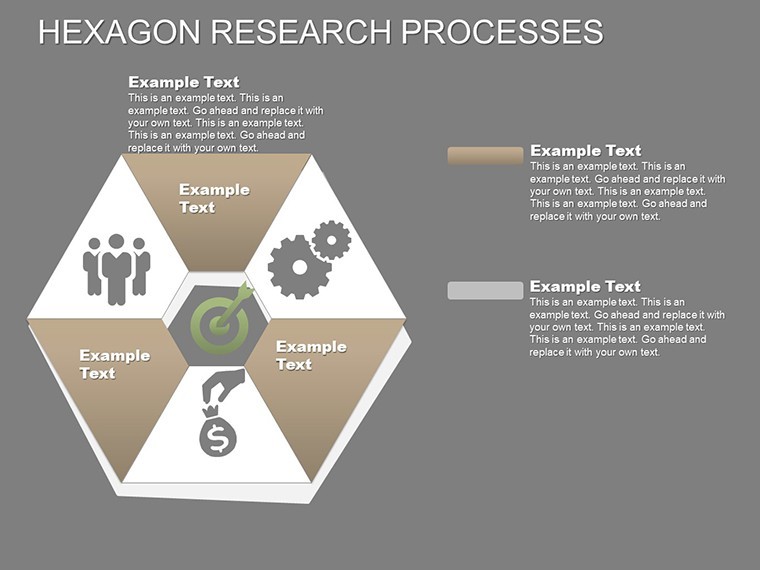
Business leaders can use slide 14's interconnected hexagons to map customer journeys, highlighting touchpoints and pain areas. In healthcare training, adapt for patient care pathways, ensuring compliance with standards like HIPAA through clear, editable flows.
Picture a startup pitch: Employ the template's radial hexagon on slide 25 to show growth loops, impressing venture capitalists with polished, data-driven visuals. Unlike basic shapes in default software, these hexagons offer depth, with subtle gradients that add a professional sheen.
Your Customization Roadmap
- Import Base Template: Launch in Keynote and select a starting slide matching your process type.
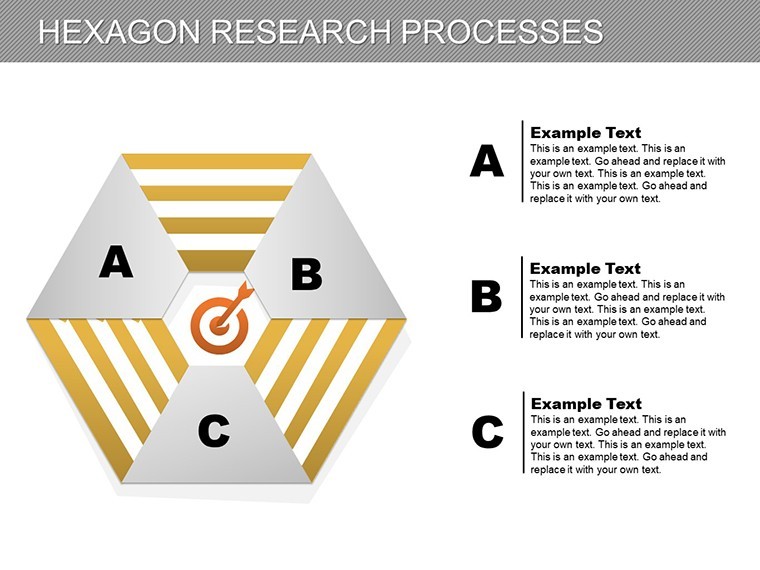
- Populate with Content: Add text labels and icons; use smart guides for alignment.
- Enhance with Media: Insert timelines or infographics into hexagon segments - slide 9 is primed for this.
- Animate for Impact: Set build orders to reveal one hexagon at a time, building narrative tension.
- Finalize and Export: Review in presentation mode; share via cloud links for team edits.
Advanced tweaks include linking hexagons to external data sources for real-time updates, ideal for dashboard-style reports.
Elevating Beyond Standard Templates
While generic process charts feel flat, this template's hexagons provide a modern, honeycomb-inspired edge that aligns with contemporary design trends from sources like Adobe's creative reports. Compatible across platforms, it ensures your visuals remain intact during collaborations.
With 70% of executives preferring visual aids for decision-making (Forbes insights), this tool positions you ahead. Secure your Hexagon Processes Keynote Charts Template now and cycle your presentations to new heights of efficiency and appeal.
Frequently Asked Questions
Can I use this in Google Slides?
Yes, import the .key file into Google Slides; animations convert well, with minor adjustments for full fidelity.
What process types does it cover?
It spans linear workflows, cycles, and networks, with 29 slides adaptable to business, education, or creative uses.
Are the hexagons resizable?
Definitely - being vector-based, they scale infinitely while keeping sharp edges and colors intact.
How do I add custom icons?
Keynote's library integrates easily; drag and drop into hexagon slots, or import SVGs for uniqueness.
Is animation support robust?
Yes, each slide has preset animations, customizable for speed and direction to suit your pace.
What's the file size?
Optimized at under 10MB, ensuring quick loads and easy sharing without compromising quality.