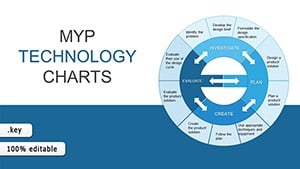
Adaptation Keynote Charts: 3D Cycle Templates for Project Evolution


Architecture is all about adaptation - evolving designs to meet client needs, environmental demands, and regulatory shifts. Our Adaptation Keynote Charts template brings this philosophy to life with 14 editable slides focused on 3D cycle diagrams. Perfect for illustrating research processes, project phases, or adaptive strategies in urban planning, this tool helps architects like you define essential components and requirements seamlessly. Whether presenting to AIA panels on sustainable retrofits or internal teams on iterative design workflows, these charts reflect the core content of your work with clarity and style.
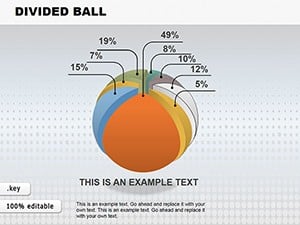
Envision a cycle chart depicting the adaptive reuse of a historic building: From assessment to implementation, each loop highlights key milestones. With intuitive editing in Keynote, you can refine these visuals to express complex adaptations, making your presentations not just informative but transformative. Drawing from real-world cases, like the High Line's evolution in New York, this template empowers you to showcase how designs adapt over time, fostering trust and engagement.
Essential Features for Adaptive Design
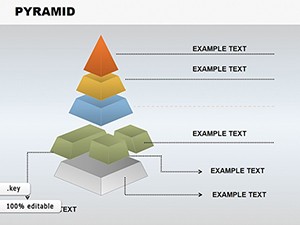
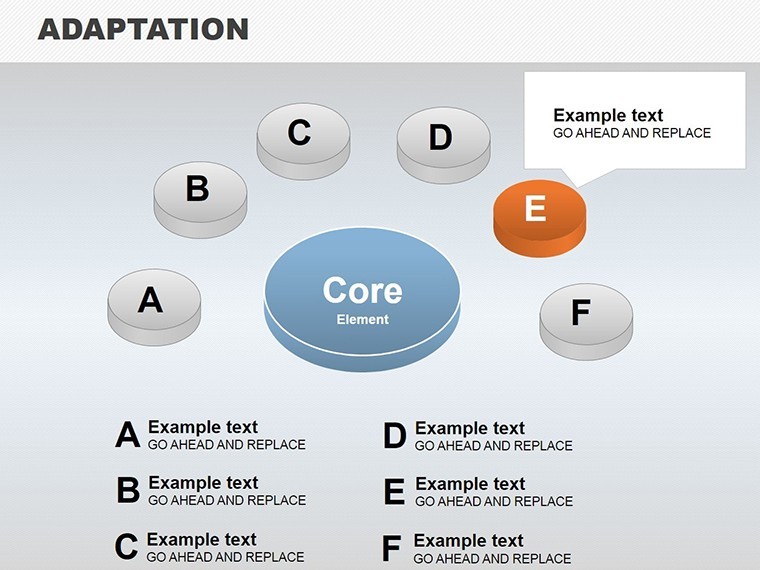
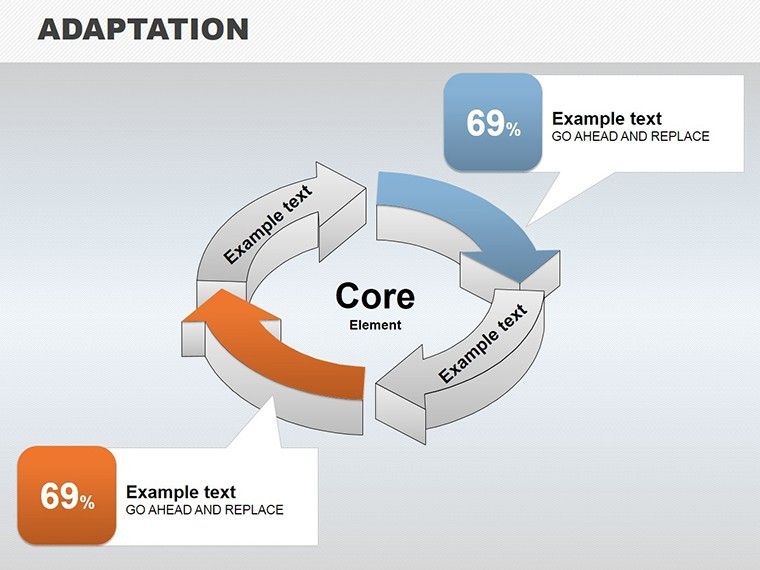
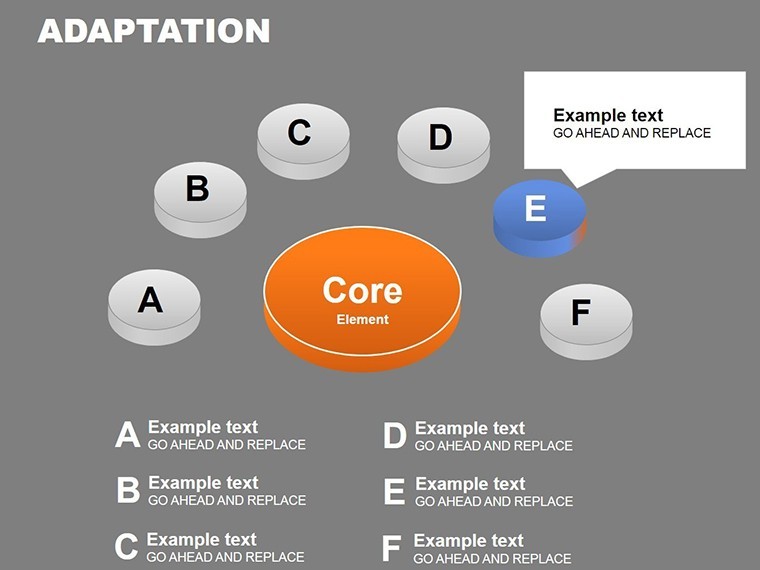
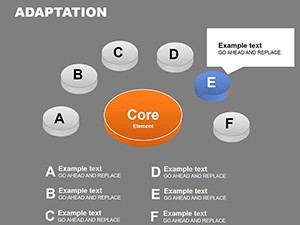
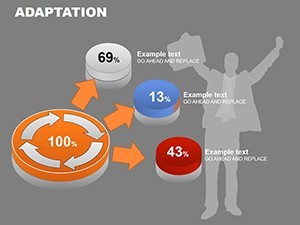
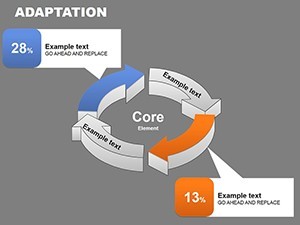
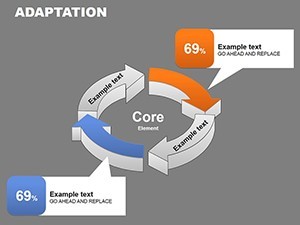
This template's strength lies in its 3D cycle charts, which add depth to flat presentations, mimicking the multidimensional nature of architecture. Each of the 14 slides is crafted for high adaptability, allowing quick modifications to suit specific projects.
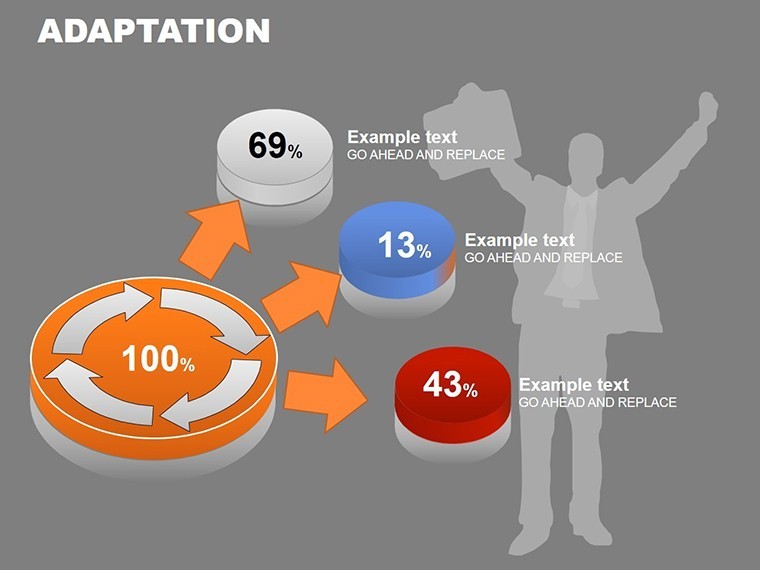
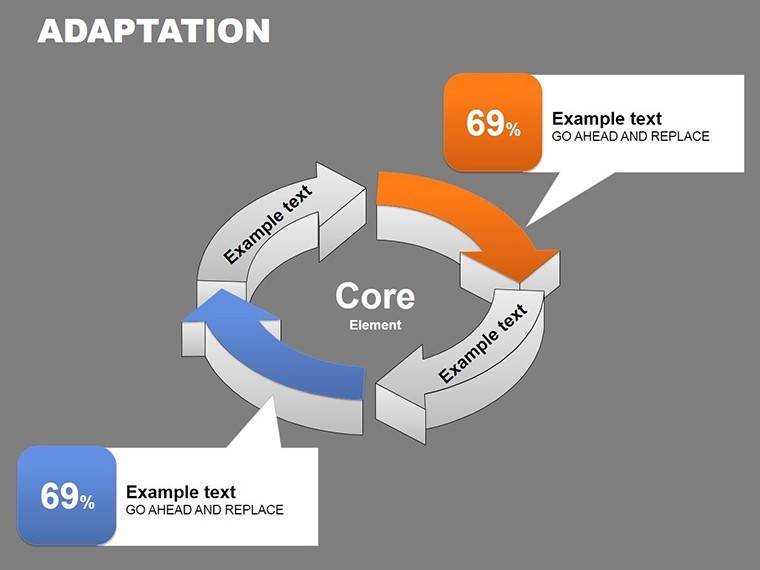
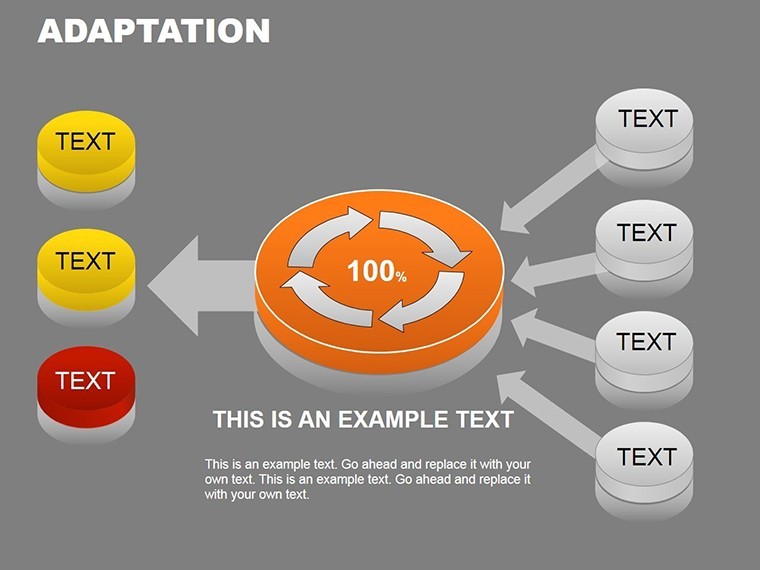
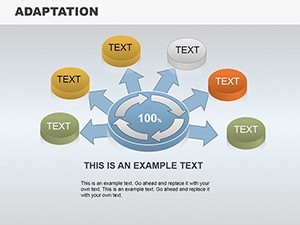
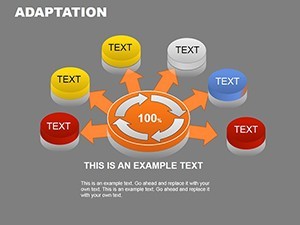
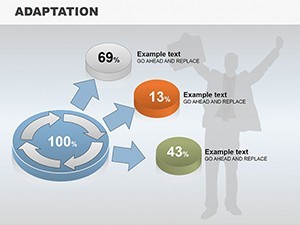
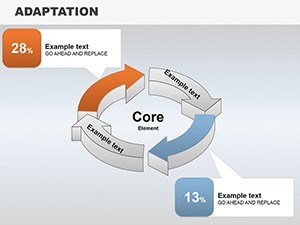
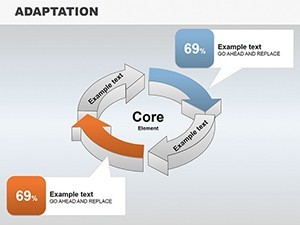
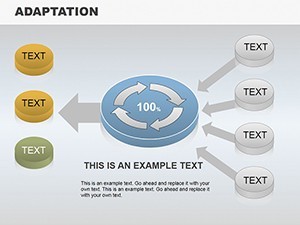
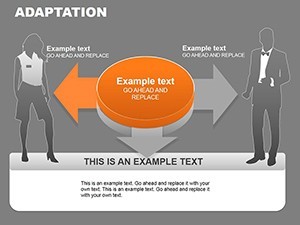
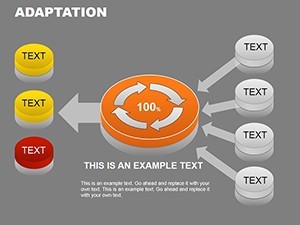
- 3D Cycle Visuals: Dynamic loops that rotate data points, ideal for showing iterative processes like design-build cycles.
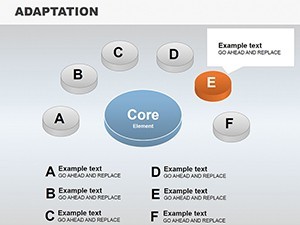
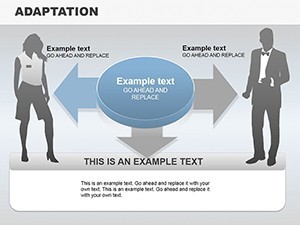
- Editable Elements: Change text, colors, and shapes with drag-and-drop ease, aligning with your adaptive strategies.
- Data Integration: Link to spreadsheets for real-time updates, crucial for evolving project timelines.
- Thematic Icons: Include adaptive symbols like arrows or gears to enhance narrative flow.
- Cross-Device Compatibility: Works flawlessly on Keynote across devices, for on-the-go adaptations.
Incorporating LSI terms like "cycle infographics" and "3D presentation tools," it boosts your content's relevance in searches.
Use Cases Tailored to Architectural Adaptation
For adaptive reuse projects, use a cycle chart to map phases: Demolition, preservation, integration. This visual aids in AIA award submissions by demonstrating thoughtful evolution. In sustainable architecture, illustrate carbon footprint reductions through adaptive cycles, referencing LEED standards.
Step-by-step: 1. Identify core components. 2. Input data into cycles. 3. Customize 3D effects. 4. Add annotations. 5. Present adaptively.
Detailed Slide Insights
Slides 1-4: Simple cycles for basic adaptations.Slides 5-9: Multi-loop 3D for complex evolutions.Slides 10-14: Interactive variants with hover effects.
Tips: Use contrasting depths for emphasis, per visual hierarchy principles in design.
Superior to Standard Tools
Unlike basic Keynote cycles, this offers 3D depth and adaptability, cutting prep time. Integrate with Revit for data flow.
Pro Tips for Adaptive Mastery
Adapt charts to audience feedback in real-time, echoing agile methodologies in architecture.
Adapt your presentations now - download and evolve your ideas into reality.
FAQ
- How do I edit the 3D cycles?
- Drag elements or use Keynote's inspector for precise adaptations.
- Compatible with iPad Keynote?
- Yes, fully responsive for mobile editing.
- Suitable for non-architects?
- Versatile for any process-oriented field.
- File types?
- .key, exportable to others.
- Branding integration?
- Easily apply your palette and logos.
- Animation support?
- Built-in for dynamic cycles.