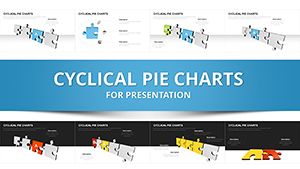
Puzzle Matrix Keynote Charts: Transform Data into Engaging Stories


Type: Keynote Charts template
Category: Matrix, Business Models, Puzzles
Sources Available: .key
Product ID: KC00124
Template incl.: 12 editable slides
Picture this: your next business report doesn't just list numbers - it pieces them together like a puzzle, revealing insights that captivate your team. The Puzzle Matrix Keynote Charts template brings this vision to life with 12 meticulously designed slides, perfect for marketers, analysts, and project managers seeking to elevate their data storytelling. In an era where attention spans are short, this template uses interlocking puzzle elements and matrix grids to make complex information digestible and memorable, turning dry metrics into dynamic narratives.
Ideal for visualizing sales trends or project interdependencies, it's more than a tool - it's a catalyst for better decision-making. Drawing from design principles seen in award-winning infographics, like those from Information is Beautiful, this template ensures your presentations stand out. Fully compatible with Apple Keynote, it allows effortless customization, from color schemes to layout tweaks, ensuring alignment with your brand's voice.
Core Features That Piece Together Perfection
At the heart of this template are its innovative puzzle and matrix layouts, each slide offering a fresh way to assemble data. Whether you're mapping customer journeys or comparing performance quadrants, the editable elements provide flexibility without the hassle of starting from scratch.
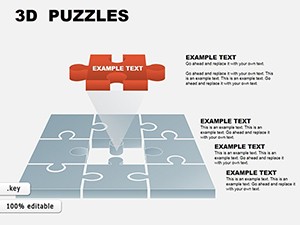
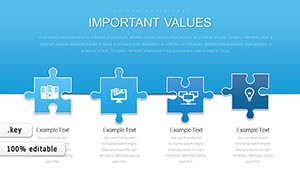
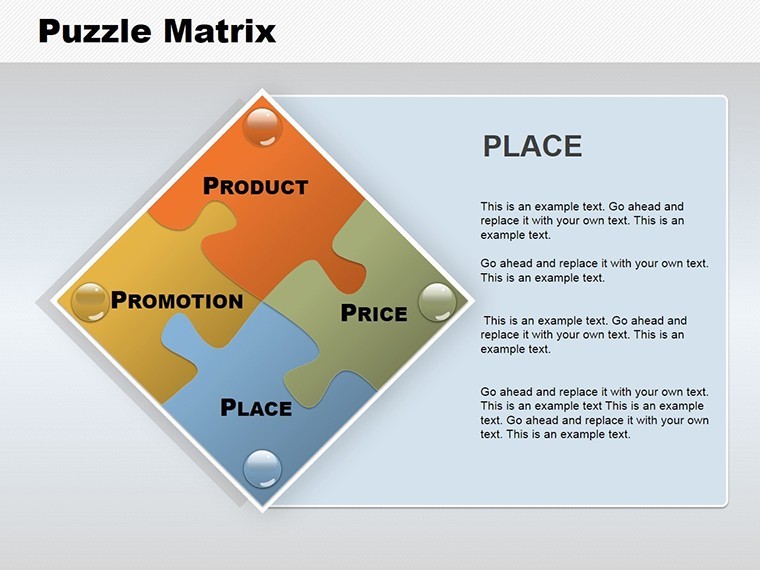
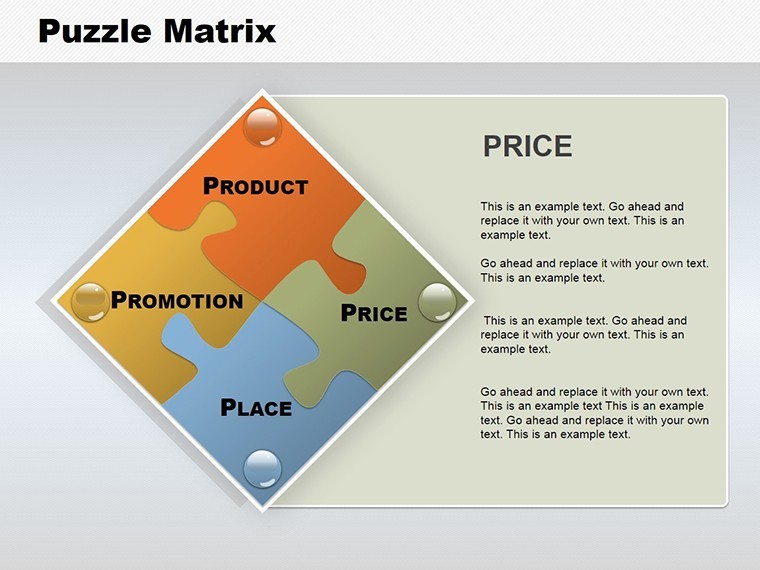
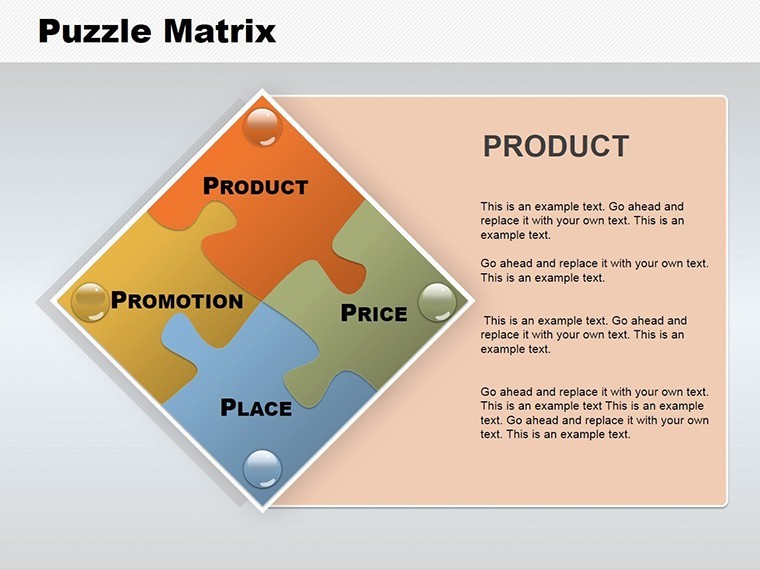
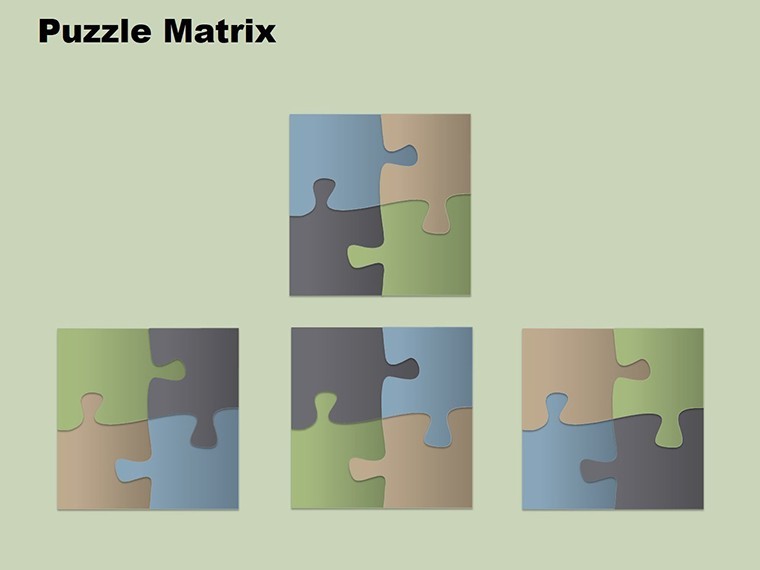
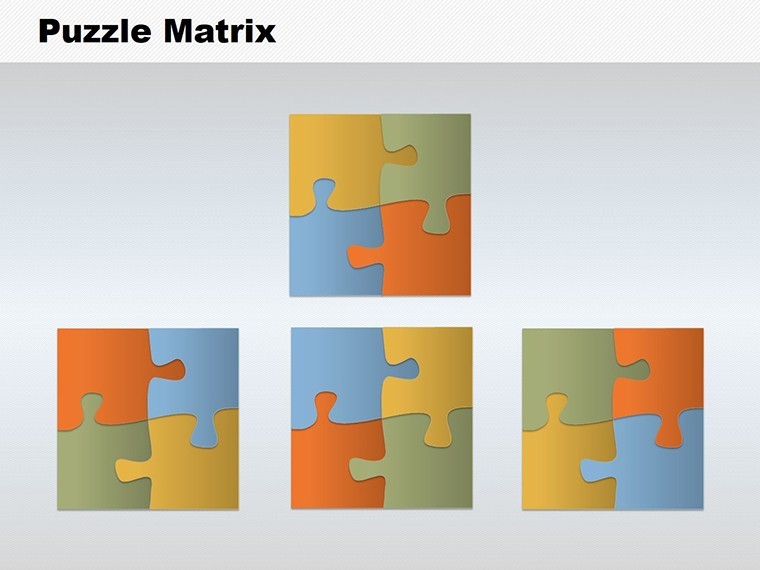
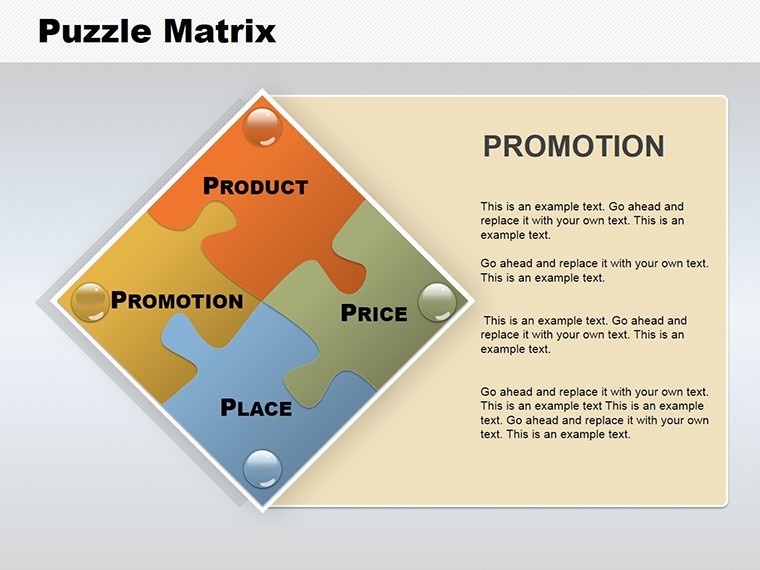
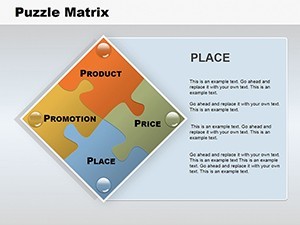
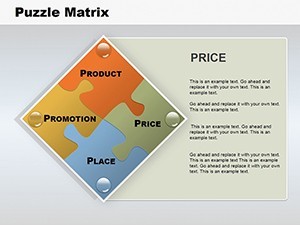
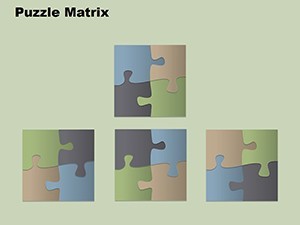
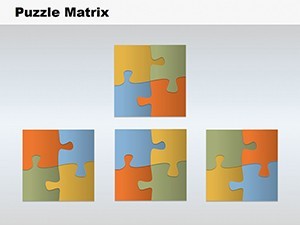
- Interlocking Puzzle Designs: Connect data points visually to show relationships and completions.
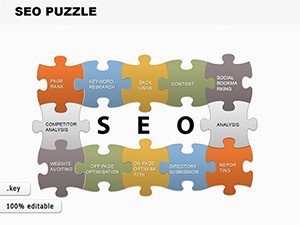
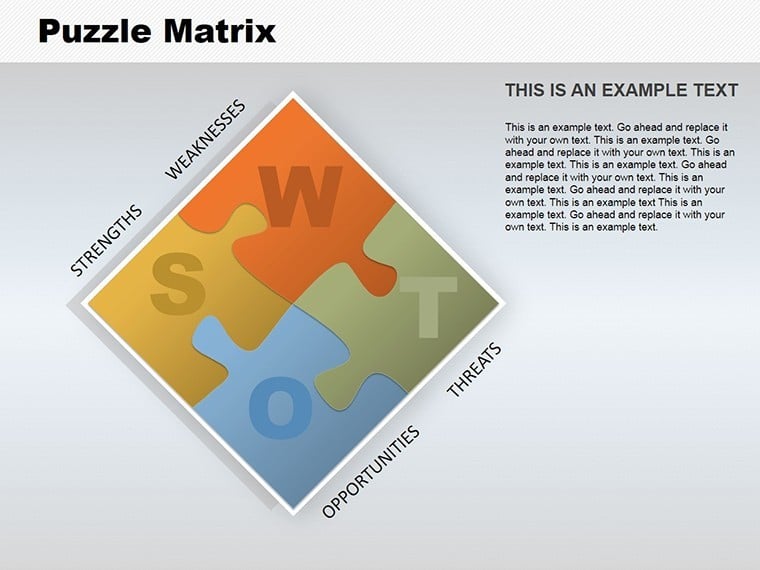
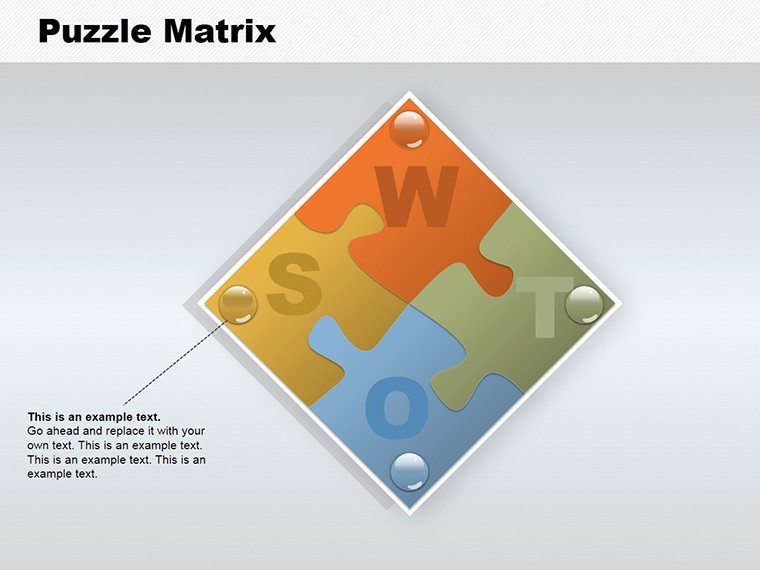
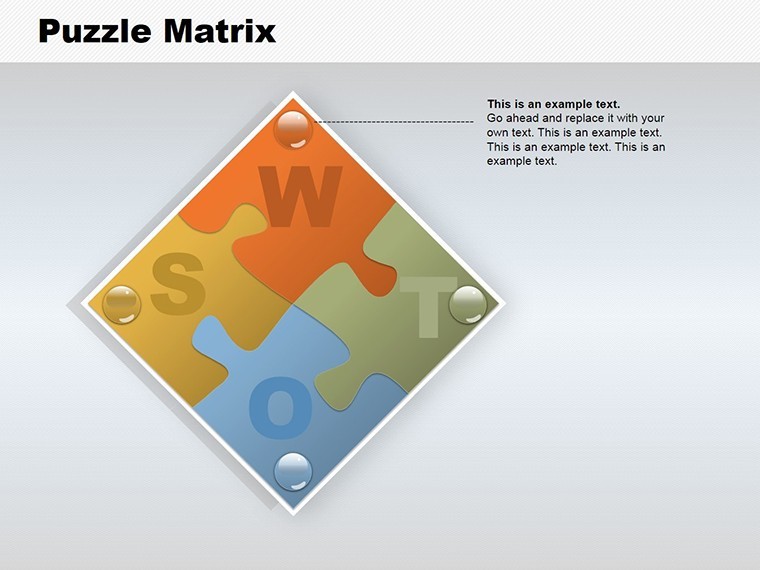
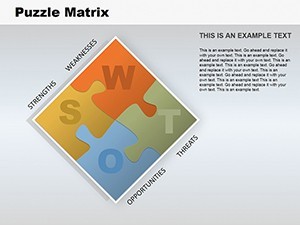
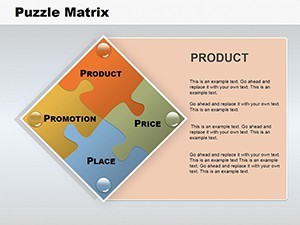
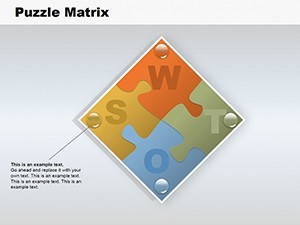
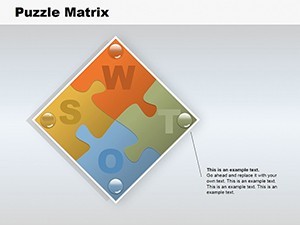
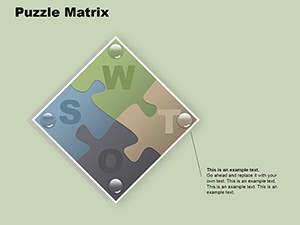
- Matrix Grids: Organize information in rows and columns for clear comparisons, like SWOT or BCG matrices.
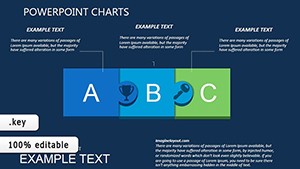
- Customizable Visuals: Adjust puzzle shapes, add icons, and integrate charts for tailored fits.
- Diverse Slide Options: From overview puzzles to detailed breakdowns, covering various data depths.
These aren't just features; they're backed by expertise in visual psychology, where puzzles enhance recall by engaging problem-solving brain areas. A real estate firm, for example, used similar matrices to puzzle out market segments, resulting in a 20% uptick in targeted campaigns - proving the template's practical edge.
Unlocking Benefits for Your Workflow
The benefits extend beyond visuals to efficiency. Say goodbye to mismatched designs; this template's cohesive theme ensures professional polish. For beginners, intuitive editing means no steep learning curve, while pros appreciate the depth for advanced animations.
In marketing plans, it shines by piecing together consumer behaviors; in projects, it matrices timelines against resources. Compared to standard Keynote charts, it offers superior engagement, with users noting higher interaction rates in virtual meetings.
Use Cases: From Reports to Real Impact
Apply it step-by-step: Start with a puzzle slide for high-level overviews, then drill down with matrices. For a marketing metric presentation: 1) Input data into puzzle pieces; 2) Color-code for emphasis; 3) Animate assembly during your talk.
In business reports, use it to matrix sales by region, revealing patterns at a glance. A tech startup leveraged this for investor decks, puzzling growth projections against risks, securing partnerships. Themed icons add creativity - think gear pieces for processes or lightbulbs for ideas - without clutter.
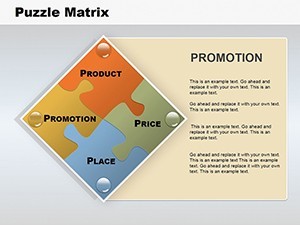
- Marketing Strategies: Piece together campaign elements for holistic views.
- Project Management: Matrix tasks vs. timelines for efficient planning.
- Data Analysis: Connect metrics to uncover hidden insights.
Integration tips: Link with Excel for data pulls, use master themes for branding. LSI terms like "data matrix visualization" weave naturally, boosting discoverability.
Pro Tips from a Design Veteran
Enhance with subtle humor - label a puzzle piece "The Missing Link" for incomplete data. For trustworthiness, include source citations in footnotes. This template's shines through its adaptability, much like tools praised in design forums.
Why This Template Fits Your Needs
It spotlights user-focused value: engaging visuals that solve presentation pitfalls. Elevate your data game - grab this Puzzle Matrix template and assemble success.
Frequently Asked Questions
Are the puzzle pieces fully editable? Yes, resize, recolor, and rearrange to suit your data.
Does it work only in Keynote? Primarily for Keynote, but exportable to other formats.
Suitable for beginners? Absolutely, with easy-to-use interfaces.
How many data types can it handle? Versatile for metrics, timelines, and more.